Abstract
OBJECTIVE
The purpose of this study was to correlate skeletal pathologic findings quantified by MRI-based bone marrow burden score with genotype and spleen status and other clinical parameters, including liver size and duration of enzyme replacement therapy, in patients with Gaucher’s disease.
MATERIALS AND METHODS
Two radiologists retrospectively reviewed MR images of 47 patients with Gaucher’s disease and determined bone marrow burden scores by consensus on the basis of previously published criteria. The bone marrow burden scores were correlated with genotype, liver volume, spleen status, age, and cumulative duration of enzyme replacement therapy.
RESULTS
Subjects with compound heterozygous N370S alleles had significantly higher overall, lumbar spinal, and femoral bone marrow burden scores than did N370S homozygotes. There was a significant positive correlation between an enlarged or surgically absent spleen and bone marrow burden score. There were no significant associations between bone marrow burden score and liver volume, age, cumulative duration of enzyme replacement therapy, or cumulative duration of untreated disease. Femoral and lumbar spinal bone marrow burden scores had a weak but significant positive correlation across all patients.
CONCLUSION
Skeletal pathologic findings in Gaucher’s disease encapsulated as bone marrow burden score correlate significantly with the number of copies of the N370S allele, which has an ameliorative effect on bone marrow disease. Splenectomy or splenomegaly is associated with greater risk of bone marrow disease. Femoral and lumbar spinal bone marrow burden scores, although only weakly correlated, independently illustrated both the protective role of the N370S allele and the unfavorable implication of splenectomy. This finding suggests that axial and appendicular bone marrow burdens are related but distinct and justifies multiple-compartment evaluation in Gaucher’s disease.
Keywords: one marrow burden score, Gaucher’s disease, MRI
Gaucher’s disease (GD), the most common lysosomal storage disorder, is caused by deficiency of the enzyme β-glucocerebrosidase. Accumulation of glucocerebroside in the liver, spleen, and bone marrow results in the clinical manifestations of hepatosplenomegaly, anemia, thrombocytopenia, bone pain, and skeletal disability. In nonneuronopathic GD, skeletal manifestations usually produce the greatest morbidity and long-term disability, causing serious complications, such as osteonecrosis and pathologic fractures, in more than 50% of patients [1–3].
Genetic factors play an important but not determinative role in the development of skeletal involvement in GD. Among patients of Ashkenazi Jewish descent, the four mutations N3 70S, 84GG, L444P, andIVS2+l account for at least 90% of cases of symptomatic GD [4]. In the United States, most patients have at least one copy of the N370S allele [5]. Homozygosity for N370S is associated with a milder phenotype, and a single copy of the N370S allele is considered protective against neuronopathic disease [6]. In contrast, the L444P mutation has been associated with a more disabling course, including neuronopathic manifestations and severe skeletal involvement [7].
Enzyme replacement therapy with purified macrophage-targeted human β-glucocerebro-sidase has been shown to arrest or reverse the biochemical, hematologic, visceral, and skeletal abnormalities of GD [8–10]. Although many bone lesions respond to enzyme replacement therapy, osteonecrosis, osteosclerosis, and vertebral compression are generally irreversible [4, 11]. In the era of enzyme replacement therapy, sensitive assessment and monitoring of skeletal disease are critical to timely intervention before permanent disability is incurred [4]. Quantitative MRI-based methods have been developed to measure bone marrow infiltration in GD. The most promising is Dixon quantitative chemical shift imaging (QCSI) [12]. Results of QCSI of the lumbar spine are reproducible [13], correlate with disease activity as indicated by spleen size [14], and are sensitive for bone marrow response to enzyme replacement therapy [9]. Despite these advantages, QCSI is available at only a few academic centers worldwide and thus is not a realistic option in most clinical settings.
Because of the practical limitations of QCSI, multiple semiquantitative approaches to bone marrow disease in GD have been developed, including a variety of scoring systems based on predictable changes in MR signal intensity and anatomic distribution [15]. The characteristic progression of disease within the femur, from proximal metaphysis to diaphysis to proximal and then distal epiphysis, has been the principal, if not the sole, criterion on which most previously reported scoring systems have been based. Reflecting this bias, in current published imaging guidelines [4] and actual clinical practice, MRI evaluation of skeletal disease in GD is of ten limited to the femurs. Maas and colleagues [16] proposed an alternative bone marrow burden scoring system that in corporates signal intensity and distribution parameters for the lumbar spine in addition to the femurs. In an investigation in which the subjects were 30 patients with previously untreated GD, Maas et al. found promising features of the bone marrow burden in terms of reproducibility, correlation with QCSI findings, and sensitivity as an indicator of response to enzyme replacement therapy.
In this study, we sought to apply the bone marrow burden scoring system to a large, unselected group of patients with GD and to explore correlations between bone marrow burden score and genotype and additional clinical parameters, such as liver volume, spleen status, age, cumulative duration of enzyme replacement therapy, and cumulative duration of untreated disease.
Materials and Methods
Subjects
The study was approved by the institutional human investigation committee, which waived the requirement for informed consent, and was compliant with the HIPAA. The study was performed at a university hospital that is a regional referral center for GD. A computer search of the institutional imaging report database was performed to identify patients with GD who underwent MRI of the lumbar spine and femurs between January 2002 and March 2006. All available corresponding medical records were reviewed for clinical parameters of interest. Patients were retrospectively included in the study if simultaneous sagittal T1-weighted and STIR images (or, in the case of two patients, fat-suppressed T2-weighted images) of the lumbar spine and coronal T1-weighted and STIR images of the femurs were available; liver and spleen volumes had been calculated on the basis of findings on concurrent volumetric MRI of the abdomen; genotype analysis had been performed; and a history of enzyme replacement therapy was available, including the date of initiation and the chronology of regimen changes. Patients younger than 18 years were ex- cluded from the study to minimize the confounding effect of hematopoietic bone marrow. In this review, 47 patients with GD were identified and formed the study population.
Imaging Protocol
All patients underwent MRI of the lumbar spine and both femurs with a 1.5-T system. Lumbar spinal imaging was performed with a phased-array spine coil and consisted of a sagittal T1-weighted sequence (TR/TE, 600/13; bandwidth, 15.63 kHz; matrix size, 512 × 256; number of signals averaged, 2; field of view, 28 cm2; spacing, 4:1 mm) and a sagittal fast spin-echo STIR sequence (2,925/60; inversion time, 140 milliseconds; echo-train length, 8; bandwidth, 15.63 kHz; matrix size, 256 × 192; number of signals averaged, 4; field of view, 28 cm2; spacing, 4:1 mm). For two patients, a sagittal fat-suppressed fast spin-echo T2-weighted sequence with parameters similar to those of the other sequences was used instead of the STIR sequence. Femoral imaging was performed with a phased-array torso coil and consisted of a coronal T1-weighted sequence (725/14; bandwidth, 15.63 kHz; matrix size, 256 × 160; number of signals averaged, 1; field of view, 36 cm2; spacing, 4:1 mm) and a coronal fast spin-echo STIR sequence (7,250/60; inversion time, 140 milliseconds; echo-train length, 8; bandwidth, 31.25 kHz; matrix size, 256 × 224; number of signals averaged, 2; field of view, 36 cm2; spacing, 4:1 mm).
Bone Marrow Burden Evaluation
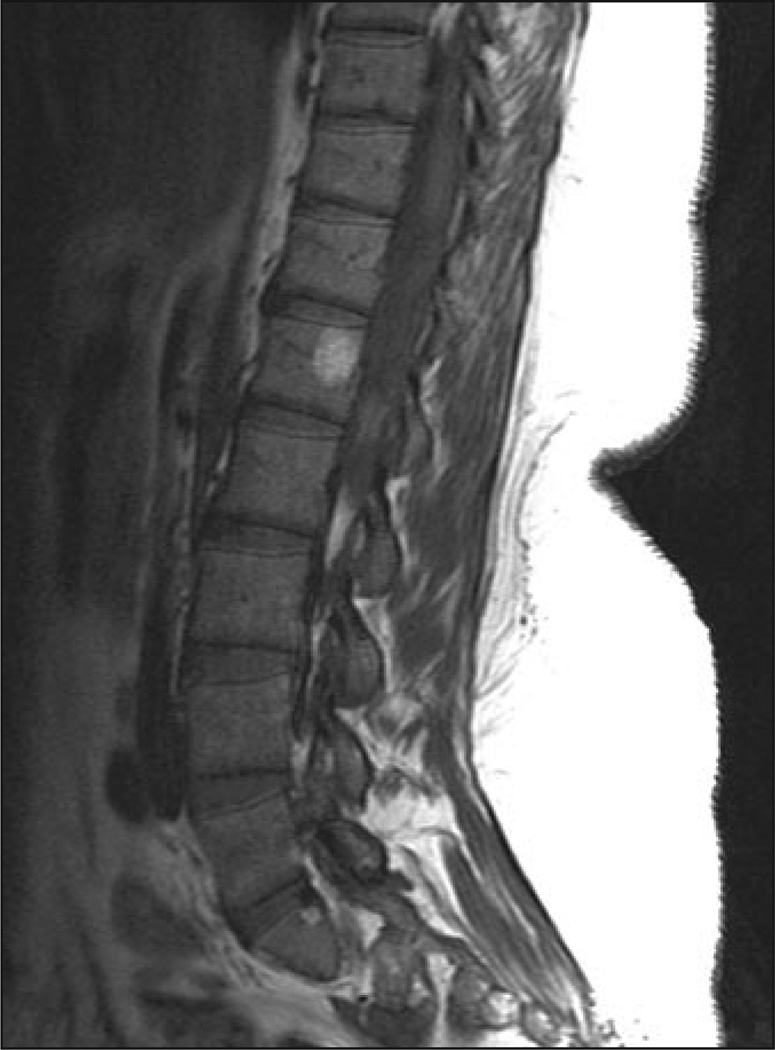
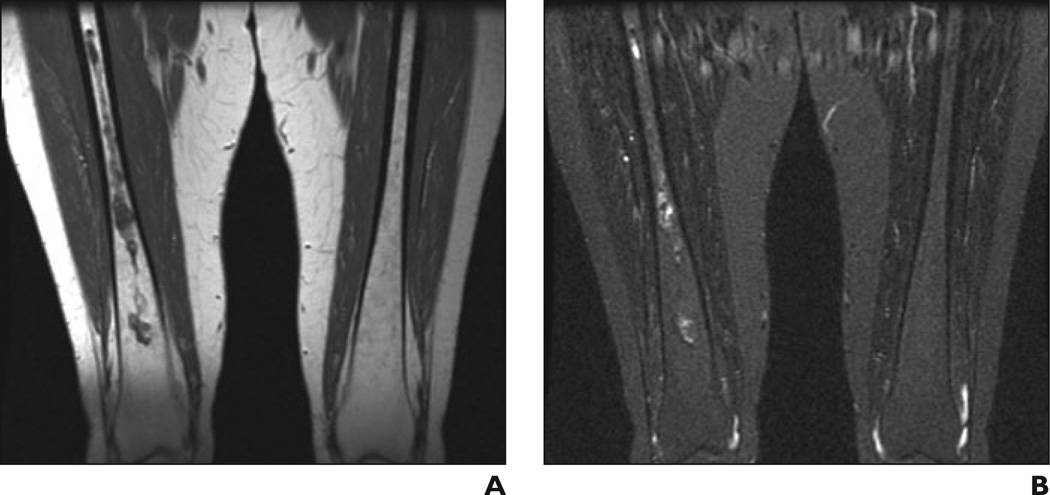
Two radiologists with 10 and 3 years of experience analyzed all MR images and assigned bone marrow burden scores by consensus. Both readers were blinded to clinical parameters. Bone marrow burden scores at each anatomic location were based on signal intensity and distribution according to a modified version of previously published criteria [16] (Tables 1 and 2) and ranged from 0 to 8 for the lumbar spine (Figs. 1–4) and from 0 to 8 for the femurs (Figs. 5–7), for an overall score of 0–16. For determining the femoral site of involvement, hip or knee replacement was interpreted as evidence of proximal or distal femoral epiphyseal disease. In all equivocal cases, scoring was performed according to a worst-case standard.
TABLE 1.
Bone Marrow Burden Scoring Criteria: Signal Intensity
| Lumbar Spine | Femur | ||
|---|---|---|---|
| Intensity | Points | Intensity | Points |
| STIR sequence | STIR sequence | ||
| Hyperintense | 2 | Hyperintense | 2 |
| Slightly hyperintense | 1 | Slightly hyperintense | 1 |
| Isointense | 0 | Isointense | 0 |
| Slightly hypointense | NA | Slightly hypointense | NA |
| Hypointense | NA | Hypointense | NA |
| Mixed type | 3 | ||
| T1-weighted sequence | T1-weighted sequence | ||
| Slightly hyperintense | 0 | Slightly hyperintense or isointense | 0 |
| Isointense | 1 | Slightly hypointense | 1 |
| Slightly hypointense | 2 | Hypointense | 2 |
| Hypointense | 3 | ||
Note—Intensity is relative to subcutaneous fat, except for the lumbar spine T1-weighted sequence, which is relative to nondiseased intervertebral disk. N A = not applicable. Adapted with permission from Maas M, van Kujik C, Stoker J, et al. Quantification of bone involvement in Gaucher disease: MR imaging bone marrow burden score as an alternative to Dixon quantitative chemical shift MR imaging—initial experience. Radiology 2003;229:554–561 [16].
TABLE 2.
Bone Marrow Burden Scoring Criteria: Anatomic Distribution
| Lumbar Spine | Femur | ||
|---|---|---|---|
| Infiltration Pattern | Points | Site of Involvement | Points |
| Patchy | 1 | Diaphysis | 1 |
| Diffuse | 2 | Proximal epiphysis or apophysis | 2 |
| Absence of fat around basivertebral vein | 1 | Distal epiphysis | 3 |
Note— Adapted with permission from Maas M, van Kujik C, Stoker J, et al. Quantification of bone involvement in Gaucher disease: MR imaging bone marrow burden score as an alternative to Dixon quantitative chemical shift MR imaging—initial experience. Radiology 2003; 229:554–561 [16].
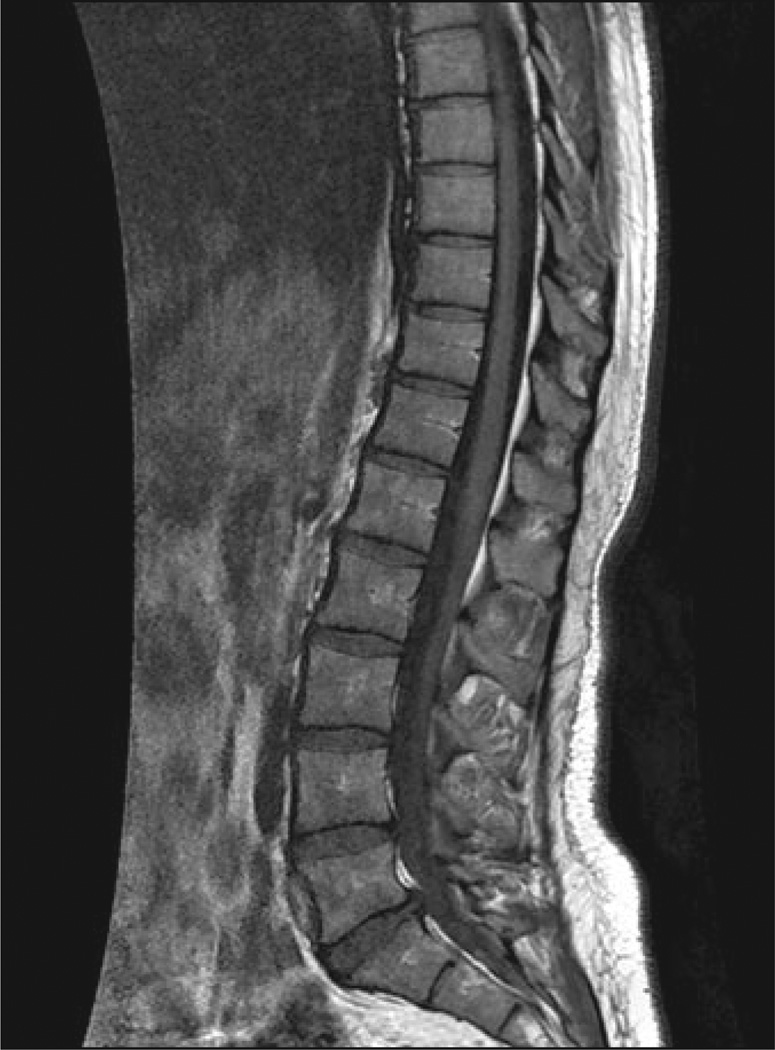
Fig. 1.
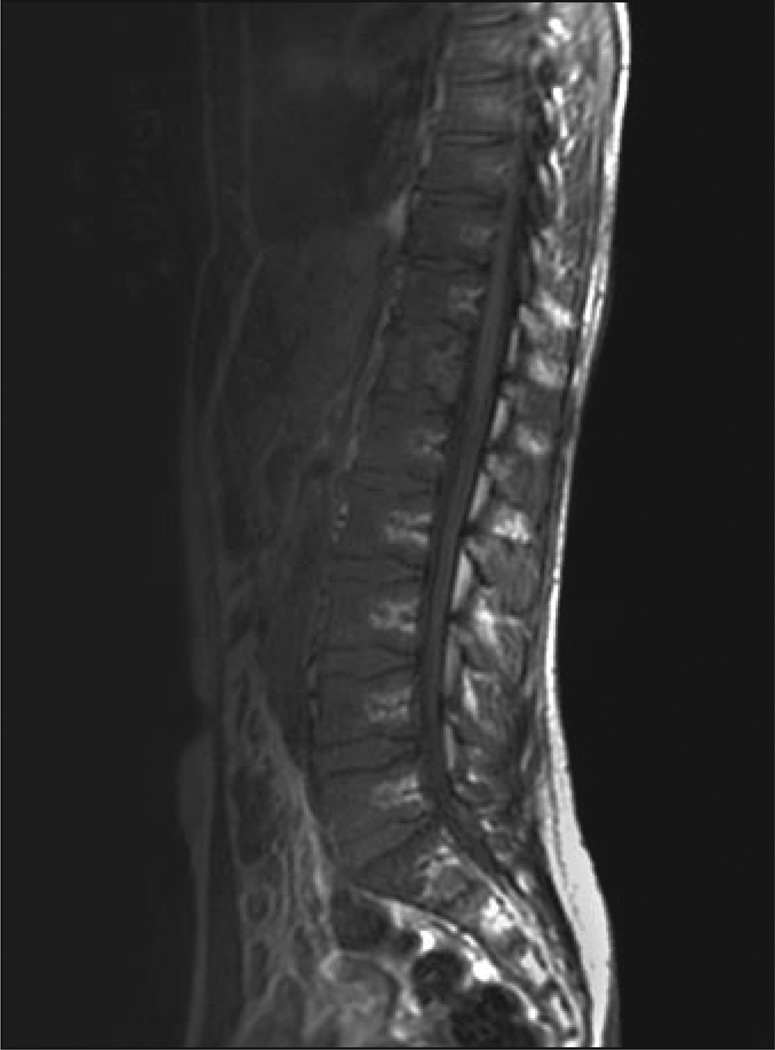
28-year-old woman with Gaucher's disease. Sagittal T1-weighted MR image shows normal bone marrow signal intensity is high in relation to nondiseased intervertebral disk signal intensity. Findings on STIR image (not shown) also were normal. Bone marrow burden score is 0.
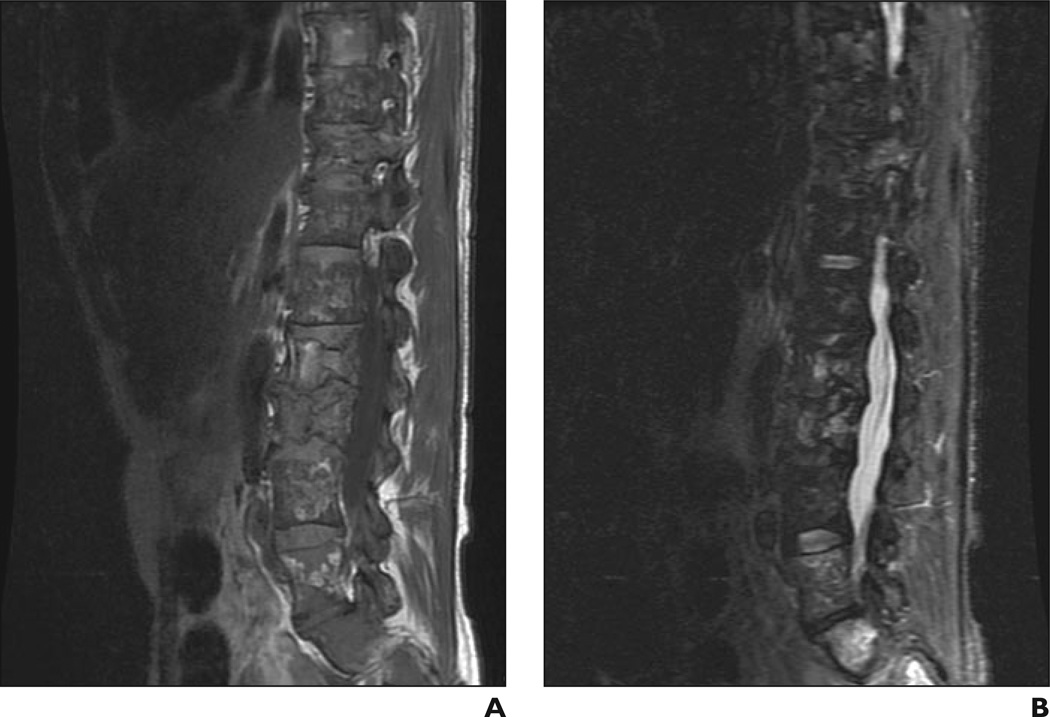
Fig. 4.
49-year-old man with Gaucher's disease.
A and B, Sagittal T1 -weighted (A) and STIR (B) MR images show bone marrow infiltration, infarction, and fractures. Patchy area of low signal intensity is evident in A, as are absence of fat around basivertebral vein and high signal intensity in B. Bone marrow burden score is 7 (5 for intensity, 2 for distribution).
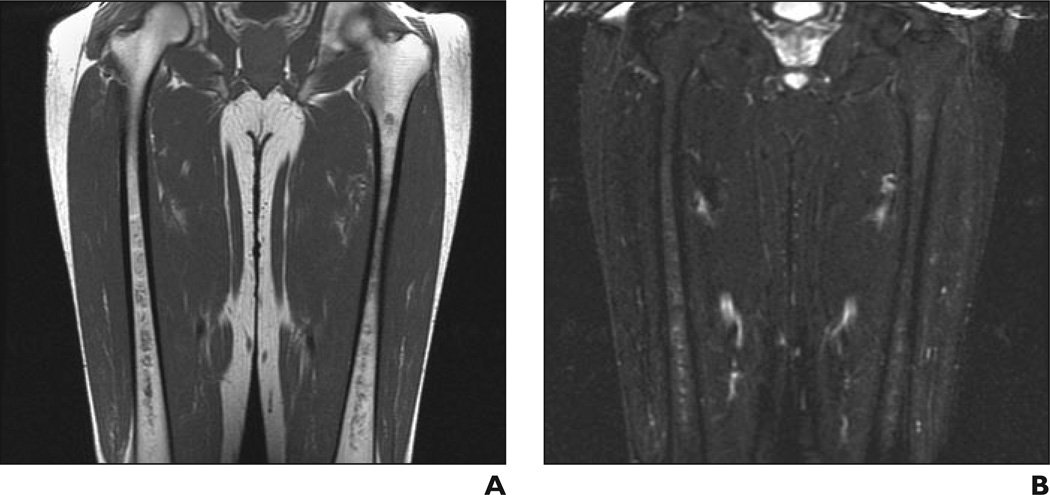
Fig. 5.
41-year-old man with Gaucher's disease.
A and B, Coronal T1-weighted (A) and STIR (B) MR images show minimal bone marrow infiltration with slightly low (A) and slightly high (B) signal intensity in both femurs with diaphyseal distribution. Bone marrow burden score is 3 (2 for intensity, 1 for distribution).
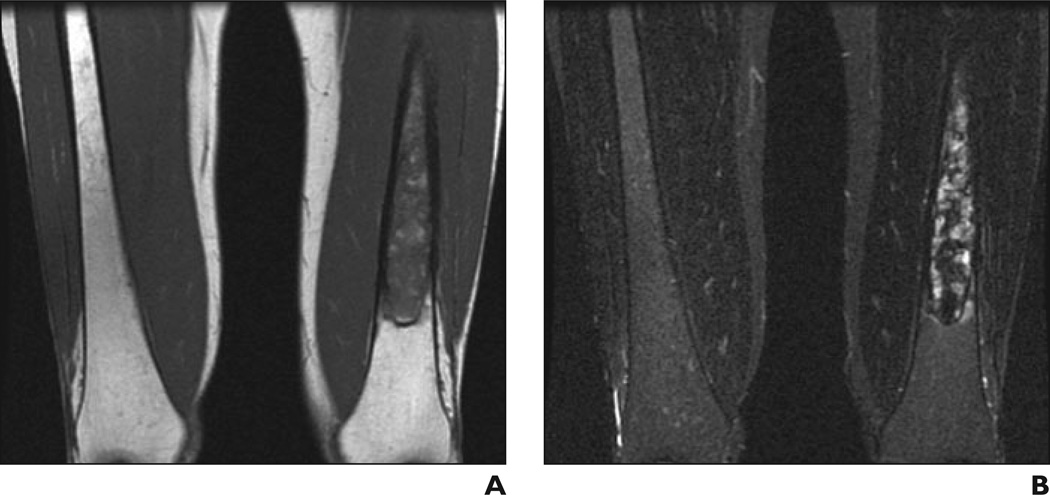
Fig. 7.
41-year-old woman with Gaucher's disease.
A and B, Coronal T1-weighted (A) and STIR (B) MR images show low (A) and high (B) signal intensity in diaphyseal distribution in left femur. Bone marrow burden score is 6 (5 for intensity, 1 for distribution).
Clinical Data
Clinical data acquisition was conducted by one author and included patient age and sex, genotype, liver and spleen volumes (calculated from concurrent findings on volumetric MRI of the abdomen), history of splenectomy, and details of enzyme replacement therapy (date of initiation and chronology of regimen changes). Because all patients had at least one copy of the N370S allele, for primary data analysis, genotype was classified as N370S homozygous and N370S compound heterozygous. Because nearly one half (20 of 47) of the patients had undergone splenectomy, spleen status was treated as a categoric variable, with a value of 0 for spleen size within the range of normal, 1 for an enlarged spleen (> 200 cm2 in diameter), and 2 for a surgically absent spleen. Regarding the statistical analysis of enzyme replacement therapy, both the cumulative duration of therapy and the cumulative duration of untreated disease (defined as age minus cumulative duration of enzyme replacement therapy) were considered.
Statistical Analysis
Data were analyzed with SAS software (version 9.1, SAS). Differences between groups were analyzed with the nonparametric Wilcoxon’s test. Correlation was calculated with two-tailed non-parametric Spearman’s rank correlation (p). A value of p < 0.05 was considered significant.
Results
The clinical information and imaging data are summarized in Table 3. The study population consisted of 47 patients (27 women, 20 men; mean age, 44.6 years; range, 18–71 years). All patients had at least one copy of the N370S allele. Nineteen (40%) of the patients were homozygous for N370S, and 28 (60%) were compound heterozygous with one N370S allele and one other mutant allele. Genotypes in the heterozygous group were distributed as follows: eight patients (17% of total study population) with N370SIL444P, seven (15%) with N370S/84GG, six (13%) with N370S/IVS+2, five (11%) with N370S/? (the question mark denoting an uncharac-terized mutant allele), and one (2%) each with N370S/R131L and N370S/V394L. Thirty-seven (79%) of the 47 patients were undergoing enzyme replacement therapy. The homozygous and heterozygous groups each included five patients with previously untreated disease. The homozygous and compound heterozygous groups did not differ significantly in age distribution, cumulative duration of enzyme replacement therapy, or cumulative duration of untreated disease. There were, however, significantly more women in the homozygous group (79%, 15 of 19) than in the heterozygous group (43%, 12 of 28)(p= 0.02).
TABLE 3.
Patient Characteristics
| Genotype | Sex | Age(y) | Duration of Enzyme Replacement Therapy (y) |
No Treatment (y) |
Liver Volume (cm3) |
Spleen Statusa |
Bone Marrow Burdenb |
Other | ||
|---|---|---|---|---|---|---|---|---|---|---|
| Lumbar Spine | Femur | Total | ||||||||
| N370S/N370S | F | 53 | 8 | 45 | 1,503 | 1 | 0 | 7 | 7 | Left hip replacement |
| N370S/N370S | F | 37 | 0 | 37 | 2,015 | 1 | 4 | 2 | 6 | |
| N370S/N370S | F | 50 | 8 | 42 | 1,342 | 2 | 0 | 0 | 0 | |
| N370S/N370S | F | 57 | 8 | 49 | 1,460 | 0 | 0 | 3 | 3 | |
| N370S/N370S | M | 54 | 1 | 53 | 1,912 | 1 | 5 | 3 | 8 | |
| N370S/N370S | F | 51 | 1 | 50 | 2,438 | 1 | 4 | 3 | 7 | |
| N370S/N370S | F | 68 | 8 | 60 | 1,700 | 2 | 3 | 5 | 8 | Right hip replacement |
| N370S/N370S | F | 26 | 0 | 26 | 1,798 | 1 | 0 | 3 | 3 | |
| N370S/N370S | F | 18 | 0 | 18 | 1,826 | 1 | 3 | 3 | 6 | |
| N370S/N370S | M | 22 | 7 | 15 | 1,072 | 1 | 3 | 3 | 6 | |
| N370S/N370S | M | 49 | 9 | 40 | 976 | 2 | 8 | 7 | 15 | Right knee replacement |
| N370S/N370S | F | 48 | 13 | 35 | 648 | 0 | 0 | 4 | 4 | |
| N370S/N370S | F | 55 | 7 | 48 | 713 | 0 | 3 | 5 | 8 | |
| N370S/N370S | F | 71 | 2 | 69 | 1,138 | 0 | 0 | 8 | 8 | |
| N370S/N370S | F | 37 | 6 | 31 | 1,623 | 1 | 0 | 3 | 3 | |
| N370S/N370S | F | 53 | 0 | 53 | 885 | 0 | 4 | 3 | 7 | |
| N370S/N370S | F | 43 | 6 | 37 | 1,563 | 0 | 0 | 3 | 3 | |
| N370S/N370S | F | 60 | 1 | 59 | 1,360 | 1 | 0 | 3 | 3 | |
| N370S/N370S | M | 32 | 0 | 32 | 1,720 | 1 | 7 | 3 | 10 | |
| N370S/L444P | M | 58 | 0 | 58 | 1,915 | 2 | 7 | 7 | 14 | |
| N370S/L444P | F | 33 | 4 | 29 | 2,297 | 2 | 7 | 4 | 11 | Left hip replacement |
| N370S/L444P | F | 33 | 5 | 28 | 1,403 | 2 | 3 | 7 | 10 | Right hip replacement, right knee replacement |
| N370S/L444P | M | 50 | 3 | 47 | 1,205 | 2 | 8 | 8 | 16 | Multiple vertebral compression fractures |
| N370S/L444P | M | 23 | 1 | 22 | 1,569 | 1 | 4 | 3 | 7 | |
| N370S/L444P | F | 47 | 11 | 36 | 823 | 2 | 8 | 8 | 16 | Bilateral hip replacement |
| N370S/L444P | F | 50 | 8 | 42 | 880 | 2 | 3 | 8 | 11 | Bilateral hip replacement, right knee replacement |
| N370S/L444P | M | 70 | 0 | 70 | 1,707 | 1 | 5 | 4 | 9 | |
| N370S/84GG | M | 37 | 8 | 29 | 1,170 | 2 | 3 | 6 | 9 | Multiple vertebral compression fractures |
| N370S/84GG | M | 35 | 10 | 25 | 1,587 | 1 | 0 | 3 | 3 | |
| N370S/84GG | F | 67 | 11 | 56 | 1,180 | 2 | 0 | 6 | 6 | |
| N370S/84GG | F | 46 | 5 | 41 | 1,780 | 2 | 6 | 6 | 12 | Multiple vertebral compression fractures |
| N370S/84GG | M | 70 | 9 | 61 | 1,063 | 2 | 0 | 2 | 2 | |
| N370S/84GG | M | 22 | 0 | 22 | 2,219 | 1 | 5 | 3 | 8 | |
| N370S/84GG | F | 51 | 13 | 38 | 1,294 | 2 | 8 | 8 | 16 | Sacral infarcts |
| N370S/IVS2+1 | M | 18 | 14 | 4 | 1,692 | 1 | 0 | 2 | 2 | |
| N370S/IVS2+1 | M | 25 | 21 | 4 | 1,266 | 1 | 4 | 5 | 9 | |
| N370S/IVS2+1 | F | 28 | 5 | 23 | 1,970 | 1 | 3 | 7 | 10 | |
| N370S/IVS2+1 | M | 50 | 12 | 38 | 842 | 1 | 4 | 6 | 10 | Left hip replacement |
| N370S/IVS2+1 | F | 41 | 1 | 40 | 1,068 | 2 | 5 | 7 | 12 | Bilateral hip replacement |
| N370S/IVS2+1 | M | 46 | 10 | 36 | 1,751 | 2 | 8 | 5 | 13 | |
| N370S/7 | F | 32 | 14 | 18 | 1,918 | 1 | 4 | 6 | 10 | |
| N370S/7 | M | 49 | 0 | 49 | 1,407 | 2 | 6 | 3 | 9 | |
| N370S/7 | M | 58 | 11 | 47 | 1,291 | 2 | 0 | 7 | 7 | |
| N370S/7 | F | 57 | 1 | 56 | 2,160 | 2 | 8 | 8 | 16 | |
| N370S/7 | M | 30 | 1 | 29 | 1,906 | 1 | 5 | 7 | 12 | Right hip replacement |
| N370S/V394L | M | 47 | 0 | 47 | 1,780 | 1 | 4 | 4 | 8 | |
| N370S/R131L | F | 41 | 9 | 32 | 2,334 | 2 | 8 | 8 | 16 | |
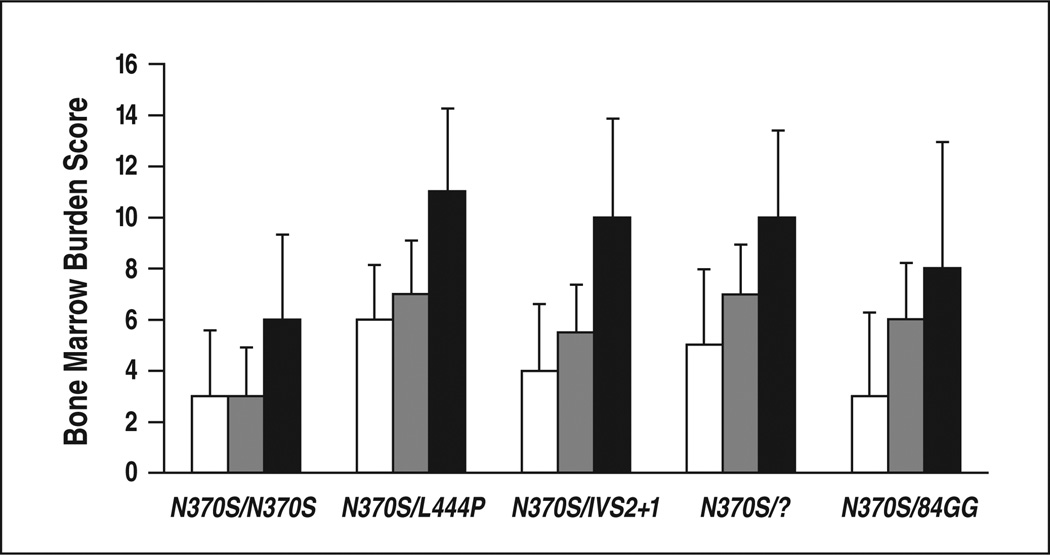
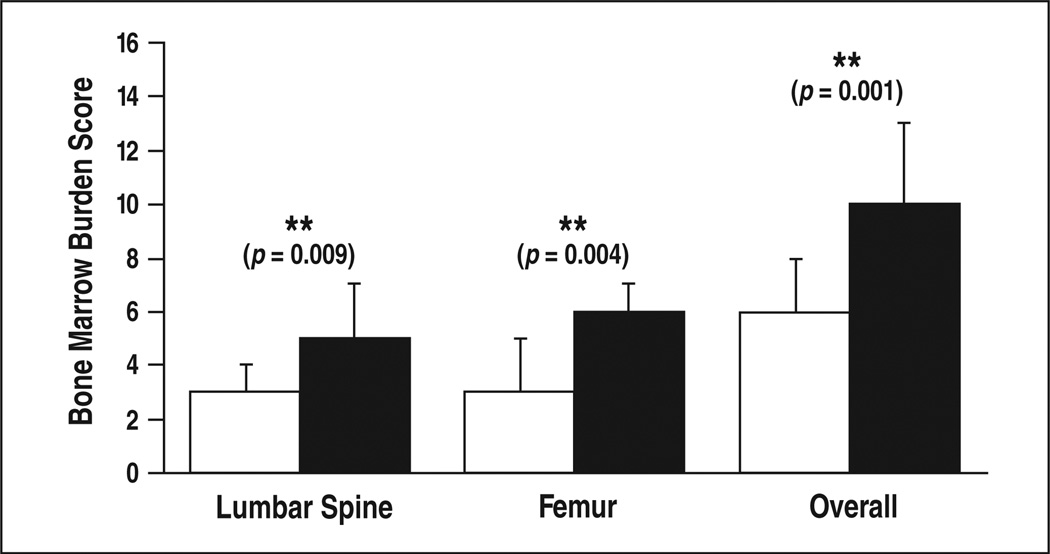
Compound heterozygotes had more severe skeletal disease than did homozygotes, having higher overall bone marrow burden scores (p < 0.001), lumbar spinal bone marrow burden scores (p < 0.01), and femoral bone marrow burden scores (p < 0.01) (Table 4, Fig. 8). Within the homozygous group, overall bone marrow burden scores ranged from 0 to 15 (median, 6), lumbar spinal bone marrow burden scores from 0 to 8 (median, 3), and femoral bone marrow burden scores from 0 to 8 (median, 3). Within the heterozygous group, overall bone marrow burden scores ranged from 2 to 16 (median, 10), lumbar spinal bone marrow burden scores from 0 to 8 (median, 5), and femoral bone marrow burden scores from 2 to 8 (median, 6). Considering all genotypes with at least five patients, N370S/ L444P was associated with the greatest burden of skeletal disease (median overall bone marrow burden score, 11). All five patients with maximal skeletal disease (overall bone marrow burden score, 16) were compound heterozygotes, two with N370S/ L444P and one each with N370S/84GG, N370S/?, and N370S/R131L. Perhaps owing to the small numbers of patients, there were no statistically significant differences in skeletal disease between the various compound heterozygous subgroups. Femur and lumbar spine bone marrow burden scores were weakly but significantly correlated across all patients (ρ = 0.40, p 0.01) (Fig. 9). In subgroup analysis, this correlation persisted for the compound heterozygotes (ρ = 0.43, p = 0.02) but was nonexistent among the N370S homozygotes (ρ = –0.04, p = 0.87). The difference, however, was not statistically significant (p = 0.12).
TABLE 4.
N370S Homozygote and Compound Heterozygote Comparison Statistics
| Variable |
N370S Homozygotes(n=19) |
N370S Heterozygotes (n= 28) |
Pa | ||
|---|---|---|---|---|---|
| Median | Quantile (25–75%) |
Median | Quantile (25–75%) |
||
| No. of women | 15(79%) | 12(43%) | 0.02b,c | ||
| Age(y) | 50 | 37–55 | 46 | 33–51 | 0.33 |
| Duration of enzyme replacement therapy (y) |
6 | 0–8 | 7 | 1–11 | 0.15 |
| Liver volume (cm3) | 1,503 | 1,072–1,798 | 1,578 | 1,193–1,911 | 0.55 |
| Spleen status score | 1 | 0–1 | 2 | 1–2 | <0.001c |
| Bone marrow burden score | |||||
| Lumbar spine | 3 | 0–4 | 5 | 3–7 | <0.01c |
| Femur | 3 | 3–5 | 6 | 4–7 | <0.01c |
| Total | 6 | 3–8 | 10 | 8–13 | <0.001c |
Wilcoxon's test.
Fisher's exact probability.
Statistically significant.
Fig. 8.
Graph shows relation between bone marrow burden and genotype. White indicates lumbarspine; gray, femurs; black, overall.
Fig. 9.
Graph shows relation between bone marrow burden and genotype for patients with homozygous (white) and those with heterozygous (black) N370S allele.
Considering all patients, there was a significant association between an enlarged or surgically absent spleen and more severe bone marrow infiltration in both the axial and appendicular skeletons, reflected as positive correlations between spleen status and overall bone marrow burden score (ρ = 0.51, p < 0.001), lumbar spinal bone marrow burden score (ρ = 0.43, p < 0.01), and femoral bone marrow burden score (ρ = 0.42, p < 0.01) (Table 4). In subgroup analysis, there was a trend toward greater skeletal disease with abnormal spleen status in all instances except for femoral bone marrow burden in the N370S homozygous group. This trend, however, was significant only for overall bone marrow burden score (ρ = 0.46, p = 0.01) and femoral bone marrow burden score (ρ = 0.47, p = 0.01) in the compound heterozygous group.
There was a significant negative correlation between liver volume and cumulative duration of enzyme replacement therapy across all patients (ρ = −0.42, p < 0.01). This trend was also found in subgroup analysis and was significant for homozygotes (ρ = −0.56, p = 0.01) but not for compound heterozygotes (p = −0.36, p = 0.06). There were no significant associations between skeletal disease and liver volume, age, cumulative duration of enzyme replacement therapy, or cumulative duration of untreated disease.
Discussion
To our knowledge, this study is the first to implement bone marrow burden scoring in an unselected group of patients with GD and to explore the relation between bone marrow burden score and genotype. Our subjects were generally representative of the U.S. population of patients with GD in terms of distribution of genotypes and prevalence of enzyme replacement therapy. The severity of bone marrow infiltration correlated significantly with genotype, specifically with the number of copies of the N370S allele. Homozygotes with two copies of the N370S allele had significantly lower bone marrow burden scores than compound heterozygotes with only one copy of the N370S allele.
Although there were no statistically significant differences between the compound heterozygote subgroups, the N370S/L444P genotype was associated with uniformly severe skeletal disease, two of eight patients having the maximum possible bone marrow burden score and five of eight patients having advanced irreversible pathologic changes in the form of having undergone total joint replacement or having vertebral compression fractures. Severe bone marrow burden was also generally evident in the N370S/IVS+2 and N370SI? genotypes. The N370S/84GG genotype exhibited substantial variability in degree of bone marrow infiltration.
The correlation between genotype and bone marrow burden in our study was generally concordant with published data regarding associations between genotype and disease severity in GD. The ameliorative effect of the N370S allele and the unfavorable effect of other mutations, particularly L444P, are well known and appear partially attributable to differential glucocerebrosidase enzyme activity. For example, Pasmanik-Chor and colleagues [17], using a vaccinia virus-derived system to express normal and mutated glucocerebrosidase in human cells, found that the N370S enzyme has activity comparable with that of its normal counterpart, whereas other mutant enzymes, including L444P and 84GG, have significantly less activity.
The relation between spleen status and bone marrow burden in our study was in agreement with earlier observations. Patients who had undergone splenectomy or who had splenomegaly had significantly higher bone marrow burden scores, both in the axial and appendicular skeletons, than did those with intact, normal-sized spleens. This finding substantiates a previously reported [18] association between splenectomy and skeletal lesions and supports the notion that compromise of the splenic reservoir of GD cells accelerates progression of disease in other compartments.
The absence of a significant correlation between enzyme replacement therapy and bone marrow infiltration is our most striking negative finding but must be interpreted with caution given that our primary objective was to explore the association between genotype and skeletal disease. Enzyme replacement therapy was at best a secondary consideration, incorporated mainly to mitigate its potential as a confounding factor. This investigational bias is reflected in our method, particularly its static framework, which handicapped our ability to discern the influence of enzyme replacement therapy on bone marrow disease over time. Numerous previous studies have shown that enzyme replacement therapy decreases glucocerebroside accumulation and increases normal fat content in bone marrow [11]. In the earlier studies, longitudinal data were used to explore intraindividual rather than interindividual differences related to enzyme replacement therapy. Future investigations incorporating longitudinal bone marrow burden data are needed, not only to validate the sensitivity of bone marrow burden scoring as an indicator of response to enzyme replacement therapy but also to assess the relation between genotype and the efficacy of enzyme replacement therapy.
Femoral and lumbar spinal bone marrow burden scores correlated only weakly, but each score independently illustrated both the protective role of the N370S allele and the unfavorable implication of splenectomy. These results suggest the phenotypic complexity of GD applies not only to individual organ systems but also to the axial and appendicular compartments of the skeleton. If, as Maas and colleagues [16] propose, lumbar bone marrow burden is more reflective of reversible pathologic changes but femoral bone marrow burden is more indicative of static disease, it is natural that these two parameters would overlap to some extent while still conveying distinct information. The multiple-compartment approach of bone marrow burden is an advance over previous scoring systems and highlights the limitation of imaging protocols restricted to the femurs.
In implementing bone marrow burden scoring, we encountered a few practical challenges that were fairly easily overcome. The Maas bone marrow burden guidelines are based on non-fat-suppressed fast spin-echo T2-weighted sequences instead of STIR sequences. STIR imaging is compatible with the premise of bone marrow burden scoring because the inversion pulse affects fat signal intensity uniformly regardless of location. However, with STIR imaging, the femoral signal intensity categories slightly hypo-intense and hypointense relative to subcutaneous fat are no longer applicable, necessitating a modified bone marrow burden scoring system that omits these designations. Because our methods deviated from those in the original report by Maas and colleagues [16], neither the reproducibility nor the validity of our bone marrow burden scores can be assumed. Despite this limitation, we believe STIR imaging is justified because of its superior sensitivity for bone marrow edema compared with a long-TE sequence without fat suppression.
The bone marrow burden criteria were developed and validated for previously untreated patients with GD, presumably with less advanced disease and a low prevalence, if any, of joint replacement. In our study group, 10 of 47 patients had a total of 12 hip and three knee prostheses, which we interpreted as evidence of proximal or distal femoral epiphyseal involvement. Certain clinical scenarios in GD occur with sufficient frequency that they must be anticipated and explicitly addressed in an optimal scoring system. We believe joint prostheses fall into this category.
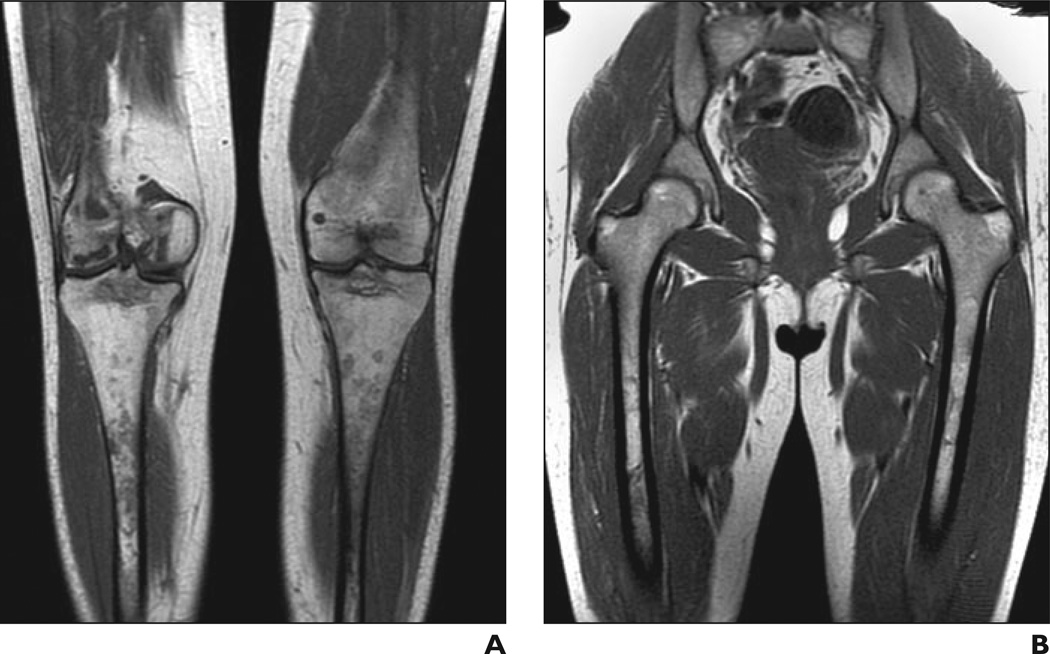
Bone marrow burden scoring is ideally suited to ranking disease as it progresses along a predictable continuum of anatomic distribution or signal intensity, but the pathologic process frequently deviates from its expected trajectory or fails to fit neatly into a single category. One patient in our study, for example, had infarction of the distal but not the proximal femoral epiphyses. We assigned her femoral site of involvement three points, deliberately overlooking the fact that her disease skipped a location (Fig. 10). Because these types of inconsistencies are inevitable in any categoric scoring system, we support general standards for resolving them, such as the worst-case approach, to minimize subjectivity in interpretation.
Fig. 10.
— 29-year-old woman with Gaucher's disease. A , Coronal T1-weighted MR image of lower part of femurs shows low signal intensity in right distal femoral epiphysis consistent with infarction. B , Coronal T1-weighted MR image of upper part of femurs shows normal signal intensity in proximal femoral epiphyses. Pattern deviates from characteristic progression of bone marrow pathologic changes in Gaucher's disease, in which proximal femoral epiphyseal involvement precedes distal epiphyseal involvement.
The bone marrow burden system does not explicitly address irreversible pathologic skeletal changes such as infarction, osteonecrosis, and fracture, a bias justified by its designers on the grounds that “irreversible components would be relatively insensitive to subtle changes in bone marrow invasion” [16]. Consequently, at times the bone marrow burden indicates the presence of discrete, likely irreversible complications in the currency of continuous, reversible bone marrow infiltration, giving the false impression the two processes are, with appropriate weighting, equivalent. This approach is exemplified by the symmetry of the point system used for T2 relaxation, in which equal values are assigned to hypointense bone marrow infiltrated by GD cells and to hyperintense bone marrow that may be infarcted. Chronic irreversible change can inflate the bone marrow burden and exaggerate the impression of reversible bone marrow infiltration, as illustrated by the four patients in our study with a femoral score of 6 or 7 but a lumbar spinal score of 0. All of these patients had evidence of chronic medullary infarcts in the femurs (in three cases confirmed after review of longitudinal MRI data not considered during bone marrow burden assessment) but no signs of reversible bone marrow disease.
Limitations of our study included its retrospective design, relatively small numbers of patients in each subgroup (which may account for the lack of a clear statistical relation between bone marrow burden scores and specific compound heterozygous subgroups), lack of verification of results against the reference standard of Dixon QCSI, and absence of longitudinal data for assessment of changes in bone marrow burden related to natural progression of disease or response to enzyme replacement therapy.
The semiquantitative MRI-based bone marrow burden score indicates the presence of marked ameliorative and adverse effects of the N370S allele and splenectomy, respectively, on bone marrow disease in GD. Axial and appendicular bone marrow burden scores convey related but distinct information and should be individually evaluated. The bone marrow burden scoring system represents an advance in terms of multiple-compartment evaluation of skeletal disease in GD but is limited by lack of differentiation of reversible and irreversible pathologic changes. Future investigation is needed to address this limitation and to explore the interplay between axial and appendicular forms of disease and between genotype and the efficacy of enzyme replacement therapy.
Fig. 2.
32-year-old woman with Gaucher's disease. Sagittal T1-weighted MR image shows patchy bone marrow infiltration, which is hypointense in relation to nondiseased intervertebral disk signal intensity with preservation of fat around basivertebral vein. Findings on STIR image were normal (not shown). Bone marrow burden score is 4 (3 for intensity, 1 for distribution).
Fig. 3.
55-year-old woman with Gaucher's disease. Sagittal T1-weighted MR image shows slightly hypointense bone marrow signal in diffuse distribution with absence of fat around basivertebral vein. Findings on STIR image were normal (not shown). Bone marrow burden score is 5 (2 for intensity, 3 for distribution).
Fig. 6.
70-year-old man with Gaucher's disease.
A and B, Coronal T1-weighted (A) and STIR (B) MR images show low (A) and high (B) signal intensity in diaphyseal distribution in right femur. Bone marrow burden score is 5 (4 for intensity, 1 for distribution).
References
- 1.Hermann G, Pastores GM, Abdelwahab IF, Lorberboym AM. Gaucher disease: assessment of skeletal involvement and therapeutic responses to enzyme replacement. Skeletal Radiol. 1997;26:687–696. doi: 10.1007/s002560050313. [DOI] [PubMed] [Google Scholar]
- 2.Wenstrup RJ, Roca-Espiau M, Weinreb NJ, Bembi B. Skeletal aspects of Gaucher disease: a review. Br J Radiol. 2002;75(suppl 1):A2–A12. doi: 10.1259/bjr.75.suppl_1.750002. [DOI] [PubMed] [Google Scholar]
- 3.Stowens DW, Teitelbaum SL, Kahn AJ, Barranger JA. Skeletal complications of Gaucher disease. Medicine. 1985;64:310–322. doi: 10.1097/00005792-198509000-00003. [DOI] [PubMed] [Google Scholar]
- 4.Charrow I, Esplin JA, Gribble TJ, et al. Gaucher disease: recommendations on diagnosis, evaluation, and monitoring. Arch Intern Med. 1998;158:1754–1760. doi: 10.1001/archinte.158.16.1754. [DOI] [PubMed] [Google Scholar]
- 5.Mankin HJ, Rosenthal DI, Xavier R. Gaucher disease: new approaches to an ancient disease. J Bone Joint Surg Am. 2001;83:748–763. [PubMed] [Google Scholar]
- 6.Grabowski GA. Recent clinical progress in Gaucher disease. Curr Opin Pediatr. 2005;17:519–524. doi: 10.1097/01.mop.0000172702.33128.19. [DOI] [PubMed] [Google Scholar]
- 7.Drugan C, Procopciuc L, Jebeleanu G, et al. Gaucher disease in Romanian patients: incidence of the most common mutations and phenotypic manifestations. Eur J Hum Genet. 2002;10:511–515. doi: 10.1038/sj.ejhg.5200845. [DOI] [PubMed] [Google Scholar]
- 8.Barton NW, Brady RO, Dambrosia JM, et al. Replacement therapy for inherited enzyme deficiency-macrophage-targeted glucocerebrosidase for Gaucher’s disease. N Engl J Med. 1991;324:1464–1470. doi: 10.1056/NEJM199105233242104. [DOI] [PubMed] [Google Scholar]
- 9.Rosenthal DI, Doppelt SH, Mankin HJ, et al. Enzyme replacement therapy for Gaucher disease: skeletal responses to macrophage-targeted glucocerebrosidase. Pediatrics. 1995;96:629–637. [PubMed] [Google Scholar]
- 10.Terk MR, Dardashti S, Liebman HA. Bone marrow response in treated patients with Gaucher disease: evaluation by T1-weighted magnetic resonance images and correlation with reduction in liver and spleen volume. Skeletal Radiol. 2000;29:563–571. doi: 10.1007/s002560000276. [DOI] [PubMed] [Google Scholar]
- 11.Poll LW, Maas M, Terk MR, et al. Response of Gaucher bone disease to enzyme replacement therapy. Br J Radiol. 2002;75(suppl 1):A25–A36. doi: 10.1259/bjr.75.suppl_1.750025. [DOI] [PubMed] [Google Scholar]
- 12.Maas M, Hollak CEM, Akkerman EM, Aerts JM, Stoker J, Den Heeten GJ. Quantification of skeletal involvement in adults with type I Gaucher’s disease: fat fraction measured by Dixon quantitative chemical shift imaging as a valid parameter. AJR. 2002;179:961–965. doi: 10.2214/ajr.179.4.1790961. [DOI] [PubMed] [Google Scholar]
- 13.Maas M, Akkerman EM, Venema HW, Stoker J, Den Heeten GJ. Dixon quantitative chemical shift MRI for bone marrow evaluation in the lumbar spine: a reproducibility study in healthy volunteers. J Comput Assist Tomogr. 2001;25:691–697. doi: 10.1097/00004728-200109000-00005. [DOI] [PubMed] [Google Scholar]
- 14.Johnson LA, Hoppel BE, Gerard EL, et al. Quantitative chemical shift imaging of vertebral bone marrow in patients with Gaucher disease. Radiology. 1992;182:451–455. doi: 10.1148/radiology.182.2.1732964. [DOI] [PubMed] [Google Scholar]
- 15.Maas M, Poll LW, Terk MR. Imaging quantifying skeletal involvement in Gaucher disease. Br J Radiol. 2002;75(suppl 1):A13–A24. doi: 10.1259/bjr.75.suppl_1.750013. [DOI] [PubMed] [Google Scholar]
- 16.Maas M, van Kujik C, Stoker J, et al. Quantification of bone involvement in Gaucher disease: MR imaging bone marrow burden score as an alternative to Dixon quantitative chemical shift MR imaging— initial experience. Radiology. 2003;229:554–561. doi: 10.1148/radiol.2292020296. [DOI] [PubMed] [Google Scholar]
- 17.Pasmanik-Chor H, Madar-Shapiro L, Stein OE, Aerts H, Gatt S, Horowitz M. Expression of mutated glucocerebrosidase alleles in human cells. Hum Mol Genet. 1997;6:887–895. doi: 10.1093/hmg/6.6.887. [DOI] [PubMed] [Google Scholar]
- 18.Mistry P, Germain DP. Phenotype variations in Gaucher disease. Rev Med Interne. 2006;27(suppl1):S3–S6. doi: 10.1016/s0248-8663(06)80002-0. [DOI] [PubMed] [Google Scholar]


