

Abstract
Purpose
Intrinsic glioma subtypes (IGSs) are molecularly similar tumors that can be identified based on unsupervised gene expression analysis. Here, we have evaluated the clinical relevance of these subtypes within European Organisation for Research and Treatment of Cancer (EORTC) 26951, a randomized phase III clinical trial investigating adjuvant procarbazine, lomustine, and vincristine (PCV) chemotherapy in anaplastic oligodendroglial tumors. Our study includes gene expression profiles of formalin-fixed, paraffin-embedded (FFPE) clinical trial samples.
Patients and Methods
Gene expression profiling was performed in 140 samples, 47 fresh frozen samples and 93 FFPE samples, on HU133_Plus_2.0 and HuEx_1.0_st arrays, respectively.
Results
All previously identified six IGSs are present in EORTC 26951. This confirms that different molecular subtypes are present within a well-defined histologic subtype. Intrinsic subtypes are highly prognostic for overall survival (OS) and progression-free survival (PFS). They are prognostic for PFS independent of clinical (age, performance status, and tumor location), molecular (1p/19q loss of heterozygosity [LOH], IDH1 mutation, and MGMT methylation), and histologic parameters. Combining known molecular (1p/19q LOH, IDH1) prognostic parameters with intrinsic subtypes improves outcome prediction (proportion of explained variation, 30% v 23% for each individual group of factors). Specific genetic changes (IDH1, 1p/19q LOH, and EGFR amplification) segregate into different subtypes. We identified one subtype, IGS-9 (characterized by a high percentage of 1p/19q LOH and IDH1 mutations), that especially benefits from PCV chemotherapy. Median OS in this subtype was 5.5 years after radiotherapy (RT) alone versus 12.8 years after RT/PCV (P = .0349; hazard ratio, 2.18; 95% CI, 1.06 to 4.50).
Conclusion
Intrinsic subtypes are highly prognostic in EORTC 26951 and improve outcome prediction when combined with other prognostic factors. Tumors assigned to IGS-9 benefit from adjuvant PCV.
INTRODUCTION
Unsupervised analysis of gene expression profiling identifies subgroups of tumors that are molecularly similar. This approach has been used to identify distinct intrinsic subtypes of cancer and provides an objective method to classify tumors.1–4 In gliomas, the identified intrinsic subtypes reportedly correlate better with patient prognosis than histology.5–9 Intrinsic glioma subtypes (IGSs) are not only similar on the RNA level, but specific genetic changes also segregate in distinct intrinsic subtypes.8,10 Therefore, it is likely that each molecular subtype will require its own treatment paradigm.
True validation of the prognostic relevance of the IGSs requires analysis on homogeneously and prospectively treated patients, ideally within a randomized clinical trial. One of the main problems in analyzing clinical trial samples is that they are often of poor quality; most are formalin-fixed, paraffin-embedded (FFPE) samples.11 However, recent technologic advances have enabled high-throughput analysis of FFPE material, including expression arrays.12–14 In a large cohort of paired fresh frozen (FF) -FFPE samples, we recently demonstrated that differences in mRNA expression are retained in FFPE samples. Importantly, the assignment to one of six IGSs was identical between the FF-FFPE matched samples in 87% of cases,15 and the intrinsic subtypes remain highly prognostic for survival. These results demonstrate that FFPE material can be used for expression profiling.
Not all patients with glioma respond similarly to treatment. For example, glioblastomas with a methylated O6-methylguanine-methyltransferase (MGMT) promoter respond better to treatment with temozolomide.16,17 In oligodendrogliomas, uncontrolled trials indicated that loss of heterozygosity (LOH) on 1p/19q is predictive for response to procarbazine, lomustine, and vincristine (PCV) chemotherapy.18,19 Selection of patients who benefit most from particular therapeutic regimens helps to improve treatment efficacy and to potentially avoid toxicity in patients who are unlikely to benefit from that therapy anyway.
European Organisation for Research and Treatment of Cancer (EORTC) 26951 is a randomized phase III clinical trial investigating whether the addition of PCV chemotherapy to radiotherapy (RT) would improve overall survival (OS) and progression-free survival (PFS) in patients with anaplastic oligodendroglioma (AOD) or anaplastic mixed oligoastrocytoma (AOA). This trial showed that the addition of six cycles of PCV after 59.4 Gy of RT increases OS and PFS in these tumors.20 However, some patients seemed to benefit more from the addition of PCV treatment than others.21 Here, we have evaluated the clinical relevance of intrinsic subtypes within EORTC 26951. Our study is the first to use gene expression profiling on FFPE clinical trial samples. Our data validate that intrinsic subtypes of glioma are prognostic for survival. Intrinsic subtypes improve outcome prediction when combined with other known prognostic parameters (1p/19q LOH and IDH1 mutation), although this increase is not significant. Our data also indicate that patients with tumors assigned to a specific intrinsic subtype benefit from PCV treatment.
PATIENTS AND METHODS
Patient Samples
Patients were considered eligible for EORTC 26951 if they had been diagnosed by the local pathologist with an AOD or an AOA according to the 1993 WHO classification. Details of the eligibility criteria and the CONSORT flow diagram have been described previously21 and are shown in Figure 1. A central pathology review was conducted on 345 of 368 samples and on 136 of 140 samples used in the present study. Four samples were omitted in the multivariate analysis that included review diagnosis as a factor. All analysis using histologic diagnosis made use of the review diagnosis. Patient and sample characteristics are detailed in the Data Supplement. Analysis of 1p/19q LOH, EGFR amplification, IDH1 mutations, and MGMT promoter methylation on EORTC 26951 samples has been described previously.21–23
Fig 1.

CONSORT diagram. PCV, procarbazine, lomustine, and vincristine; PD, progressive disease; RT, radiotherapy.
RNA Isolation and Array Hybridization
Total RNA extraction, purification, and quantification from FF and FFPE material were reported previously.8,15 RNA (150 ng) from FF and FFPE tissues was used for expression profiling. FF samples (n = 47) were profiled as described on HU133plus 2.0 arrays (Affymetrix, High Wycombe, United Kingdom)8; FFPE samples (n = 93) were profiled using HuEx_1.0_st arrays (Affymetrix) in combination with Nugen Ovation kits (Nugen, San Carlos, CA), as reported.13,15
Statistical Analysis
Samples were assigned to one of the six intrinsic molecular subtypes of glioma using ClusterRepro (an R package; http://crantastic.org/packages/clusterRepro) as described previously, omitting control cluster 0.8,24 Previously, these intrinsic subtypes were designated cluster followed by the cluster number (0, 9, 16, 17, 18, 22, or 23). Here, we annotate these clusters as IGSs followed by the same cluster number (eg, IGS-9). Other groups have also described molecular classification methods7,9,10; the overlap with The Cancer Genome Atlas classification is detailed in the Data Supplement (for other comparisons, see Gravendeel et al8). Samples assigned to IGS-9 and IGS-17 generally are assigned to the proneural subtype, IGS-18 to the classical subtype, and IGS-23 to the mesenchymal subtype. Neural subtypes are assigned to either IGS-17 or IGS-23.
Differences between the Kaplan-Meier survival curves were calculated using the log-rank (Mantel-Cox) test using GraphPad Prism version 5.00 for Windows (GraphPad Software, San Diego, CA). Comparisons between frequencies were calculated using the Fisher's exact test. In this exploratory analysis, P < .05 was considered to indicate significant differences. The importance of groups of prognostic factors was compared using the percentage of explained variation (PEV) developed by Heinze and Schemper25 for Cox regression using SAS macros (SAS Institute, Cary, NC). A PEV of at least 20% is considered a minimum requirement for a model to provide sufficiently precise individual PFS or OS predictions.26,27 PFS and OS were computed from random assignment to date of event (progression and/or death) or censored at the date of last visit.
RESULTS
Patients and Samples
Out of 368 patients within the EORTC 26951 trial, a total of 140 samples of were available for the current study; for the other patients, the amount of material was insufficient. Of the samples, 47 were FF and 93 were FFPE. Seventy-three patients had been assigned to the RT plus PCV chemotherapy arm, and 67 patients had been assigned to the RT only arm. Our cohort of samples from the EORTC 26951 study did not differ from the entire EORTC 26951 cohort (368 patients) with respect to age, sex, performance status, diagnosis, tumor location, IDH1 mutation, 1p/19q LOH, EGFR amplification, MGMT promoter methylation, OS, and PFS (Table 1). However, OS within the RT only treatment arm of included patients was worse compared with OS in patients not included (OS: 1.6 v 3.7 years, respectively; P = .009; hazard ratio [HR], 1.59; 95% CI, 1.12 to 2.25; PFS: 0.8 v 1.4 years, respectively; P = .012; HR, 1.55; 95% CI, 1.10 to 2.17), even when corrected for known clinical (age, extent of resection, sex, and performance status) and molecular (1p/19q LOH) characteristics and histologic review diagnosis. There were no such differences in the RT-PCV arm. This effect is likely a result of difference in patient selection in the hospitals but not related to tissue sampling. Of note, at the time of random assignment, patients were stratified per center. Of the included samples, there were no differences in clinical, molecular, or histologic characteristics between the two treatment arms (Data Supplement). A detailed analysis of patients included versus not included is shown in the Data Supplement.
Table 1.
Comparison of Baseline Demographics and Clinical Characteristics
| Demographic or Clinical Characteristic | Patients Included in the Cluster Analysis |
Total Patients (N = 368) |
P | ||||
|---|---|---|---|---|---|---|---|
| No (n = 228) |
Yes (n = 140) |
||||||
| No. | % | No. | % | No. | % | ||
| Age, years | .57 | ||||||
| Median | 49.5 | 49.4 | 49.5 | ||||
| Range | 19.4-68.7 | 18.6-68.7 | 18.6-68.7 | ||||
| Sex | .08 | ||||||
| Male | 123 | 53.9 | 89 | 63.6 | 212 | 57.6 | |
| Female | 105 | 46.1 | 51 | 36.4 | 156 | 42.4 | |
| Performance status | .75 | ||||||
| 0 | 81 | 35.5 | 53 | 37.9 | 134 | 36.4 | |
| 1 | 107 | 46.9 | 64 | 45.7 | 171 | 46.5 | |
| 2 | 36 | 15.8 | 22 | 15.7 | 58 | 15.8 | |
| Histologic diagnosis | .04 | ||||||
| AOD | 173 | 75.9 | 93 | 66.4 | 266 | 72.3 | |
| AOA > 25% O | 53 | 23.2 | 47 | 33.6 | 100 | 27.2 | |
| Central diagnosis | .02 | ||||||
| AOD | 100 | 43.9 | 76 | 54.3 | 176 | 47.8 | |
| AOA | 46 | 20.2 | 36 | 25.7 | 82 | 22.3 | |
| LGG | 28 | 12.3 | 11 | 7.9 | 39 | 10.6 | |
| HGG | 26 | 11.4 | 13 | 9.3 | 39 | 10.6 | |
| Other | 10 | 4.4 | 0 | 0.0 | 10 | 2.7 | |
| Missing | 18 | 7.9 | 4 | 2.9 | 22 | 6.0 | |
| Tumor location | .83 | ||||||
| Elsewhere | 119 | 52.2 | 71 | 50.7 | 190 | 51.6 | |
| Frontal | 109 | 47.8 | 69 | 49.3 | 178 | 48.4 | |
| IDH1 mutation | .37 | ||||||
| Normal | 41 | 18.0 | 58 | 41.4 | 99 | 26.9 | |
| Mutated | 39 | 17.1 | 44 | 31.4 | 83 | 22.6 | |
| 1p/19q LOH | .51 | ||||||
| Not codeleted | 141 | 61.8 | 95 | 67.9 | 236 | 64.1 | |
| Codeleted | 44 | 19.3 | 36 | 25.7 | 80 | 21.7 | |
| EGFR mutation | .76 | ||||||
| Normal | 111 | 48.7 | 82 | 58.6 | 193 | 52.4 | |
| Amplified | 32 | 14.0 | 26 | 18.6 | 58 | 15.8 | |
| MGMT promoter methylation | .61 | ||||||
| Unmethylated | 14 | 6.1 | 17 | 12.1 | 31 | 8.4 | |
| Methylated | 57 | 25.0 | 64 | 45.7 | 121 | 32.9 | |
| PFS | .21 | ||||||
| Observation events, No. | 181 | 117 | |||||
| HR | 1.00 | 1.16 | |||||
| 95% CI | 0.92 to 1.46 | ||||||
| Median, months | 19.65 | 14.52 | |||||
| 95% CI | 15.38 to 33.35 | 9.63 to 21.13 | |||||
| PFS at 2 years (%) | 48.02 | 39.29 | |||||
| 95% CI | 41.39 to 54.34 | 31.20 to 47.26 | |||||
| OS | .06 | ||||||
| Observation events, No. | 168 | 113 | |||||
| HR | 1.00 | 1.25 | |||||
| 95% CI | 0.99 to 1.59 | ||||||
| Median, months | 43.89 | 26.87 | |||||
| 95% CI | 30.03 to 61.17 | 18.69 to 38.31 | |||||
| OS at 2 years (%) | 63.44 | 51.43 | |||||
| 95% CI | 56.81 to 69.33 | 42.87 to 59.33 | |||||
NOTE. P < .01 is considered statistically significant. Missing values are not included in the table and are the remaining percentages
Abbreviations: AOA, anaplastic oligoastrocytoma; AOD, anaplastic oligodendroglioma; HGG, high-grade glioma (glioblastomas and anaplastic astrocytoma); HR, hazard ratio; LGG, low-grade glioma; LOH, loss of heterozygosity; O, oligo component; OS, overall survival; PFS, progression-free survival.
Intrinsic Subtypes Are Prognostic for OS and PFS
Expression profiling was performed on a total of 140 samples of patients treated within EORTC 26951. All expression profiles were then assigned to one of six predefined intrinsic subtypes. These molecularly similar intrinsic subtypes were identified previously and are based on unsupervised gene expression analysis.8 All six IGSs were identified, which shows that patients with different molecular subtypes were enrolled within this trial under the same histopathologic diagnosis. After assignment, IGS-9, IGS-16, IGS-17, IGS-18, IGS-22, and IGS-23 contained 50, two, 26, 27, eight, and 27 patients, respectively. The histologic composition (both original and review diagnosis) of subtypes is depicted in the Data Supplement. The intrinsic subtypes were highly prognostic for both OS and PFS. The median OS times for IGS-9, IGS-17, IGS-18, and IGS-23 were 8.5, 2.8, 1.2, and 1.0 years, respectively; and the median PFS times were 5.7, 1.8, 0.5, and 0.5 years, respectively (Fig 2). IGS-16 and IGS-22 contained too few samples to draw conclusions. Details for IGS-22 are listed in the Data Supplement. The subtype-specific differences in survival were highly similar to previously reported differences using FF archival samples and confirm the prognostic power of intrinsic subtyping.8 Even within the 1p/19q codeleted patient cohort, IGS subtyping remained prognostic. Conversely, 1p/19q status was also prognostic within patients assigned to IGS-9 (Data Supplement).
Fig 2.
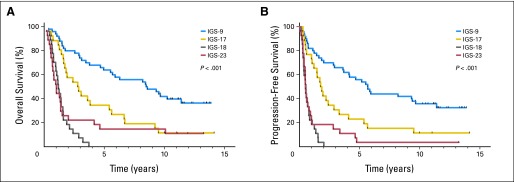
Kaplan-Meier survival curves of (A) overall survival (OS) and (B) progression-free survival (PFS) of the four major intrinsic glioma subtypes (IGSs) to which the patients from the European Organisation for Research and Treatment of Cancer (EORTC) 26951 trial were assigned. Survival is depicted as time (years) since random assignment. The four IGSs were highly prognostic for both OS and PFS because patient prognosis was different for each IGS. Only two and eight samples were assigned to IGS-16 and IGS-22, respectively (not shown).
In multivariate analysis, intrinsic subtype was a significant prognostic factor that was independent from clinical (age, sex, performance status, and type of surgery), molecular (1p/19q LOH), and histologic (local diagnosis or review diagnosis) parameters (Table 2). Tissue type (FF or FFPE) was not a prognostic variable in univariate or multivariate analysis. When IDH1 mutation status was included in this analysis, intrinsic subtyping remained an independent prognostic factor for PFS (P = .003) but not OS (P = .052). When MGMT promoter methylation was included, intrinsic subtyping remained an independent prognostic factor for both PFS (P < .001) and OS (P = .008), although the number of patients analyzed became relatively small (n = 80). Of note, even in the confirmed AOD tumors at central pathology review, each histologic subtype was found to contain several intrinsic subtypes. Within the group of central pathology review–confirmed AOD and AOA tumors or within the group of tumors with 1p/19q LOH, intrinsic subtype remains an independent prognostic factor.
Table 2.
Analysis of Overall Survival by Intrinsic Subtype and Other Variables
| Variable | P | HR | 95% CI for HR |
|---|---|---|---|
| Intrinsic subtype | .001 | 1.06 | 1.03 to 1.12 |
| Age | .002 | 1.03 | 1.01 to 1.05 |
| Sex | .530 | 0.87 | 0.57 to 1.34 |
| Type of surgery | .016 | 0.67 | 0.49 to 0.93 |
| Performance status | .011 | 1.46 | 1.09 to 1.94 |
| 1p/19q LOH | .000 | 0.32 | 0.17 to 0.59 |
| Review diagnosis | .086 | 0.82 | 0.66 to 1.03 |
NOTE. Calculations are based on 126 observations. Type of surgery categories included biopsy, partial resection, and total resection. Performance status is based on WHO–Eastern Cooperative Oncology Group scoring (0, 1, or 2).20 All categories were used as variable in the analysis.
Abbreviations: HR, hazard ratio (compared to radiotherapy only arm); LOH, loss of heterozygosity.
Distribution of 1p/19q LOH (P < .001), MGMT (P = .007), IDH1 (P < .001), and EGFR (P < .001) was significantly different between clusters. 1p/19q LOH was significantly more frequently present in tumors assigned to IGS-9 (29 of 46 samples, 63%) compared with IGS-17 (six of 25 samples, 24%), IGS-18 (zero of 26 samples, 0%), and IGS-23 (zero of 25 samples, 0%; Fig 3). EGFR amplification was predominantly observed in IGS-18 (14 of 24 samples, 58%) and, to a lesser extent, in IGS-23 (eight of 21 samples, 38%). EGFR amplification was rarely observed in samples assigned to IGS-9 (three of 39 samples, 7.6%) and IGS-17 (zero of 19 samples, 0%). IGS-9 and IGS-17 were more often associated with MGMT methylation and/or IDH1 mutation compared with IGS-18 and IGS-23 (Fig 3 and Data Supplement). As previously reported, CpG island methylation phenotype–positive tumors segregated in IGS-9 and IGS-17, whereas CpG island methylation phenotype–negative tumors segregated in IGS-18 and IGS-23.17
Fig 3.

Genetic differences between intrinsic glioma subtypes (IGSs). Specific genetic changes segregate into distinct IGSs. 1p/19q loss of heterozygosity (LOH) was predominantly observed in tumors assigned to IGS-9 and, to a lesser extent, tumors assigned to IGS-17 but was not seen in tumors assigned to IGS-18 and IGS-23. IDH1 mutations (mut) were significantly more observed in samples assigned to IGS-9 and IGS-17 compared with IGS-18 and IGS-23. EGFR amplification (amp) was predominantly identified in IGS-18 and IGS-23 but rarely identified in samples assigned to IGS-9 and IGS-17. This segregation was highly similar to that reported by us previously using archival samples and demonstrates that each IGS has a different set of causal genetic changes.8
Molecular parameters28 (IDH1 and 1p/19q LOH) and intrinsic subtypes are both important prognostic factors. To assess the added predictive value for PFS of intrinsic subtyping, we combined molecular (IDH1 and 1p/19q LOH) data with intrinsic subtypes and assessed the PEV by the two models. Both molecular parameters and intrinsic subtypes had comparable PEV (Data Supplement). This does not mean that both models explain the same variability. However, the combined model has a larger PEV of 30% compared with 23% for each individual group of factors, although this difference is not statistically significant.
Prediction of Benefit From Adjuvant PCV
We then evaluated whether the benefit from adjuvant PCV chemotherapy was specific to selected intrinsic subtypes. The addition of adjuvant PCV improved OS in samples assigned to IGS-9 (12.8 years in the RT-PCV arm v 5.5 years in the RT only arm; P = .035; HR, 2.18; 95% CI, 1.06 to 4.50); an improvement was also observed for PFS (12.8 years in the RT-PCV arm v 3.6 years in the RT only arm; P = .0018; HR, 3.18; 95% CI, 1.54 to 6.59). Data are shown in Figure 4 and Table 3. PCV treatment also improved PFS, but not OS, in samples assigned to IGS-18 (0.8 years in the RT-PCV arm v 0.4 years in the RT only arm; P = .028; HR, 2.51; 95% CI, 1.10 to 5.69). A trend toward an increase in both OS and PFS was observed between the two treatment arms in samples assigned to IGS-17 (OS: 5.4 v 1.8 years in RT-PCV and RT only arms, respectively; P = .096; HR, 2.21; 95% CI, 0.87 to 5.60; PFS: 2.2 v 1.0 years in RT-PCV and RT only arms, respectively; P = .109; HR, 2.12; 95% CI, 0.85 to 5.30). No difference in PFS or OS was observed between the treatment arms in samples assigned to IGS-23. Interaction tests for the effects of treatment across intrinsic subtypes were not significant for both PFS and OS (Data Supplement).
Fig 4.

Kaplan-Meier survival curves of the four intrinsic glioma subtypes (IGSs) per treatment arm. (A and B) Adjuvant procarbazine, lomustine, and vincristine (PCV) chemotherapy improved overall survival (OS) and progression-free survival (PFS) in samples assigned to IGS-9. (C and D) A trend toward an increase in both OS and PFS is seen between the two treatment arms in samples assigned to IGS-17. (E and F) Adjuvant PCV also improved PFS, but not OS, in samples assigned to IGS-18. (G and H) No difference between the two treatment arms was observed for both OS and PFS in samples assigned to IGS-23. Patients with one specific IGS (IGS-9) seem to benefit from adjuvant PCV chemotherapy, whereas patients with tumors assigned to IGS-23 do not. In this figure, survival is depicted as time (years) since random assignment. RT, radiotherapy.
Table 3.
Overall Survival and Progression-Free Survival by Treatment Arm
| IGS | Overall Survival |
Progression-Free Survival |
||||||||
|---|---|---|---|---|---|---|---|---|---|---|
| Median (years) |
Hazard Ratio | 95% CI | P | Median (years) |
Hazard Ratio | 95% CI | P | |||
| RT | RT/PCV | RT | RT/PCV | |||||||
| IGS-9 | 5.5 | 12.8 | 2.18 | 1.06 to 4.50 | .0349 | 3.6 | 12.8 | 3.18 | 1.54 to 6.59 | .0018 |
| IGS-17 | 1.8 | 5.4 | 2.21 | 0.87 to 5.60 | .0962 | 1.0 | 2.2 | 2.12 | 0.85 to 5.30 | .1086 |
| IGS-18 | 1.1 | 1.4 | 1.43 | 0.66 to 3.12 | .3669 | 0.4 | 0.8 | 2.51 | 1.10 to 5.69 | .0280 |
| IGS-23 | 1.1 | 1.0 | 0.89 | 0.39 to 2.02 | .7771 | 0.6 | 0.5 | 0.98 | 0.44 to 2.18 | .9678 |
Abbreviations: IGS, intrinsic glioma subtype; PCV, procarbazine, lomustine, and vincristine; RT, radiotherapy.
DISCUSSION
In this study, we performed intrinsic subtyping within a prospective clinical trial, EORTC 26951. Our data demonstrate that all six IGSs are present in EORTC 26951, despite the fact that only AODs and AOAs (as diagnosed by the local pathologist) were included in this study. After central pathology review, each histologic diagnosis still contained various intrinsic subtypes. Similar to reports in archival samples, the intrinsic subtypes are an independent prognostic factor both for OS and PFS. Combining known molecular (1p/19q LOH and IDH1) prognostic parameters with intrinsic subtypes improves outcome prediction, although this difference is not significant (PEV of 30% v 23% for individual groups of factors).
Histologic classification of gliomas is troublesome and subject to interobserver variation.29 In this study, we confirm that expression profiling, compared with the diagnoses made by the local pathologists, is a more accurate and objective method to classify gliomas.6–10,30–34 Also similar to reports on archival samples, specific genetic changes (IDH1, 1p/19q LOH, and EGFR amplification) segregate into different subtypes. Therefore, intrinsic subtypes are not only similar in their RNA expression profile, but are also similar on the DNA level in their genetic aberrations. Our data validate the prognostic significance of intrinsic subtypes, and therefore intrinsic subtyping can be used to determine the molecular heterogeneity of samples included in clinical trials.
As said, clinical trial samples are often of poor quality because most are FFPE samples.11 However, recent technologic advances have indicated that expression profiling is feasible on FFPE material.12,13,15
One of the limitations of the current study is that we were unable to determine the intrinsic subtype of all samples from EORTC 26951. Although most characteristics of samples included versus those not included are similar, this argues for a validation of our results in an independent cohort.
1p/19q and IDH are powerful low-cost tools for molecular classification. However, these single molecular markers provide limited information and may miss, for example, tumors with only partial 1p/19q deletions.35 In addition, approximately 30% of tumors with 1p/19q LOH do not have an IDH1 mutation. Because of these limitations, we believe that single molecular marker analysis will be replaced by high-throughput assays. Here, we demonstrate that IGS classification improves outcome prediction and thus provides additional value for patients.
Long-term follow-up of this trial shows that adjuvant PCV improves OS in AOA and AOD. Here, we further demonstrate that not all patients benefit equally from this treatment. Samples assigned to IGS-9 (characterized by a high percentage of 1p/19q LOH and IDH1 mutations) significantly benefit from PCV chemotherapy, whereas samples assigned to IGS-23 do not show any improvement in outcome (neither PFS nor OS). This outcome for IGS-9 samples is remarkable because there was a large degree of crossover in the RT only arm at time of progression.21
Tumors with 1p/19q LOH have been reported to show durable responses to chemotherapy.18,19,36 Independently, both the EORTC 26951 trial and its North American counterpart Radiation Therapy Oncology Group (RTOG) 9402 have shown that the addition of PCV to RT improved OS in 1p/19q codeleted oligodendrogliomas.37,38 Our data validate these observations because IGS-9 contains gliomas with the highest percentage 1p/19q LOH. Moreover, the median survival time between the RT-PCV and RT only arm is highly comparable to the median survival observed in RTOG 9402 (14.7 years in the RT-PCV arm v 7.3 years in the RT only arm in the RTOG 9402 trial and 12.8 years in the RT-PCV arm v 5.5 years in the RT only arm for IGS-9 samples in the EORTC 26951 trial). It should be noted that not all tumors assigned to IGS-9 had 1p/19q LOH (19 of 46 tumors), and conversely, not all tumors with 1p/19q LOH were assigned to IGS-9 (29 of 36 tumors). Similarly, 18 of 55 tumors assigned to IGS-9 or IGS-17 did not have an IDH1 mutation, and seven of 44 tumors with an IDH1 mutation were not assigned to IGS-9 or IGS-17. Although we show that combining known molecular (1p/19q LOH and IDH1) prognostic parameters with intrinsic subtypes improves outcome prediction, which of these techniques can best predict response to PCV chemotherapy remains to be determined; numbers in the current study are too low for a formal comparison.
Identifying patients who do not benefit from PCV chemotherapy is of equal clinical relevance. In our study, samples assigned to IGS-18 or IGS-23 showed no benefit from PCV chemotherapy in OS (although an increase in PFS was observed for IGS-18). In RTOG 9402, OS was not improved by PCV chemotherapy in AODs and AOAs that retained either 1p and/or 19q. Combined, these data indicate that patients harboring an AOD or AOA that have retained 1p and/or 19q, assigned to IGS-18 or IGS-23, do not show a benefit in OS from PCV chemotherapy.
Samples assigned to IGS-17 showed a trend toward improved outcome from PCV chemotherapy, both in PFS and OS. IGS-17 contains predominantly tumors that have retained 1p/19q but have IDH1 mutations. A similar trend toward improved outcome was observed in the entire EORTC 26951 cohort tumors with retained 1p/19q and mutated IDH1. Nevertheless, our sample cohort is relatively modest in size (N = 140), and our analysis is post hoc (retrospective testing), which is hypothesis generating. Therefore, our data should be validated in an additional independent cohort to firmly establish the predictive effect of these intrinsic molecular subtypes.
Interestingly, in a separate clinical trial (EORTC 22981/26981) on glioblastoma, patients with tumors assigned to IGS-18 also did not show a marked response to the addition of temozolomide to RT.8,39 In this study, too few samples were assigned to other subtypes to draw firm conclusions. It should be noted that there are some important differences between EORTC 26951 and EORTC 22981/26981. For example, EORTC 22981/26981 examined the efficacy of temozolomide chemotherapy in combination with RT as opposed to PCV. However, PCV and temozolomide are both alkylating agents with similar mechanism of action. Another important difference is the histologic subtype investigated; only glioblastomas were included in EORTC 22981/26981, whereas EORTC 26951 included AODs and AOAs. However, intrinsic subtypes have similar molecular and clinical characteristics and are independent of histologic diagnosis. Therefore, we hypothesize that samples assigned to a defined intrinsic subtype will show similar responses to similar chemotherapy regimens regardless of histologic diagnosis.
In summary, we demonstrate, on clinical trial samples and using FFPE material, that intrinsic molecular subtypes are highly prognostic for OS and PFS. Our data indicate that at least one intrinsic subtype of glioma responds favorably to PCV chemotherapy. Intrinsic subtypes are easily determined, and therefore, this approach provides a novel, straightforward, and promising way to improve outcome prediction when combined with other prognostic factors.
Supplementary Material
Glossary Terms
- 1p/19q:
A genetic alteration that consist in the loss of the heterozygosity of chromosomes 1p and 19q, that has been shown to be a powerful predictor of survival and chemosensitivity in oligodendroglial tumors.
- Expression profiling:
The expression of a set of genes in a biologic sample (eg, blood, tissue) using microarray technology.
- Formalin-fixed, paraffin-embedded:
Formalin-fixed, paraffin-embedded (FFPE) tissue is the standard for tissue preparation in anatomic pathology. The processing of tissue historically has included cutting into thin (5-mm) sections, then placing a cassette for fixation in formalin in a tissue processor, followed by infusion of paraffin and embedding on the block for subsequent sectioning for histologic evaluation or immunohistochemistry.
- Gene expression profiling:
Identifying the expression of a set of genes in a biologic sample (eg, blood, tissue) using microarray technology.
- HuEx_1.0_st arrays (Affymetrix):
Microarrays that measure expression of individual exons.
- IDH1 (gene encoding isocitrate dehydrogenase 1):
IDH1 converts isocitrate to α-ketoglutarate in the cytoplasm. IDH1 mutations in cancer result in a novel enzymatic activity whereby α-ketoglutarate is converted to D-2 hydroxyglutarate (R-2 hydroxyglutarate).
- Intrinsic subtype:
A subset of tumors that share similarities in their gene expression profile. Subtypes are identified by unsupervised analysis of gene expression.
- Predictive:
Markers, biologic or molecular, that determine which treatment will increase the efficacy and improve outcome.
- Prognostic factor:
A measurable patient characteristic that is associated with the subsequent course of disease (whether or not therapy is administered). The identification of a prognostic factor does not necessarily imply a cause-and-effect relationship. However, within a suitable outcome model, the measurement of a prognostic factor contributes to an estimate of an outcome probability (eg, the probability of disease-free survival within a given time interval).
- Prognostic (prognostic marker):
A marker that predicts the prognosis of a patient (eg, the likelihood of relapse, progression, and/or death) independent of future treatment effects. A factor can be both prognostic and predictive.
Footnotes
See accompanying editorial on page 297
Supported by the Dutch Foundation for Scientific Research ZonMw (Grants No. 95110051 and 92003560), Programme Translational Research, and Grants No. 5U10 CA11488-26 (1996) through 2U10 CA011488-41 (2011) from the National Cancer Institute (Bethesda, MD). This study was also supported by a donation from the Kankerbestrijding/KWF from the Netherlands through the European Organisation for Research and Treatment of Cancer Charitable Trust.
Terms in blue are defined in the glossary, found at the end of this article and online at www.jco.org.
The contents of this article are solely the responsibility of the authors and do not necessarily represent the official views of the National Cancer Institute.
Authors' disclosures of potential conflicts of interest and author contributions are found at the end of this article.
Clinical trial information: NCT00002840.
AUTHORS' DISCLOSURES OF POTENTIAL CONFLICTS OF INTEREST
Although all authors completed the disclosure declaration, the following author(s) indicated a financial or other interest that is relevant to the subject matter under consideration in this article. Certain relationships marked with a “U” are those for which no compensation was received; those relationships marked with a “C” were compensated. For a detailed description of the disclosure categories, or for more information about ASCO's conflict of interest policy, please refer to the Author Disclosure Declaration and the Disclosures of Potential Conflicts of Interest section in Information for Contributors.
Employment or Leadership Position: None Consultant or Advisory Role: Martin J. van den Bent, MSD (C) Stock Ownership: None Honoraria: Martin J. van den Bent, MSD Research Funding: None Expert Testimony: None Other Remuneration: None
AUTHOR CONTRIBUTIONS
Conception and design: Lale Erdem-Eraslan, Martin J. van den Bent, Pim J. French
Provision of study materials or patients: Ahmed Idbaih, Wim G.M. Spliet, Wilfred F.A. den Dunnen, Johannes L. Teepen, Pieter Wesseling, Martin J. van den Bent
Collection and assembly of data: Lale Erdem-Eraslan, Lonneke A. Gravendeel, Paul H.C. Eilers, Wim G.M. Spliet, Wilfred F.A. den Dunnen, Johannes L. Teepen, Pieter Wesseling, Peter A.E. Sillevis Smitt, Johan M. Kros, Thierry Gorlia, Martin J. van den Bent, Pim J. French
Data analysis and interpretation: Lale Erdem-Eraslan, Johan de Rooi, Paul H.C. Eilers, Ahmed Idbaih, Pieter Wesseling, Peter A.E. Sillevis Smitt, Thierry Gorlia, Martin J. van den Bent, Pim J. French
Manuscript writing: All authors
Final approval of manuscript: All authors
REFERENCES
- 1.Valk PJ, Verhaak RG, Beijen MA, et al. Prognostically useful gene-expression profiles in acute myeloid leukemia. N Engl J Med. 2004;350:1617–1628. doi: 10.1056/NEJMoa040465. [DOI] [PubMed] [Google Scholar]
- 2.Sørlie T, Perou CM, Tibshirani R, et al. Gene expression patterns of breast carcinomas distinguish tumor subclasses with clinical implications. Proc Natl Acad Sci U S A. 2001;98:10869–10874. doi: 10.1073/pnas.191367098. [DOI] [PMC free article] [PubMed] [Google Scholar]
- 3.Northcott PA, Korshunov A, Witt H, et al. Medulloblastoma comprises four distinct molecular variants. J Clin Oncol. 2011;29:1408–1414. doi: 10.1200/JCO.2009.27.4324. [DOI] [PMC free article] [PubMed] [Google Scholar]
- 4.French PJ, Peeters J, Horsman S, et al. Identification of differentially regulated splice variants and novel exons in glial brain tumors using exon expression arrays. Cancer Res. 2007;67:5635–5642. doi: 10.1158/0008-5472.CAN-06-2869. [DOI] [PubMed] [Google Scholar]
- 5.French PJ, Swagemakers SM, Nagel JH, et al. Gene expression profiles associated with treatment response in oligodendrogliomas. Cancer Res. 2005;65:11335–11344. doi: 10.1158/0008-5472.CAN-05-1886. [DOI] [PubMed] [Google Scholar]
- 6.Nutt CL, Mani DR, Betensky RA, et al. Gene expression-based classification of malignant gliomas correlates better with survival than histological classification. Cancer Res. 2003;63:1602–1607. [PubMed] [Google Scholar]
- 7.Phillips HS, Kharbanda S, Chen R, et al. Molecular subclasses of high-grade glioma predict prognosis, delineate a pattern of disease progression, and resemble stages in neurogenesis. Cancer Cell. 2006;9:157–173. doi: 10.1016/j.ccr.2006.02.019. [DOI] [PubMed] [Google Scholar]
- 8.Gravendeel LA, Kouwenhoven MC, Gevaert O, et al. Intrinsic gene expression profiles of gliomas are a better predictor of survival than histology. Cancer Res. 2009;69:9065–9072. doi: 10.1158/0008-5472.CAN-09-2307. [DOI] [PubMed] [Google Scholar]
- 9.Li A, Walling J, Ahn S, et al. Unsupervised analysis of transcriptomic profiles reveals six glioma subtypes. Cancer Res. 2009;69:2091–2099. doi: 10.1158/0008-5472.CAN-08-2100. [DOI] [PMC free article] [PubMed] [Google Scholar]
- 10.Verhaak RG, Hoadley KA, Purdom E, et al. Integrated genomic analysis identifies clinically relevant subtypes of glioblastoma characterized by abnormalities in PDGFRA, IDH1, EGFR, and NF1. Cancer Cell. 2010;17:98–110. doi: 10.1016/j.ccr.2009.12.020. [DOI] [PMC free article] [PubMed] [Google Scholar]
- 11.Masuda N, Ohnishi T, Kawamoto S, et al. Analysis of chemical modification of RNA from formalin-fixed samples and optimization of molecular biology applications for such samples. Nucleic Acids Res. 1999;27:4436–4443. doi: 10.1093/nar/27.22.4436. [DOI] [PMC free article] [PubMed] [Google Scholar]
- 12.Hoshida Y, Villanueva A, Kobayashi M, et al. Gene expression in fixed tissues and outcome in hepatocellular carcinoma. N Engl J Med. 2008;359:1995–2004. doi: 10.1056/NEJMoa0804525. [DOI] [PMC free article] [PubMed] [Google Scholar]
- 13.Hall JS, Leong HS, Armenoult LS, et al. Exon-array profiling unlocks clinically and biologically relevant gene signatures from formalin-fixed paraffin-embedded tumour samples. Br J Cancer. 2011;104:971–981. doi: 10.1038/bjc.2011.66. [DOI] [PMC free article] [PubMed] [Google Scholar]
- 14.Linton KM, Hey Y, Saunders E, et al. Acquisition of biologically relevant gene expression data by Affymetrix microarray analysis of archival formalin-fixed paraffin-embedded tumours. Br J Cancer. 2008;98:1403–1414. doi: 10.1038/sj.bjc.6604316. [DOI] [PMC free article] [PubMed] [Google Scholar]
- 15.Gravendeel LA, de Rooi JJ, Eilers PH, et al. Gene expression profiles of gliomas in formalin-fixed paraffin-embedded material. Br J Cancer. 2012;106:538–545. doi: 10.1038/bjc.2011.547. [DOI] [PMC free article] [PubMed] [Google Scholar]
- 16.Hegi ME, Diserens AC, Gorlia T, et al. MGMT gene silencing and benefit from temozolomide in glioblastoma. N Engl J Med. 2005;352:997–1003. doi: 10.1056/NEJMoa043331. [DOI] [PubMed] [Google Scholar]
- 17.van den Bent MJ, Gravendeel LA, Gorlia T, et al. A hypermethylated phenotype is a better predictor of survival than MGMT methylation in anaplastic oligodendroglial brain tumors: A report from EORTC study 26951. Clin Cancer Res. 2011;17:7148–7155. doi: 10.1158/1078-0432.CCR-11-1274. [DOI] [PubMed] [Google Scholar]
- 18.Cairncross JG, Ueki K, Zlatescu MC, et al. Specific genetic predictors of chemotherapeutic response and survival in patients with anaplastic oligodendrogliomas. J Natl Cancer Inst. 1998;90:1473–1479. doi: 10.1093/jnci/90.19.1473. [DOI] [PubMed] [Google Scholar]
- 19.van den Bent MJ, Looijenga LH, Langenberg K, et al. Chromosomal anomalies in oligodendroglial tumors are correlated with clinical features. Cancer. 2003;97:1276–1284. doi: 10.1002/cncr.11187. [DOI] [PubMed] [Google Scholar]
- 20.van den Bent MJ, Brandes AA, Taphoorn MJ, et al. Adjuvant procarbazine, lomustine, and vincristine chemotherapy in newly diagnosed anaplastic oligodendroglioma: Long-term follow-up of EORTC Brain Tumor Group study 26951. J Clin Oncol. doi: 10.1200/JCO.2012.43.2229. [epub ahead of print on October 15, 2012] [DOI] [PubMed] [Google Scholar]
- 21.van den Bent MJ, Carpentier AF, Brandes AA, et al. Adjuvant procarbazine, lomstine, and vincristine improves progression-free survival but not overall survival in newly diagnosed anaplastic oligodendrogliomas and oligoastrocytomas: A randomized European Organisation for Research and Treatment of Cancer phase III trial. J Clin Oncol. 2006;24:2715–2722. doi: 10.1200/JCO.2005.04.6078. [DOI] [PubMed] [Google Scholar]
- 22.Kouwenhoven MC, Gorlia T, Kros JM, et al. Molecular analysis of anaplastic oligodendroglial tumors in a prospective randomized study: A report from EORTC study 26951. Neuro Oncol. 2009;11:737–746. doi: 10.1215/15228517-2009-011. [DOI] [PMC free article] [PubMed] [Google Scholar]
- 23.Idbaih A, Dalmasso C, Kouwenhoven M, et al. Genomic aberrations associated with outcome in anaplastic oligodendroglial tumors treated within the EORTC phase III trial 26951. J Neurooncol. 2011;103:221–230. doi: 10.1007/s11060-010-0380-9. [DOI] [PMC free article] [PubMed] [Google Scholar]
- 24.Kapp AV, Tibshirani R. Are clusters found in one dataset present in another dataset? Biostatistics. 2007;8:9–31. doi: 10.1093/biostatistics/kxj029. [DOI] [PubMed] [Google Scholar]
- 25.Heinze G, Schemper M. Comparing the importance of prognostic factors in Cox and logistic regression using SAS. Comput Methods Programs Biomed. 2003;71:155–163. doi: 10.1016/s0169-2607(02)00077-9. [DOI] [PubMed] [Google Scholar]
- 26.Schemper M, Henderson R. Predictive accuracy and explained variation in Cox regression. Biometrics. 2000;56:249–255. doi: 10.1111/j.0006-341x.2000.00249.x. [DOI] [PubMed] [Google Scholar]
- 27.Dunkler D, Michiels S, Schemper M. Gene expression profiling: Does it add predictive accuracy to clinical characteristics in cancer prognosis? Eur J Cancer. 2007;43:745–751. doi: 10.1016/j.ejca.2006.11.018. [DOI] [PubMed] [Google Scholar]
- 28.van den Bent MJ, Dubbink HJ, Marie Y, et al. IDH1 and IDH2 mutations are prognostic but not predictive for outcome in anaplastic oligodendroglial tumors: A report of the European Organization for Research and Treatment of Cancer Brain Tumor Group. Clin Cancer Res. 2010;16:1597–1604. doi: 10.1158/1078-0432.CCR-09-2902. [DOI] [PubMed] [Google Scholar]
- 29.Kros JM, Gorlia T, Kouwenhoven MC, et al. Panel review of anaplastic oligodendroglioma from European Organization For Research and Treatment of Cancer Trial 26951: Assessment of consensus in diagnosis, influence of 1p/19q loss, and correlations with outcome. J Neuropathol Exp Neurol. 2007;66:545–551. doi: 10.1097/01.jnen.0000263869.84188.72. [DOI] [PubMed] [Google Scholar]
- 30.Freije WA, Castro-Vargas FE, Fang Z, et al. Gene expression profiling of gliomas strongly predicts survival. Cancer Res. 2004;64:6503–6510. doi: 10.1158/0008-5472.CAN-04-0452. [DOI] [PubMed] [Google Scholar]
- 31.Louis DN, Ohgaki H, Wiestler OD, et al. The 2007 WHO classification of tumours of the central nervous system. Acta Neuropathol. 2007;114:97–109. doi: 10.1007/s00401-007-0243-4. [DOI] [PMC free article] [PubMed] [Google Scholar]
- 32.Madhavan S, Zenklusen JC, Kotliarov Y, et al. Rembrandt: Helping personalized medicine become a reality through integrative translational research. Mol Cancer Res. 2009;7:157–167. doi: 10.1158/1541-7786.MCR-08-0435. [DOI] [PMC free article] [PubMed] [Google Scholar]
- 33.Shirahata M, Iwao-Koizumi K, Saito S, et al. Gene expression-based molecular diagnostic system for malignant gliomas is superior to histological diagnosis. Clin Cancer Res. 2007;13:7341–7356. doi: 10.1158/1078-0432.CCR-06-2789. [DOI] [PubMed] [Google Scholar]
- 34.Shirahata M, Oba S, Iwao-Koizumi K, et al. Using gene expression profiling to identify a prognostic molecular spectrum in gliomas. Cancer Sci. 2009;100:165–172. doi: 10.1111/j.1349-7006.2008.01002.x. [DOI] [PMC free article] [PubMed] [Google Scholar]
- 35.Idbaih A, Kouwenhoven M, Jeuken J, et al. Chromosome 1p loss evaluation in anaplastic oligodendrogliomas. Neuropathology. 2008;28:440–443. doi: 10.1111/j.1440-1789.2008.00863.x. [DOI] [PubMed] [Google Scholar]
- 36.Kouwenhoven MC, Kros JM, French PJ, et al. 1p/19q loss within oligodendroglioma is predictive for response to first line temozolomide but not to salvage treatment. Eur J Cancer. 2006;42:2499–2503. doi: 10.1016/j.ejca.2006.05.021. [DOI] [PubMed] [Google Scholar]
- 37.Intergroup Radiation Therapy Oncology Group Trial 9402, Cairncross G, Berkey B, et al. Phase III trial of chemotherapy plus radiotherapy compared with radiotherapy alone for pure and mixed anaplastic oligodendroglioma: Intergroup Radiation Therapy Oncology Group Trial 9402. J Clin Oncol. 2006;24:2707–2714. doi: 10.1200/JCO.2005.04.3414. [DOI] [PubMed] [Google Scholar]
- 38.Cairncross G, Wang M, Shaw E, et al. Phase III trial of chemoradiotherapy for anaplastic oligodendroglioma: Long-term results of RTOG 9402. J Clin Oncol. doi: 10.1200/JCO.2012.43.2674. [epub ahead of print on Oct 15, 2012] [DOI] [PMC free article] [PubMed] [Google Scholar]
- 39.Murat A, Migliavacca E, Gorlia T, et al. Stem cell-related “self-renewal” signature and high epidermal growth factor receptor expression associated with resistance to concomitant chemoradiotherapy in glioblastoma. J Clin Oncol. 2008;26:3015–3024. doi: 10.1200/JCO.2007.15.7164. [DOI] [PubMed] [Google Scholar]
Associated Data
This section collects any data citations, data availability statements, or supplementary materials included in this article.