

Abstract
The receptor tyrosine kinase inhibitor, sunitinib, is astonishingly effective in its capacity to reduce MDSCs in peripheral tissues such as blood (human) and spleen (mouse), restoring responsiveness of bystander T lymphocytes to TcR stimulation. Sunitinib blocks proliferation of undifferentiated MDSCs and decreases survival of more differentiated neutrophilic MDSC (n-MDSC) progeny. Ironically, sunitinib’s profound effects are observed even in a total absence of detectable anti-tumor therapeutic response. This is best explained by the presence of disparate MDSC-conditioning stimuli within individual body compartments, allowing sensitivity and resistance to sunitinib to coexist within the same mouse or patient. The presence or absence of GM-CSF is likely the major determinant in each compartment, given that GM-CSF’s capacity to preempt STAT3-dependent with dominant STAT5-dependent hematopoietic programming confers sunitinib resistance and redirects differentiation from the n-MDSC lineage to the more versatile monocytoid (m-MDSC) lineage. The clinical sunitinib experience underscores that strategies for MDSC and Treg depletions must be mindful of disparities among body compartments to avoid sanctuary effects. Ironically, m-MDSCs manifesting resistance to sunitinib also have the greatest potential to differentiate into tumoricidal accessory cells, by virtue of their capacity to respond to T cell-secreted IFN-γ or to TLR agonists with nitric oxide and peroxynitrate production.
Keywords: myeloid-derived suppressor cells, MDSC, STAT5, STAT3, GM-CSF, G-CSF, sunitinib
INTRODUCTION: PHENOTYPIC AND FUNCTIONAL DIVERSITY OF MYELOID-DERIVED SUPPRESSOR CELLS (MSDCS)
The typical tumor-bearing host develops abnormally elevated proportions of myeloid-derived suppressor cells (MDSCs) and Foxp3pos regulatory T cells (Tregs). These non-transformed host elements typically do not interfere with immunocompetence against microbial pathogens, but do promote tolerance to organized tissues which contain them, including healing wounds (Mahdipour, et al., 2011), placenta (Fainaru et al., 2011), intestine stocked with commensual bacteria (Takaba et al., 2010), and tumors. Even though the phenotype and numbers of MDSCs and Tregs vary among mouse tumor models and human cancer types, it is clear that this type of real time immunosuppression is relevant to human cancer, and interventions to reduce the presence of MDSCs and Tregs are widely under study.
Myeloid derived suppressor cells (MDSCs) include a wide panoply of cell types which have in common a capacity to inhibit effector immune responses and an expression of myeloid rather than lymphoid markers. MDSCs were initially observed to be, or at least to include a heterogeneous group of immature myeloid cells consisting of macrocytic/monocytic, granulocytic/neutrophilic and DC precursors. In mouse models they were broadly defined as expressing CD11b+Gr1+ and could suppress both Ag-specific and nonspecific T cell activation.
It should be noted that normal mouse myeloid cells can also express CD11b+Gr1+, notably mature neutrophils, but such normal cells do not display suppressive T cell function. In contrast, MDSCs derived from tumor-bearing animals typically are already in a real-time immunosuppressive mode at least in regards to arginase production, and are variably inducible for production of reactive oxygen species (ros) and nitric oxide.
Recent delineations in mouse tumor models have shown that n-MDSCs are CD11b+Gr1hiLy6G+Ly6CloF4/80− with high side scatter, and suppress T cell function via arginase activity and reactive oxygen species (ROS). Classically activated by IL-4 stimulation but already typically activated in tumor-bearing animals, n-MDSCs do not make nitric oxide upon LPS stimulation, rendering their induction of T cell tolerance a fully reversible, non lethal event. In contrast, less differentiated and monocytic MDSCs (m-MDSc) are CD11b+Gr1loLy6G− Ly6ChiF4/80+, produce arginase but only modest amounts of ROS, and produce prodigious nitric oxide upon IFN-γ or Toll-like receptor agonist stimulation (Movahedi et al., 2008; Youn et al., 2008) (Figure 1). This potential to secrete nitric oxide renders these MDSCs potentially lethal to most host cells as well as to most tumor cells.
Figure 1.

Phenotypes of mouse MDSCs. Analysis of splenocytes from mice bearing 4T1 breast tumors evidence increased numbers of largish cells positive for CD11b (MAC1) and Gr1 (A). Gr1high MDSCs (green) are notable for Ly6G positivity (B) and the morphology of immature neutrophils (C). Gr1int MDSCs (blue) are notable for Ly6C positivity and partial F4/80 positivity (D) as well as monocyte/macrophage morphology, including pre-lineage forms.
It has become increasingly clear, however, that MDSCs include myeloid-lineage cells potentially at any stage of differentiation. Although the original characterization of MDSCs suggested that suppressor function was linked to an immature differentiation state (and frequently resolved by differentiating agents such as retinoids or CD40 ligating mAb) (Mirza et al., 2006; Pan et al., 2010), it is evident in tumor-bearing animals that mature neutrophils and mature macrophages with low MHC Class II expression can share many immunosuppressive features of immature MDSCs.
As in the mouse, MDSCs in the peripheral blood of cancer patients also include multiple phenotypes that reflect a continuum of differentiation states (Figure 2). Lineage negative CD33+HLADR− MDSCs with T cell inhibitory properties were originally observed in patients with various squamous cancers and adenocarcinomas (Almand et al., 2001).
Figure 2.

Phenotypes of human mDSCs. Analysis of peripheral blood mononuclear cells (Ficoll interface) from patient with renal cell carcinoma. Initial gating on myeloid (CD33) cells with absent to low HLA-DR expression (A) reveals three populations: neutrophilic-MDSCs (note, normal neutrophils concentrate in the RBC pellet rather than Ficoll interface) which are CD15posCD14neg (green boxes, B, C, E); monocytoid MDSCs which are CD15negCD14pos (blue boxes, B, C, F) and prelineage forms (B, C G). As in mouse spleen, n-MDSCs predominate in human peripheral blood of patients with RCC (C).
These cells lacked the granulocytic marker CD15, and likely corresponded to mouse MDSCs which are less differentiated (Ly6C+). Within this broad phenotype, a monocyte-like CD14+ subset has been prominently observed in patients with melanoma and hepatocellular carcinoma, and this subset suppresses T cell function via TGFβ and/or arginase production, as well as by induction of Tregs (Filipazzi et al., 2007; Hoechst et al., 2008). However, another distinct human MDSC subpopulation expresses the granulocytic marker CD15+, and prominently suppresses T cell function in patients with kidney cancer, among others, through an arginase and/or ROS-dependent mechanism (Rodriguez et al., 2009; Schmielau and Finn, 2001; Zea et al., 2005). These CD15+ MDSCs lack CD14 and express high levels of CD66b and CD11b and reduced levels of CD62L, hence correspond to those MDSCs that are granulocytic and Ly6Ghi in the mouse (Ko et al., 2009; Ko et al., 2010; Rodriguez et al., 2009).
Consistent with their n-MDSC identity, the suppressive actions of RCC patient peripheral blood MDSCs are fullly reversible by simply removing them from culture, and are partially reversed by the addition of excess L-arginine or catalase, consistent with roles for arginase and ROS (4). Furthermore, we have observed that even mature multinucleate neutrophils from healthy donors can be rapidly induced by tumor supernatants to discharge their granules and suppress T cells indistinguishably from circulating low density CD15+ n-MDSCs (not shown).
LETHAL VS REVERSIBLY TOLEROGENIC ARGININE METABOLISM
MDSCs inhibit T cells via multiple mechanisms which may vary by tumor type, tumor burden, and anatomical compartment. The suppressive mechanisms of MDSCs may largely be grouped into L-arginine dependent and independent ones. MDSCs metabolize L-arginine via two main pathways: arginase 1 (ARG1) and/or inducible nitric oxide synthase 2 (iNOS2). ARG1 activation occurs in response to Type 2/3 agents (IL-4, IL-13, IL-10, TGFβ and PGE2 among others), via STAT6 dependent and independent pathways (Bronte et al., 2003; Hesse et al., 2001; Ochoa et al., 2007; Rodriguez et al., 2003; Rodriguez et al., 2004; Rodriguez et al., 2005). ARG1 up-regulation leads to the depletion of microenvironmental L-arginine, and consequently compromises CD3ζ chain expression and TCR-mediated T cell activation, proliferation, and cytokine production (Rodriguez et al., 2003; Rodriguez et al., 2004; Rodriguez et al., 2007). Simply put, ARG1 promotes a tolerogenic state without killing of T cells. Zea et al. confirmed the clinical relevance of this mechanism when they observed that patients with renal cell carcinoma (RCC) had elevated ARG1 levels which correlated with elevated ornithine levels, decreased expression of CD3ζ, and decreased T cell function. Arginase activity was limited to a population of suppressive granulocytic myeloid cells which were CD11b+CD14−CD15+, and removal of these n-MDSCs promptly restored T cell function (Zea et al., 2005).
In contrast to ARG1-mediated suppression, arginine metabolism by up-regulated levels of iNOS2 in MDSCs occurs in response to Type 1/proinflamma-tory agents such as IFNγ, TNFα, or IL-1α, as well as TLR agonists. iNOS2 metabolizes arginine to produce superoxide and NO, which rapidly combine to form highly reactive peroxynitrites which disrupt downstream JAK/STAT proteins required for normal T cell function (Bingisser et al., 1998; Duhe et al., 1998; Marigo et al., 2008; Talmadge, 2007). In this regard, ARG1 and iNOS2 pathways can in theory operate in parallel and synergize to inhibit T cell function.
It will be apparent, however, that MDSCs have the capacity to produce either a gentle and reversible tolerant state for T cells through arginine depletion, or an explosive destruction of T cells through production of nitric oxide. Expression of IL4rα identifies a subset of MDSCs poised to produce ARG1 upon IL-4 stimulation (Bronte et al., 2003); most likely, such MDSCs serve to gently dampen mixed T1-/T2-type immune responses after they have effectively controlled the spread of intracellular pathogens. Although effective control of intracellular pathogens requires a T1-type response to eradicate already infected host cells, the consequent release of pathogen also mandates a Th2 response, namely IL-4-dependent production of neutralizing Ab to prevent pathogen uptake by additional somatic cells.
Activation of IL4rα+ MDSCs by Th2 cells at this juncture is appropriate especially to dampen the cellular (T1) component of immunity, since the T2 component will naturally be quenched when the neutralizing Ab fully removes the source of stimulatory Ag. Importantly, the T cells in the vicinity of ARG1-producing MDSCs can immediately redisplay normal function if the MDSCs are removed, underscoring the dynamic nature and real-time reversibility of such immunosuppression. However, in the tumor-bearing state, MDSCs accumulate inexorably, establishing a steady state of immunosuppression with no natural prospect for reversibility.
In contrast to ARG1-mediated MDSC immunosuppression, iNOS2-mediated MDSC immunosuppression is potentially a lethal event for T cells, tumor cells, and other cells. From in vitro study, it is likely that this constitutes a stepwise process in which T cells release IFN-γ upon MDSCs in response to local Ag presentation either by tumor, by professional Ag-presenting cells, or by the MDSCs themselves; this induces STAT1-dependent iNOS2 synthesis, potentially eliminating rather than tolerizing effector responses. However, it must be stressed that wholesale tissue destruction is the typical consequence of robust nitric oxide production, and while T cell destruction may be the focus of in vitro assays, every type of cell including tumor cells and MDSCs themselves can also be wiped out.
Stated differently, STAT1 activation of certain MDSCs may cause them to differentiate from suppressors into “angry” macrophages capable of killing everything in sight, including pathogens, T cells, tumor cells and ultimately themselves. At times such activity may constitute a remarkably effective, ‘take no prisoners” cell-mediated response which self-terminates with the destruction of all constituents. MDSCs in this state may be misconstrued as suppressor cells if only their impact on T cells is assayed (Sinha et al., 2005).
Tumor- and tumor-induced host factors are likely to play a critical role in the expansion and activation of MDSCs commonly observed during tumor progression, and importantly are likely to control the susceptibility of MDSCs to biologic factors and pharmaceutical agents. Some of these factors are fairly ubiquitous products of tumor stroma whereas others are associated with individual types of cancer. These include a number of growth factors (GM-CSF, SCF, Flt3L, G-CSF, VEGF, etc), cytokines (IL6, IL1β, IFNγ etc) and other products such as prostaglandins, gangliosides and select chemokines (Gabrilovich and Nagaraj, 2009; Marigo et al., 2008). It is likely that no single factor is either sufficient or essential to fully induce the MDSC phenotype and function.
MDSCs vs Tregs
Any effort to reduce Treg or MDSC function to narrow terms is likely to contradict evidence in the literature that cell-mediated immunosuppression has nearly infinite iterations, beginning with Gershon and Benacerraf’s long forgotten but probably still experimentally valid mappings of “suppressor T cell” pathways (Eardley and Gershon, 1976; Gershon et al., 1976; Hu et al., 1983; Schwartz and Gershon, 1984). The modern era of suppressor cell studies benefits from phenotypic handles such as Treg expression of CD25 and Foxp3 and granulocytic MDSCs’ expression of Gr1/CD15. These markers, especially Treg expression of Foxp3, have given investigators a better chance of reproducing one another’s results, culminating in reporter and conditional knock-out mice which can often provide definitive readouts regarding Foxp3’s function and essentiality. With such resources available, even the discovery that human effector T cells can transiently express Foxp3 did not set back the field (Kmieciak et al., 2009). Nonetheless, there are still many areas of uncertainty in both MDSC and Treg biology.
Relative impact of MDSCs vs Tregs
Whereas, at least in vitro, the target of Treg-mediated suppression is often limited to naïve T cells, and is reversible by providing exogenous IL-2 (Powell et al., 2005), MDSC-mediated suppression impacts both naïve and memory T cells, and is typically not reversible by adding exogenous rIL-2 (Watanabe et al., 2008). Rather, preventing or reversing MDSC-mediated suppression requires either eliminating the MDSCs or differentiating them into non-suppressor cells. Although this implies that MDSCs may play a broader regulatory role than Tregs, such conclusions are speculative because typical Treg assays are not designed to distinguish between natural and induced Tregs, nor between Ag-specific vs Ag-unrestricted Treg impacts. Similarly, typical MDSCs assays do not distinguish between, for example, ARG1-mediated tolerance induction vs iNOS2-mediated effector T cell deletion. Stated differently, the typical 3H-thymidine proliferation assay readout for MDSC-mediated T cell suppression does not distinguish whether low 3H-thymidine uptake signifies reduced T cell proliferation or T cell death.
Ag-specific vs nonspecific Tregs and MDSCs
As noted previously, it is established that many Treg effects are not Ag-restricted, but the expression of TcRs also provides the opportunity for Ag-restricted immunosuppression which is often readily demonstrable (Korn and Oukka, 2007; Nayak et al., 2009; Wang and Davies, 2007). The study of T cells uniformly transgenic for particular TcR has furthermore established that T cells can exist within a functional continuum in which Foxp3+, Ag-specific Tregs are modulated by STAT3 activation to become ror-γ+ T17-type T cells, and hence by STAT4 activation to become t-bet+ T1-type T cells (Muranski et al., 2008).
Because MDSCs lack TcRs, they have a lesser potential for Ag-restricted immunosuppression than Tregs, yet can target T cells of particular specificity by processing and presenting relevant Ag within surface MHC molecules (Lee et al., 2012; Nagaraj et al., 2012; Solito et al., 2011). Even though classic iNOS2-mediated MDSC immunosuppression has been demonstrated mainly within an MHC Class I-restricted context, it is recently apparent that MDSCs have the capability to process exogenous Ag in an MHC Class II-restricted context as well (Lee et al., 2012; Nagaraj et al., 2012; Solito et al., 2011). Hence, MDSC cross-talk with either CD8+ or CD4+ T cells can offer an Ag-restricted component to MDSC function even though the latter do not express TcRs.
Which induces which?
Review of the literature reveals dozens of reports in which MDSCs induce Tregs (Dolganiuc et al., 2008; Ghiringhelli et al., 2005; Huang et al., 2006; MacDonald et al., 2005; Pan et al., 2010; Serafini et al., 2008), but none in which Tregs induce MDSCs. To the contrary, it appears that Tregs may inhibit proliferation of MDSCs (Zhang et al., 2010), but it is also apparent that investigators’ choice of readout assay(s) itself decides which of the two outcomes can be observed. In other words, demonstrations that MDSCs induce Treg are not accompanied by demonstrations that the converse is not true. It therefore remains possible that each type of suppressor cell can induce the other, and that the relevance of such cross-induction to normal and pathological immunosuppression remains to be delineated.
RENAL CELL CARCINOMA (RCC), IMMUNOSUPPRESSION AND MDSCs
Human kidney cancer exemplifies the MDSC paradigm in humans; 36,000 Americans are diagnosed annually with kidney cancer, resulting in nearly 13,000 deaths (Jemal et al., 2007). 85% of kidney cancer patients have clear cell carcinomas, of which 33% have metastatic disease at diagnosis. Furthermore, 40% who undergo nephrectomy will ultimately develop recurrent disease (Linehan and Zbar, 2004). Poor outcome in RCC is related to its late disease presentation, propensity for recurrence, and refractoriness to traditional chemotherapy or radiotherapy.
Prior studies indicate that RCC is the second most immunogenic cancer type in humans, exceeded only by malignant melanoma. Tumor-specific T cell lines and clones have been expanded from the tumors of some patients (Finke et al., 1990; Schendel et al., 1993). Clonal expansion of TCRα/β T cells has also been reported, most notably in tumors that are regressing (Puisieux et al., 1996). Finally, tumor-reactive T cells are detected in RCC patients which recognize well-characterized, tumor-associated Ags such as RAGE-1, Mage-3/-6, EphA2, PRAME, Muc-1 and Her-2/neu (Brossart et al., 1998; Neumann et al., 1998; Steffens et al., 1999; Tatsumi et al., 2003). Despite this apparent immunogenicity, the vast majority of RCCs are refractory to currently available forms of immunotherapy. The currently most effective immunotherapy, high dose IL-2, results in durable objective responses in only a small minority of RCC patients (Smith et al., 2008; Klapper et al., 2008).
The historically limited effectiveness of immunotherapy in most RCC patients may be linked to the immune dysfunction readily observed in these patients. Indeed, a diminution in cell-mediated immunity has been well documented in RCC patients with either unresectable metastases, and even with resectable disease before it is resected (Finke et al., 1999; Troy et al., 1998; Uzzo et al., 1999) this diminution includes an emblematic shift from a type-1 mediated (IFNγ-producing) CD4+ T cell response to a type-2 cytokine response (IL-4, IL-5, IL-10) (Pardoll and Topalian 1998; Toes et al., 1999).
This is observed both in the MAGE6- and EphA2-specific T cell repertoire (Tatsumi et al., 2002, 2003) and also after polyclonal activation of peripheral blood lymphocytes from RCC patients (Finke et al. 2008; Onishi et al., 1999; Zea et al., 2005). Interestingly, patients rendered temporally disease-free by primary tumor excision and/or immunotherapy reverted to a predominance of IFNγ-producing type-1 CD4+ T cells, suggesting that the observed systemic T1→T2 biasing is reversibly related to tumor burden (Tatsumi et al., 2003).
In animal studies, myeloid-derived suppressor cells (MDSC) are pivotal agents of tumor-induced T2-type biasing and the escape from cell-mediated immunity (Ozao-Choy et al., 2009; Sinha et al., 2007). A systemic increase in MDSCs is observed prominently in many mouse tumor models, and is also a consistent observation in patients with metastatic RCC (mRCC), as we and others have recently reported (Ko et al., 2009; Kusmartsev et al., 2008; Mirza et al., 2006; Zea et al., 2005). Moreover, depletion of MDSCs from RCC patients’ PBMCs, or from the spleens oe BM of tumor-bearing mice, can instantly restore normal T cell responsiveness (Tatsumi et al., 2003; Finke et al., 2008; Ko et al., 2009) (Figures 3,4).
Figure 3.

PBMCs from RCC patients depleted of CD15+ cells recover normal T cell function. n-MDSCs mechanically removed, shown pre and post Miltenyi bead CD15 depletion (A and B), then subjected to anti-CD3/CD28 stiimulation and IFN-γ assayed for CD3 cells by intracellular cytokine assay (C and D). This is repesentative of dozens of patients.
Figure 4.

Splenocytes from 4T1 tumor bearing mice retain normal T cell function revealed in the absence of Gr1pos MDSCs. Splenocytes were labelled with CFSE and stimulated in culture with anti-CD3; CD8+ T cells required IL-2 production by anti-CD3 stimulated CD4+ T cells to survive. Naïve splenocytes displayed brisk proliferation (CFSE dilution) in response to anti-CD3 which was unaffected by 10 days of prior in vivo sunitinib treatment. In contrast, splenocytes from 4T1 bearing mice with >50% ambient MDSCs displayed markedly impaired proliferation unless Gr1+ MDSCs were mechanically depleted or mice were treated for 10 days with sunitinib, which quantitatively reduced ambient MDSCs to the same level as mechanical depletion.
RCC, ANTI-ANGIOGENESIS AGENTS, AND REVERSAL OF MDSC-INDUCED IMMUNOSUPPRESSION BY SUNITINIB
Pursuant to the disappointing clinical results seen with immunotherapy, treatment strategies targeting tumor angiogenesis have produced frequent therapeutic effects in RCC patients. One such agent, sunitinib, is a multitargeted receptor tyrosine kinase inhibitor (RTKI) of VEGF and related receptors. It has produced significant objective responses in patients with metastatic RCC and a superior progression-free survival when compared to IFN-α (Brugarolas, 2007; Heng et al., 2009; Motzer et al., 2006, 2007). Although anti-angiogenic agents such as sunitinib, bevacizumab and sorafenib produce disease stabilization in many RCC patients and shrink tumors in some, all patients eventually incur disease progression after a time period usually measured in months (Miller et al., 2005). Such disease progression is thought to reflect an evasive response to drug by the tumors (Kerbel, 2005).
The two RTKI’s which are FDA-approved for treatment of RCC, sunitinib and sorafenib, are highly promiscuous in regards to their RTK targeting (Motzer et al., 2006, 2007). Sunitinib inhibits signaling not only through the vascular endothelial growth factor receptors (VEGFR), but also through platelet-derived growth factor receptor (PDGFR), stem cell factor receptor (c-Kit), Flt3, and colony stimulating factor-1 receptor (CSF-1R) tyrosine kinases (Roskoski, 2007). The theoretical basis for therapeutic success in this setting is founded on the prominent role of VEGF signaling in the pathogenesis of clear-cell RCC. Von Hippel-Lindau (VHL) gene inactivation occurs in the majority of sporadic cases of clear-cell carcinoma, the most common form of RCC (Kaelin, 2007). VHL inactivation leads to the downstream overproduction of VEGF via dysregulation of the HIF transcription factor. VEGF overproduction promotes tumor-associated angiogenesis required for tumor growth and metastasis (Garcia and Rini, 2007; Kaelin, 2007).
Although it is well documented that a major effect of sunitinib is to block angiogenesis and tumor growth (Heng and Bukowski, 2008), our studies with RCC patients revealed that sunitinib was also very effective in reducing MDSCs (Ko et al., 2009) and, to a lesser extent, Tregs in the peripheral blood. Remarkably, sunitinib therapy itself is sufficiently MDSC-ablative to have impacts equivalent to MDSC mechanical depletion, restoring normal T1-type cell function in RCC. (Finke et al., 2008; Ko et al., 2009) (Figure 5).
Figure 5.

RCC patients developed much reduced peripheral blood MDSCs and normalized T cell responses during 2 months of sunitinib treatment. Red blocks display average % frequency of MDSCs in peripheral blood of Normal Donors vs RCC patients before and during sunitinib treatment. Vertical bars display % of CD3+ T cells producing IFN-γ which normalized during sunitinib treatment.
Patient PBMCs stimulated with anti-CD3/28 mAbs produced significantly reduced IFN-γ compared to age matched healthy donors, but also manifested corresponding elevations in peripheral MDSCs. n-MDSCs (CD15+CD14−), less mature MDSCs (Lin-CD14−CD15−), and m-MDSCs (CD15−CD14+) were all present, but n-MDSCs were most prevalent by at least 3–4 fold, hence the major elevated component Figure 2). We observed, however, that sunitinib significantly improved mRCC patient T cell function after 1 and 2 cycles of treatment and that this was accompanied by significant declines in frequency and absolute numbers of circulating MDSCs (Ko et al., 2009) (Figure 5).
Statistical analyses revealed significant patient-to-patient correlations between improvements in T cell IFN-γ production and declines in MDSCs following sunitinib, and also between declines in MDSCs and declines in CD4+CD25hiFoxp3+ regulatory T cells following treatment (Ko et al., 2010). Furthermore, in 6 of 7 HLA-DR4+ patients we observed significantly increased T cell binding to MHC tetramers incorporating the RCC-associated EphA2 and MAGE6 peptides, but not control Malaria peptide, after 1–2 cycles of sunitinib (not shown).
To validate the role of peripheral blood MDSCs in T cell suppression, we studied RCC patient PBMCs collected prior to treatment. We observed that mechanical in vitro MDSC depletion prior to polyclonal stimulation significantly improved T1-type function (Figure 3). In addition, the suppressive nature of patient MDSCs was confirmed when the isolated MDSCs were added back to patient T cells (not shown). Such MDSC-mediated in vitro T cell suppression was partially reversible with sunitinib at 1 μg/ml in vitro, or with the addition of excess arginine or catalase, implicating ARG1 and ROS as suppressive mechanisms for mRCC patient peripheral blood MDSCs, predominantly of the granulocytic variety (not shown).
SUNITINIB EXERTS SIMILAR PERIPHERAL MDSC REDUCTION IN ALL TESTED MOUSE TUMOR MODELS
Recent published studies in many murine tumor models have confirmed the capacity of suntinib monotherapy to deplete MDSCs while preserving normal T cell function (Ozao-Choy et al., 2009; Xin et al., 2009). We performed parallel studies in several mouse tumor models in which the hallmark of MDSC-induced T cell dysfunction is accumulation, sometimes massive, of splenic CD11b+Gr1+ MDSC. Treatment of either 4T1 mammary, CT26 colon, or RENCA kidney tumor-bearing mice, or even of naïve mice, with a clinically relevant daily i.p. dose of 40 mg/kg sunitinib significantly reduced the percentage as well as total numbers of CD11b+Gr1+ MDSCs detected in spleen (Figure 6). Such MDSC reduction was associated with significant disinhibition of T cells which were otherwise suppressed in the tumor-bearing state.
Figure 6.
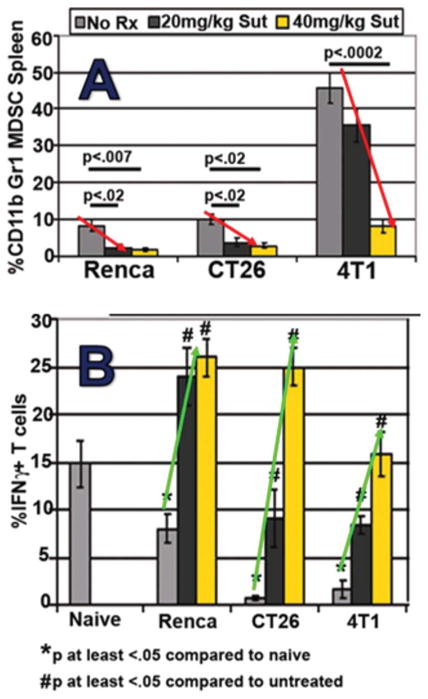
Three mouse tumor models display dose-dependent reductions in splenic MDSCs (A) and normalized T cell function (B) during sunitinib treatment. Note the range in MDSC sensitivity, with 4T1 model displaying splenic MDSC resistance at the 20 mg/kg dose.
As observed in Figure 6, T cells present within MDSC-rich splenic suspensions from 4T1 tumor-bearing mice were less able to produce IFN-γ upon polyclonal stimulation when compared to naïve, non-tumor-bearing mice. Such T cell impairment was fully reversible; however, by either in vivo MDSC depletion using sunitinib, or by in vitro MDSC depletion using anti-Gr1-magnetic beads (Figure 4). Bead-isolated MDSCs could be introduced to suppress T cells from naïve mice as well (not shown). Impacts of MDSCs and sunitinib treatment upon T cell proliferation paralleled those observed for IFN-γ secretion (Figure 4). Similar improvements in T cell function after sunitinib treatment were also appreciated in mice bearing CT26 and RENCA tumors (Figure 6).
SUNITINIB’S IMPACTS ON MDSCs AND T CELL FUNCTION ARE UNIQUE AND INDEPENDENT OF ITS ANTI-TUMOR EFFECT
Sunitinib inhibits the tyrosine kinase activation of VEGF, ckit, flt3, M-CSF, and PDGF receptors, and both VEGF and the c-kit ligand stem cell factor (SCF) have previously been implicated in MDSC accumulation (Roskoski, 2007) We therefore aimed to determine which sunitinib-receptor interactions are essential to its anti-MDSC effects. We compared the impacts of sunitinib to that of imatinib (ckit and PDGF blockade), vatalinib (VEGFR blockade), or a combination of imatinib and vatalinib (ckit, PDGF, and VEGFR blockade) upon tumor-induced MDSC accumulation when each drug was administered at maximally tolerated doses.
Figure 7 demonstrates that no single drug or combination of drugs (not shown) could reduce the total number or % of splenic CD11b+Gr1+ MDSCs in the magnitude observed for sunitinib. Our vatalinib observations were consistent with Rodriguez et al.’s recent report (Rodriguez et al., 2009) that treatment of RCC patients with bevacizumab alone (anti-VEGF mAb) also did not reduce peripheral blood MDSC.
Figure 7.

Comparisons with other RTKi’s fail to delineate the mechanism by which sunitinib decimates splenic MDSCs. A. Comparison targets for different RTKi’s. B,C, Sunitinib profoundly decreases splenic MDSCs in both 4T1 and CT26 models with minimal comparable impact from either imatinib (Gleevec) or vatalanib. Not shown: similar lack of impact from lestaurtinib, combined imatinib and vatalanib, or sorafenib. Maximially tolerated doses (MTDs) were determined for each agent and used in these comparisons.
Because, in contrast to sunitinib, combined treatment with imatinib plus vatalanib does not inhibit Flt3, it raised the possibility that Flt3 blockade was essential. However, single agent lestaurtinib, which selectively blocks Flt3, proved ineffective, as was sorafenib, which, similarly to sunitinib, promiscuously blocks VEGFr, PDGFr, Flt3 and c-KIT (not shown). Furthermore, in contrast to sunitinib, sorafenib impaired primary T cell responses in vivo (Hipp et al., 2008), suggesting that sorafenib’s promiscuity is not precisely congruent with sunitinib. Therefore, the mechanistic basis for sunitinib’s unique blockade of MDSC function and sparing of T cell function cannot readily be discerned from these agent comparisons, and is likely to involve blockade of multiple and perhaps additional uncharacterized enzymatic targets.
In our previous studies of 23 mRCC patients, we observed that even patients whose tumors progressed showed declines in MDSCs (Finke et al., 2008; Ko et al., 2009). Therefore, such MDSC declines were not merely a consequence of tumor cytoreduction. Similarly, in the 3 mouse tumor models we have so far studied, the anti-MDSC and pro- T cell effects of sunitinib occurred regardless of whether there was a negligible (4T1), modest (CT26), or robust (RENCA) (not shown) corresponding anti-tumor effect (Figure 6).
SUNITINIB INHIBITS BOTH TUMOR-INDUCED M-MDSC PROLIFERATION AND TUMOR-ENHANCED N–MDSC SURVIVAL IN MICE
We investigated sunitinib’s effects upon tumor-induced CD11b+Gr1lo (monocytic, m-MDSC) vs CD11b+Gr1hi (neutrophilic, n-MDSC) MDSCs in mouse spleen. We observed that Gr1hi n-MDSCs were four-fold more prevalent than Gr1lo m-MDSC. The former were Ly6Ghi, F4/80-, and displayed early or completed polymorphonuclear differentiation on cytospins. In contrast, Gr1lo m-MDSCs were Ly6Glo, and displayed variable F4/80 expression as well as monocytic or immature morphology, but not polymorphonuclear features, on cytospin (Figure 1). Therefore, these MDSCs subset trends in mice strongly paralleled those we had previously identified in mRCC patients’ peripheral blood and tumor (Ko et al., 2010).
We then employed a kinetic in vivo BrdU technique which measured MDSC proliferation (BrdU uptake) in splenic MDSC, to determine if sunitinib inhibits MDSC accumulation via an anti-proliferative effect. We found that within 6 days of treatment initiation, sunitinib strongly suppressed 4T1-induced intrasplenic proliferation of Gr1lo MDSCs (Ko et al., 2010). Although this partially accounted for sunitinib’s inhibition of 4T1-induced massive splenomegaly (Figure 7), sunitinib did not detectably inhibit proliferation of the more abundant Gr1hi n-MDSC, which were relatively hypoproliferative at this stage of differentiation (Ko, Rayman et al. 2010). We therefore investigated whether sunitinib also induced apoptosis of already matured Gr1hi n-MDSCs in vivo.
We observed that: 1) over half of Gr1hi n-MDSCs found in the spleens of naïve mice were undergoing apoptosis, consistent with the rapid turnover of normal neutrophils; 2) the rate of n-MDSC apoptosis in tumor-bearing mice was significantly reduced compared to naïve, indicating that they have a prolonged lifespan in vivo; 3) sunitinib significantly reduced the viability of splenic n-MDSCs in tumor hosts within 6 days of treatment (Ko et al., 2010). These studies indicated that sunitinib inhibits tumor-induced immature MDSC proliferation as well as tumor-enhanced n-MDSC survival in mouse spleen.
MECHANISMS BY WHICH MDSCS BECOME RESISTANT TO SUNITINIB
Whereas sunitinib given at its maximally tolerated dose (MTD) produced major reductions in tumor-induced MDSCs in the spleens of all three studied tumor models (Figure 8D), we observed that sunitinib completely failed to reduce MDSCs in the BM of 4T1 tumor-bearing mice (not shown), and produced only a modest decline of MDSCs within the tumor bed (Figure 8E). Intratumoral MDSCs from the other models displayed less resistance to sunitinib, commensurate with sunitinib’s capacity to induce at least transient tumor regression (RENCA) or slowed progression (CT26) (Figures 8A–C).
Figure 8.

Despite constant susceptibility of intrasplenic MDSCs to sunitinib at MTD 40 mg/kg (D), intratumoral MDSC resistance to sunitinib was evident to a varied but sometimes profound degree (E). For the 3 tumor models compared, the disparate susceptibility of tumors to 10 days of sunitinib treatment (regression, stabilization or progression, A–C) was predictive of intratumoral (D) but not intrasplenic MDSC susceptibility (E).
Consistent with persistence of functionally suppressive intratumoral MDSCs during sunitinib treatment, T1-type function could not readily be elicited from viable whole cell 4T1 tumor digests, in contrast to splenocytes, during sunitinib treatment (Figure 9A). Indeed, bead-isolated MDSCs from the tumors or BM of sunitinib-treated mice could inhibit activation of naïve T cells in vitro, showing that those MDSCs remained functionally suppressive during sunitinib treatment (Figure 9B and not shown). Finally, exposure of isolated splenic MDSCs to either tumor-conditioned medium (TCM) or GM-CSF in vitro dampened the pro-apoptotic effect of sunitinib on these cells, suggesting that soluble factors present within the tumor and BM microenvironments, but relatively lacking in the spleen and peripheral blood, resulted in the observed resistance to sunitinib (Figures 9C–D and not shown) (Ko et al., 2010).
Figure 9.

Evidence of intratumoral MDSC resistance to sunitinib in the 4T1 model. (A) % of CD3+ T cells producing IFN-γ upon anti-CD3/CD28 stimulation demonstrates that 4T1-induced inhibition within spleen is reversible by sunitinib treatment but not the inhibition observed within tumor. (B) Sunitinib-treated 4T1 bearing-mice maintained high levels of intratumoral but not intrasplenic MDSCs, and isolation/addition of the former to T cell assay was highly suppressive, demonstrating that intratumoral MDSCs retained their suppressive function during sunitinib treatment; (C) and (D) G-CSF was detectable in blood, spleen and tumor compartments but GM-CSF was only detected intratumorally.
Such compartmentally selective sunitinib resistance in the 4T1 model led us to investigate whether a similar phenomenon could be occurring in our mRCC patients who, like 4T1-bearing mice, generally experience slowed tumor growth without cure during sunitinib treatment. In our initial analyses of 20 human RCC tumor digests from patients prior to sunitinib treatment, we observed a predominance of n-MDSCs over m-MDSCs and immature MDSCs, also paralleling 4T1 (Figure 2). Time course data demonstrated that, in contrast to peripheral blood, intratumoral MDSCs persisted during sunitinib treatment at levels similar or greater than pretreatmen (Figure 10A).
Figure 10.

Evidence of intratumoral MDSC resistance to sunitinib in RCC patients. (A) sunitinib treatment does not alter presence of intratumoral MDSC despite its profound reduction of peripheral blood MDSCs (Fig. 5). (B) RCC tumor-infiltrating lymphocytes continue to display suppressed T cell function during sunitinib treatment (in contrast to normalized function of peripheral blood T cells; (C) all tested established RCC cell lines and freshly prepared RCC explants produce prodigious amounts of GM-CSF; (D) freshly isolated MDSCs from RCC tumor display constitutive pSTAT5 activation (green) and potential for enhanced pSTAT5 activation by further exposure to GM-CSF.
In addition, tumor-infiltrating T cells (TILs) from both untreated RCC patients and the 4 sunitinib-treated patients had depressed T1-type function compared to healthy volunteer PBMCs when measured as % of T cells producing IFNγ in response to anti-CD3/28 stimulation (Figure 10B). Therefore, despite sunitinib’s capacity to deplete peripheral blood MDSCs and restore peripheral blood T cell function, these clinically desirable modulations were not observed within the RCC tumor bed itself, again paralleling the 4T1 model.
MDSCs RESPOND LIKE NORMAL HEMATOPOIETIC PROGENITORS TO STAT5 VS STAT3 ACTIVATION
We investigated whether physiologic modulators of normal hematopoiesis might also dictate susceptibility to sunitinib. Our own (Cohen et al., 2008) and others’ (Esashi et al., 2008) previous studies indicated that agents which produced either STAT3- or STAT5-dependent activation of hematopoietic progenitors gave rise to widely divergent differentiation outcomes. The dominant myeloid differentiation pathway in normal bone marrow is STAT5 activation by GM-CSF, which also dominantly suppresses STAT3 activation. Activation of this pathway results in apparently normal generation of all myeloid lineages, including a minor population of resting DCs that requires further signals such as TLR ligation to achieve mature function (Cohen et al., 2008) (Figure 12B).
Figure 12.

Physiologic regulation of normal hematopoiesis by STAT3 vs STAT5 activating agents. Flt3L stimulates pan-differentiation of CD34pos common myeloid and common lymphocyte precursors into CD11cpos committed DC precursors via a STAT3-dependent process. This is markedly potentiated by IL-6 and G-CSF, but is dominantly suppressed by early exposure to GMCSF, due to inhibition of STAT3 activation and concomitant STAT5 activation. Such early GMCSF exposure instead favors differentiation of CD34pos common myeloid precursors into granulocyte/monocyte progenitors (rather than committed DC precursors). The granulocyte/monocyte progenitors achieve subsequent multilineage differentiation, including STAT5-dependent differentiation into conventional DCs and macrophages, and STAT5-independent differentiation into neutrophils. Phenotypically conventional DCs generated by STAT3- vs STAT5-dependent pathways differ in many critical characteristics. It should be emphasized that although early exposure to GMCSF blocks STAT3-dependent DC differentation, later exposure of committed DC precursors to GMCSF may instead promote maturation and DC1-polarization, again by stimulating STAT5 and inhibiting STAT3.
In contrast, activation of STAT3-dependent differentiation requires first and foremost an absence of GM-CSF. Isolated exposure to Flt3 ligand, a putative but weak STAT3 activator, stimulates all current CD34pos progenitors to stop proliferating and differentiate into fully matured myeloid DCs within 48 hours (Cohen et al., 2008) (Figure 12A). Co-addition of sustained potentiators of STAT3 activation (e.g., IL-6 or G-CSF in addition to Flt3L, again in the absence of GM-CSF), instead results in open-ended proliferation of lineage negative, CD34pos progenitors which are already globally committed to differentiate into mature, immunocompetent DCs upon withdrawal from the STAT3 stimuli.
Such DCs are uniquely efficient at processing tumor Ag, are resistant to IL-10 or VEGF inhibition, and are paradoxically rendered even more efficient by TGFβ exposure. Only PGE2 is inhibitory, and modestly so (Cohen et al., 2008) (Figure 12A). Furthermore, even though later GM-CSF exposure forces a switch to STAT5-dependent programming, the commitment to global DC differentiation is retained and is functionally enhanced by the switch, for example, in regards to augmented IL-12p70 production.
Because STAT3-activated differentiation requires both inflammatory signals (e.g., Flt3L, IL-6 and G-CSF) and an initial absence of GM-CSF, it is most likely normally operative as an intermittent extramedullary pathway to assure a fresh supply of highly immunocompetent DCs in times of life threatening infection. In addition, myelophthistic infections that crowd out normal bone marrow elements may stimulate local Flt3L expression (Chklovskaia et al., 1999) while decreasing local GM-CSF production, potentially also giving rise to transient STAT3-dependent DC differentiation
Unsurprisingly, as nontransformed cells, MDSCs proved to respond to normal STAT3- and STAT5-dependent conditioning signals. We generated MDSCs from normal BM by incubation in Flt3L and SCF, and these proved highly susceptible to sunitinib-inducible apoptosis (Figure 11A/B). Co-addition of IL-6 or G-GSF, widely detectable in 4T1-bearing mice (Figure 9C and not shown) did not protect against sunitinib-induced apoptosis (Figures 11A/B). Furthermore, IL-6 or G-CSF’s induction of sustained STAT3 activation was suppressed by sunitinib (Fig 11c). In contrast, co-addition of GM-CSF, measurable within tumor but not peripherally (Figure 9C), itself suppressed STAT3 activation in favor of STAT5 activation, similar to GM-CSF’s effect on normal hematopoietic cells, and that switch in STAT dependency conferred complete protection against sunitinib (Figure 11C) (Ko et al., 2009).
Figure 11.

GM-CSF switches MDSCs from STAT3 to STAT5 dependent programming, conferring sunitinib resistance. (A,B) Mouse MDSCs were prepared in Flt3L +SCF (STAT3 dependent pathway) and when exposed to sunitinib in vitro were increasingly ssuceptible to apoptosis. Exposure to STAT3 potentiating agents G-CSF and IL-6 was not protective, but exposure to GM-CSF was fully protective. (C) G-CSF or IL-6 cotreatment was associated with elevated pSTAT3, which was disrupted if sunitinib was also added. In contrast, GM-CSF itself preempted pSTAT3 activation with pSTAT5 activation, with no further modulations observed when sunitinib was also added. (D) Preparing MDSCs from STAT5 knockout mice eliminates GM-CSF’s conferral of resistance to MDSCs.
These results were consistent with the possibility, also suggested by others (Xin et al., 2009), that sunitinib-mediated suppression of STAT3 rendered STAT3-dependent MDSCs susceptible to sunitinib. We further postulated that GM-CSF’s ability to confer sunitinib resistance reflected activation of an alternative, sunitinib-resistant STAT5-dependent functional pathway. Proving this hypothesis, MDSCs generated from STAT5 knockout mice failed to display resistance to sunitinib-induced apoptosis (Ko et al., 2009).
Corollary studies supported the likelihood that sunitinib resistance of MDSCs is frequently attributable to GM-CSF: (1) as observed for 4T1, every tested human RCC cell line and short-term cultured RCC explant produced prodigious quantities of GM-CSF (Figure 10C); (2) in early studies, baseline up-regulation of pSTAT5 was evident in MDSCs present within viable digests of fresh RCC explants; (3) treatment of 4T1 mice with daily rmGM-CSF rendered splenic MDSCs partially resistant to sunitinib; (4) systemic treatment of 4T1 mice with weekly neutralizing mAb rendered intratumoral MDSCs partially susceptible to sunitinib, with a commensurate attenuation in tumor progression as well as an increased intratumoral frequency of CD4+ and CD8+ T cells.
INTEGRATING THE OBSERVATIONS OF OTHERS
Bronte’s group reported as early as 2004 that tumor vaccines that were transfected to produce GM-CSF lost their efficacy when higher concentrations of GM-CSF were secreted, and that this corresponded to systemic induction of MDSCs (Serafini et al., 2004). The latter displayed inhibition of T cell proliferation which was reversible by iNOS2 inhibition (Serafini et al., 2004). The T cell assay did not distinguish whether the failure of T cells to proliferate was due to a reversible process or to iNOS2-mediated killing of the T cells. More recent studies by the same group demonstrate that G-CSF stimulates accumulation of Gr1high n-MDSCs whereas GM-CSF favors accumulation of Gr1low and Gr1int subpopulations (m-MDSCs and precursors) (Dolcetti et al., 2010).
Our own observations are most consistent with the hypothesis that sunitinib-sensitive MDSCs are STAT3-dependent MDSCs which lack sufficient exposure to GM-CSF to be recruited to the protective STAT5-dependent pathway. Consistent with this as well as with the Bronte team’s observations, sunitinib sensitivity is most apparent in G-CSF/IL-6 predominant compartments (blood stream and spleen) and sunitinib resistance most apparent in GM-CSF predominant compartments (tumor and bone marrow). This is also consistent with our corollary observations, relevant to at least the 4T1 tumor model, that the spleens of rGM-CSF treated mice develop previously inapparent sunitinib-resistant MDSCs, whereas the tumors of anti-GM-CSF treated mice develop previously inapparent sunitinib-susceptible MDSCs.
Given the overriding and irreversible nature of GM-CSF induced STAT5-dependent programming, at least for normal hematopoietic progenitors, it is unlikely that MDSCs proliferating within the BM under STAT5-dependent programming can later emigrate and switch over to STAT3-dependent programming. Instead, so long as exogenous rGM-CSF is not administered, low GM-CSF extramedullary sites are likely to harbor STAT3-dependent MDSCs ranging from the earliest proliferative precursors to scarcely proliferating n-MDSCs (m-MDSCs also present but n-MDSCs favored in STAT3 environment), sunitinib susceptible at all stages of differentiation. Conversely, high GM-CSF compartments (BM and tumor) likely harbor sunitinib-resistant MDSCs ranging from proliferative precursors to hypoproliferative m-MDSCs (n-MDSCs also present but m-MDSCs likely favored in STAT5 environment).
STAT3-programmed, sunitinib-sensitive compartments display a prevalence of n-MDSCs which are associated with constitutive ARG1 and protein kinase C-inducible ROS production, but not with iNOS2 expression or nitric oxide production. These are MDSCs which induce T cell tolerance by generating an ambient depletion of arginine, leading to reversible CD3ζ signalling impairment. Physical removal of these MDSCs promptly terminates the tolerant state. How inducible ROS production participates in such reversible T cell suppression is not entirely clear, and it is possible that such ROS production mainly protects these MDSCs from nitric oxide produced by other MDSCs (Brune et al., 1997).
Recent studies by Gabrilovich’s group also suggest that ROS production itself mainly prevents MDSCs from differentiating into normal cells (Corzo et al., 2009). In contrast, STAT5-programmed, sunitinib-resistant compartments display prevalence of m-MDSCs with greater pluripotency depending on whether they are stimulated by IL-4 (STAT6 activation), IFN-γ (STAT1 activation) or TLR ligation (MyD88 activation). In the case of IL-4 stimulation (Bronte et al., 2003), m-MDSCs emulate n-MDSCs’ reversible induction of T cell tolerance via ARG1 and PKC inducible-ROS production. In the case of IFN-γ or TLR agonist stimulation, iNOS2 is induced and further induction of ROS facilitates the MDSCs’ ability both to secrete highly toxic peroxynitrates and to protect themselves during the processing of nitric oxide (Brune et al., 1997).
MDSCs: A COHESIVE OVERVIEW FOR THERAPEUTIC PURPOSES
Sunitinib displays an exceptional capacity to eradicate n-MDSCs and precursors which are STAT3-dependent and possibly limited to a highly reversible T cell suppressive mechanism (ARG1). Because much presentation of tumor-associated Ags occurs in lymph nodes and spleen by migrating DCs, it is possible that eradication of only STAT3-dependent peripheral MDSC compartments could enhance anti-tumor immunity, particularly in tandem with vaccine maneuvers or other tandem forms of immunotherapy (Bose et al., 2011).
However, in many cases, intratumoral DCs and, probably in all cases, intramedullary DCs are likely to be STAT5-dependent, sunitinib resistant and iNOS2-capable. We are evaluating therapeutic targeting of these STAT5-dependent compartments with anti-GMCSF and STAT5-targeting agents such as pimozide (Nelson et al., 2010; Page et al., 2010; Yao et al., 2005). However, an alternative approach involves recognition of the likely fact that IFN-γ and TLR agonist stimulated m-MDSCs are no longer really suppressor cells if they are activated within compartments where they release lethal nitric oxide and peroxynitrites that can kill tumor cells and tumor vascular stroma (Ostrand-Rosenberg et al., 2002). In fact, strategic targeting of effectively activated anti-tumor T cells to tumor compartments may produce a focused release of tumor-specific IFN-γ, thereby promoting m-MDSC STAT1 activation and tumoricidal nitric oxide and peroxynitrate production.
Although this will likely also kill off bystander T cells and antigen-presenting cells, for most T1-type T cells it is fair to say that entering a tumor is inevitably a suicide mission, since IFN-γ release not only activates m-MDSC iNOS2 expression, but also up-regulates expression of directly lethal ligands such as B7H1 (PD1-ligand) on most tested tumor cells (Pardoll, 2012). In other words, since tumor-Ag stimulated IFN-γ production leads by many pathways to intratumoral T cell death, the strategic activation of intratumoral m-MDSC iNOS2 expression may render the T cells’ evident sacrifice therapeutically meaningful.
CONCLUSION
The antiangiogenic promiscuous RTKi sunitinib displays a remarkable capacity almost to quantitatively eradicate STAT3-dependent n-MDSCs and their precursors. This property also has proved to be a remarkable opportunity to monitor and investigate the features of sunitinib-resistant STAT5-dependent m-MDSCs. Although both n-MDSCs and m-MDSCs have a capacity to gently and reversibly inhibit T cell function through ARG1 production, the seemingly distinctive capacity of m-MDSCs to express iNOS2 in response to concerted T1 and/or innate immunity signals reflects a potential for ancillary effector rather than suppressor function, and a strategic opportunity to orchestrate destruction of tumor cells and their stroma.
Footnotes
Declaration of Interest: This work was supported by RO1 CA129815 (P.C.) and R01 CA150959 (P.C., J.F.). The authors report no conflicts of interest. The authors alone are responsible for the content and writing of the paper.
References
- Almand B, Clark JI, et al. Increased production of immature myeloid cells in cancer patients: a mechanism of immunosuppression in cancer. J Immunol. 2001;166 (1):678–689. doi: 10.4049/jimmunol.166.1.678. [DOI] [PubMed] [Google Scholar]
- Bingisser RM, Tilbrook PA, et al. Macrophage-derived nitric oxide regulates T cell activation via reversible disruption of the Jak3/STAT5 signaling pathway. J Immunol. 1998;160(12):5729–5734. [PubMed] [Google Scholar]
- Bose A, Taylor JL, et al. Sunitinib facilitates the activation and recruitment of therapeutic anti-tumor immunity in concert with specific vaccination. Int J Cancer. 2011 doi: 10.1002/ijc.25863. [DOI] [PMC free article] [PubMed] [Google Scholar]
- Bronte V, Serafini P, et al. IL-4-induced arginase 1 suppresses alloreactive T cells in tumor-bearing mice. J Immunol. 2003;170(1):270–278. doi: 10.4049/jimmunol.170.1.270. [DOI] [PubMed] [Google Scholar]
- Brossart P, Stuhler G, et al. Her-2/neu-derived peptides are tumor-associated antigens expressed by human renal cell and colon carcinoma lines and are recognized by in vitro induced specific cytotoxic T lymphocytes. Cancer Res. 1998;58(4):732–736. [PubMed] [Google Scholar]
- Brugarolas J. Renal-cell carcinoma–molecular pathways and therapies. N Engl J Med. 2007;356(2):185–187. doi: 10.1056/NEJMe068263. [DOI] [PubMed] [Google Scholar]
- Brune B, Gotz C, et al. Superoxide formation and macrophage resistance to nitric oxide-mediated apoptosis. J Biol Chem. 1997;272(11):7253–7258. doi: 10.1074/jbc.272.11.7253. [DOI] [PubMed] [Google Scholar]
- Chklovskaia E, Jansen W, et al. Mechanism of flt3 ligand expression in bone marrow failure: translocation from intracellular stores to the surface of T lymphocytes after chemotherapy-induced suppression of hematopoiesis. Blood. 1999;93(8):2595–2604. [PubMed] [Google Scholar]
- Cohen PA, Koski GK, et al. STAT3- and STAT5-dependent pathways competitively regulate the pan-differentiation of CD34pos cells into tumor-competent dendritic cells. Blood. 2008;112(5):1832–1843. doi: 10.1182/blood-2007-12-130138. [DOI] [PMC free article] [PubMed] [Google Scholar]
- Corzo CA, Cotter MJ, et al. Mechanism regulating reactive oxygen species in tumor-induced myeloid-derived suppressor cells. J Immunol. 2009;182(9):5693–5701. doi: 10.4049/jimmunol.0900092. [DOI] [PMC free article] [PubMed] [Google Scholar]
- Dolcetti L, Peranzoni E, et al. Hierarchy of immunosuppressive strength among myeloid-derived suppressor cell subsets is determined by GM-CSF. Eur J Immunol. 2010;40(1):22–35. doi: 10.1002/eji.200939903. [DOI] [PubMed] [Google Scholar]
- Dolganiuc A, Paek E, et al. Myeloid dendritic cells of patients with chronic HCV infection induce proliferation of regulatory T lymphocytes. Gastroenterology. 2008;135(6):2119–2127. doi: 10.1053/j.gastro.2008.07.082. [DOI] [PubMed] [Google Scholar]
- Duhe RJ, Evans GA, et al. Nitric oxide and thiol redox regulation of Janus kinase activity. Proc Natl Acad Sci USA. 1998;95(1):126–131. doi: 10.1073/pnas.95.1.126. [DOI] [PMC free article] [PubMed] [Google Scholar]
- Eardley DD, Gershon RK. Induction of specific suppressor T cells in vitro. J Immunol. 1976;117(1):313–318. [PubMed] [Google Scholar]
- Esashi E, Wang YH, et al. The signal transducer STAT5 inhibits plasmacytoid dendritic cell development by suppressing transcription factor IRF8. Immunity. 2008;28 (4):509–520. doi: 10.1016/j.immuni.2008.02.013. [DOI] [PMC free article] [PubMed] [Google Scholar]
- Fainaru O, Hantisteanu S, et al. Immature myeloid cells accumulate in mouse placenta and promote angiogenesis. Am J Obstet Gynecol. 2011;204(6):544, e18–23. doi: 10.1016/j.ajog.2011.01.060. [DOI] [PubMed] [Google Scholar]
- Filipazzi P, Valenti R, et al. Identification of a new subset of myeloid suppressor cells in peripheral blood of melanoma patients with modulation by a granulocyte-macrophage colony-stimulation factor-based antitumor vaccine. J Clin Oncol. 2007;25(18):2546–2553. doi: 10.1200/JCO.2006.08.5829. [DOI] [PubMed] [Google Scholar]
- Finke J, Ferrone S, et al. Where have all the T cells gone? Mechanisms of immune evasion by tumors. Immunol Today. 1999;20(4):158–160. doi: 10.1016/s0167-5699(98)01435-2. [DOI] [PubMed] [Google Scholar]
- Finke JH, Rayman P, et al. Characterization of the cytolytic activity of CD4+ and CD8+ tumor-infiltrating lymphocytes in human renal cell carcinoma. Cancer Res. 1990;50(8):2363–2370. [PubMed] [Google Scholar]
- Finke JH, Rini B, et al. Sunitinib reverses type-1 immune suppression and decreases T-regulatory cells in renal cell carcinoma patients. Clin Cancer Res. 2008;14(20):6674–6682. doi: 10.1158/1078-0432.CCR-07-5212. [DOI] [PubMed] [Google Scholar]
- Gabrilovich DI, Nagaraj S. Myeloid-derived suppressor cells as regulators of the immune system. Nat Rev Immunol. 2009;9(3):162–174. doi: 10.1038/nri2506. [DOI] [PMC free article] [PubMed] [Google Scholar]
- Garcia JA, Rini BA. Recent progress in the management of advanced renal cell carcinoma. CA Cancer J Clin. 2007;57(2):112–125. doi: 10.3322/canjclin.57.2.112. [DOI] [PubMed] [Google Scholar]
- Gershon RK, Eardley DD, et al. Functional inactivation of suppressor T cells by heat-killed macrophages. Nature. 1976;262(5565):216–217. doi: 10.1038/262216a0. [DOI] [PubMed] [Google Scholar]
- Ghiringhelli F, Puig PE, et al. Tumor cells convert immature myeloid dendritic cells into TGF-beta-secreting cells inducing CD4+CD25+regulatory T cell proliferation. J Exp Med. 2005;202(7):919–929. doi: 10.1084/jem.20050463. [DOI] [PMC free article] [PubMed] [Google Scholar]
- Heng DY, Bukowski RM. Anti-angiogenic targets in the treatment of advanced renal cell carcinoma. Curr Cancer Drug Targets. 2008;8(8):676–62. doi: 10.2174/156800908786733450. [DOI] [PubMed] [Google Scholar]
- Heng DY, Chi KN, et al. A population-based study evaluating the impact of sunitinib on overall survival in the treatment of patients with metastatic renal cell cancer. Cancer. 2009;115(4):776–783. doi: 10.1002/cncr.24051. [DOI] [PubMed] [Google Scholar]
- Hesse M, Modolell M, et al. Differential regulation of nitric oxide synthase-2 and arginase-1 by type 1/type 2 cytokines in vivo: granulomatous pathology is shaped by the pattern of L-arginine metabolism. J Immunol. 2001;167(11):6533–6544. doi: 10.4049/jimmunol.167.11.6533. [DOI] [PubMed] [Google Scholar]
- Hipp MM, Hilf N, et al. Sorafenib, but not sunitinib, affects function of dendritic cells and induction of primary immune responses. Blood. 2008;111(12):5610–5620. doi: 10.1182/blood-2007-02-075945. [DOI] [PubMed] [Google Scholar]
- Hoechst B, Ormandy LA, et al. A new population of myeloid-derived suppressor cells in hepatocellular carcinoma patients induces CD4(+)CD25(+)Foxp3(+) T cells. Gastroenterology. 2008;135(1):234–243. doi: 10.1053/j.gastro.2008.03.020. [DOI] [PubMed] [Google Scholar]
- Hu SK, Eardley DD, et al. Definition of two pathways for generation of suppressor T-cell activity. Proc Natl Acad Sci USA. 1983;80(12):3779–3781. doi: 10.1073/pnas.80.12.3779. [DOI] [PMC free article] [PubMed] [Google Scholar]
- Huang B, Pan PY, et al. Gr-1+CD115+ immature myeloid suppressor cells mediate the development of tumor-induced T regulatory cells and T-cell anergy in tumor-bearing host. Cancer Res. 2006;66(2):1123–1131. doi: 10.1158/0008-5472.CAN-05-1299. [DOI] [PubMed] [Google Scholar]
- Jemal A, Siegel R, et al. Cancer statistics, 2007. CA Cancer J Clin. 2007;57(1):43–66. doi: 10.3322/canjclin.57.1.43. [DOI] [PubMed] [Google Scholar]
- Kaelin WG., Jr The von Hippel-Lindau tumor suppressor protein and clear cell renal carcinoma. Clin Cancer Res. 2007;13(2 Pt 2):680s–684s. doi: 10.1158/1078-0432.CCR-06-1865. [DOI] [PubMed] [Google Scholar]
- Kerbel RS. Therapeutic implications of intrinsic or induced angiogenic growth factor redundancy in tumors revealed. Cancer Cell. 2005;8(4):269–271. doi: 10.1016/j.ccr.2005.09.016. [DOI] [PubMed] [Google Scholar]
- Klapper JA, Downey SG, et al. High-dose interleukin-2 for the treatment of metastatic renal cell carcinoma: a retrospective analysis of response and survival in patients treated in the surgery branch at the National Cancer Institute between 1986 and 2006. Cancer. 2008;113(2):293–301. doi: 10.1002/cncr.23552. [DOI] [PMC free article] [PubMed] [Google Scholar]
- Kmieciak M, Gowda M, et al. Human T cells express CD25 and Foxp3 upon activation and exhibit effector/memory phenotypes without any regulatory/suppressor function. J Transl Med. 2009;7:89. doi: 10.1186/1479-5876-7-89. [DOI] [PMC free article] [PubMed] [Google Scholar]
- Ko JS, Rayman P, et al. Direct and differential suppression of myeloid-derived suppressor cell subsets by sunitinib is compartmentally constrained. Cancer Res. 2010;70 (9):3526–3536. doi: 10.1158/0008-5472.CAN-09-3278. [DOI] [PMC free article] [PubMed] [Google Scholar]
- Ko JS, Zea AH, et al. Sunitinib mediates reversal of myeloid-derived suppressor cell accumulation in renal cell carcinoma patients. Clin Cancer Res. 2009;15(6):2148–2157. doi: 10.1158/1078-0432.CCR-08-1332. [DOI] [PubMed] [Google Scholar]
- Korn T, Oukka M. Dynamics of antigen-specific regulatory T-cells in the context of autoimmunity. Semin Immunol. 2007;19(4):272–278. doi: 10.1016/j.smim.2007.03.001. [DOI] [PubMed] [Google Scholar]
- Kusmartsev S, Eruslanov E, et al. Oxidative stress regulates expression of VEGFR1 in myeloid cells: link to tumor-induced immune suppression in renal cell carcinoma. J Immunol. 2008;181(1):346–353. doi: 10.4049/jimmunol.181.1.346. [DOI] [PubMed] [Google Scholar]
- Lee JM, Seo JH, et al. The restoration of myeloid-derived suppressor cells as functional antigen-presenting cells by NKT cell help and all-trans-retinoic acid treatment. Int J Cancer. 2011 doi: 10.1002/ijc.26411. [DOI] [PubMed] [Google Scholar]
- Linehan WM, Zbar B. Focus on kidney cancer. Cancer Cell. 2004;6(3):223–228. doi: 10.1016/j.ccr.2004.09.006. [DOI] [PubMed] [Google Scholar]
- MacDonald KP, Rowe V, et al. Cytokine expanded myeloid precursors function as regulatory antigen-presenting cells and promote tolerance through IL-10-producing regulatory T cells. J Immunol. 2005;174(4):1841–1850. doi: 10.4049/jimmunol.174.4.1841. [DOI] [PubMed] [Google Scholar]
- Mahdipour E, Charnock JC, et al. Hoxa3 promotes the differentiation of hematopoietic progenitor cells into proangiogenic Gr-1+CD11b+ myeloid cells. Blood. 2011;117(3):815–826. doi: 10.1182/blood-2009-12-259549. [DOI] [PubMed] [Google Scholar]
- Marigo I, Dolcetti L, et al. Tumor-induced tolerance and immune suppression by myeloid derived suppressor cells. Immunol Rev. 2008;222:162–179. doi: 10.1111/j.1600-065X.2008.00602.x. [DOI] [PubMed] [Google Scholar]
- Miller KD, Sweeney CJ, et al. Can tumor angiogenesis be inhibited without resistance? Experientia. 2005;(94):95–112. doi: 10.1007/3-7643-7311-3_7. [DOI] [PubMed] [Google Scholar]
- Mirza N, Fishman M, et al. All-trans-retinoic acid improves differentiation of myeloid cells and immune response in cancer patients. Cancer Res. 2006;66(18):9299–9307. doi: 10.1158/0008-5472.CAN-06-1690. [DOI] [PMC free article] [PubMed] [Google Scholar]
- Motzer RJ, Hutson TE, et al. Sunitinib versus interferon alfa in metastatic renal-cell carcinoma. N Engl J Med. 2007;356(2):115–124. doi: 10.1056/NEJMoa065044. [DOI] [PubMed] [Google Scholar]
- Motzer RJ, Michaelson MD, et al. Activity of SU11248, a multitargeted inhibitor of vascular endothelial growth factor receptor and platelet-derived growth factor receptor, in patients with metastatic renal cell carcinoma. J Clin Oncol. 2006;24(1):16–24. doi: 10.1200/JCO.2005.02.2574. [DOI] [PubMed] [Google Scholar]
- Movahedi K, Guilliams M, et al. Identification of discrete tumor-induced myeloid-derived suppressor cell subpopulations with distinct T cell-suppressive activity. Blood. 2008;111(8):4233–4244. doi: 10.1182/blood-2007-07-099226. [DOI] [PubMed] [Google Scholar]
- Muranski P, Boni A, et al. Tumor-specific Th17-polarized cells eradicate large established melanoma. Blood. 2008;112(2):362–373. doi: 10.1182/blood-2007-11-120998. [DOI] [PMC free article] [PubMed] [Google Scholar]
- Nagaraj S, Nelson A, et al. Antigen-specific CD4(+) T cells regulate function of myeloid-derived suppressor cells in cancer via retrograde MHC class II signaling. Cancer Res. 2012;72(4):928–938. doi: 10.1158/0008-5472.CAN-11-2863. [DOI] [PMC free article] [PubMed] [Google Scholar]
- Nayak S, Cao O, et al. Prophylactic immune tolerance induced by changing the ratio of antigen-specific effector to regulatory T cells. J Thromb Haemost. 2009;7(9):1523–1532. doi: 10.1111/j.1538-7836.2009.03548.x. [DOI] [PMC free article] [PubMed] [Google Scholar]
- Nelson EA, Walker SR, et al. The STAT5 inhibitor pimozide decreases survival of chronic myelogenous leukemia cells resistant to kinase inhibitors. Blood. 2011;117(12):3421–3429. doi: 10.1182/blood-2009-11-255232. [DOI] [PMC free article] [PubMed] [Google Scholar]
- Neumann E, Engelsberg A, et al. Heterogeneous expression of the tumor-associated antigens RAGE-1, PRAME, and glycoprotein 75 in human renal cell carcinoma: candidates for T-cell-based immunotherapies? Cancer Res. 1998;58(18):4090–4095. [PubMed] [Google Scholar]
- Ochoa AC, Zea AH, et al. Arginase, prostaglandins, and myeloid-derived suppressor cells in renal cell carcinoma. Clin Cancer Res. 2007;13(2 Pt 2):721s–726s. doi: 10.1158/1078-0432.CCR-06-2197. [DOI] [PubMed] [Google Scholar]
- Onishi T, Ohishi Y, et al. An assessment of the immunological environment based on intratumoral cytokine production in renal cell carcinoma. BJU International. 1999;83(4):488–492. doi: 10.1046/j.1464-410x.1999.00925.x. [DOI] [PubMed] [Google Scholar]
- Ostrand-Rosenberg S, Clements VK, et al. Resistance to metastatic disease in STAT6-deficient mice requires hemopoietic and nonhemopoietic cells and is IFN-gamma dependent. J Immunol. 2002;169(10):5796–5804. doi: 10.4049/jimmunol.169.10.5796. [DOI] [PubMed] [Google Scholar]
- Ozao-Choy J, Ma G, et al. The novel role of tyrosine kinase inhibitor in the reversal of immune suppression and modulation of tumor microenvironment for immune-based cancer therapies. Cancer Res. 2009;69(6):2514–2522. doi: 10.1158/0008-5472.CAN-08-4709. [DOI] [PMC free article] [PubMed] [Google Scholar]
- Page BD, Khoury H, et al. Small molecule STAT5-SH2 domain inhibitors exhibit potent antileukemia activity. J Med Chem. 2012;55(3):1047–1055. doi: 10.1021/jm200720n. [DOI] [PubMed] [Google Scholar]
- Pan PY, Ma G, et al. Immune stimulatory receptor CD40 is required for T-cell suppression and T regulatory cell activation mediated by myeloid-derived suppressor cells in cancer. Cancer Res. 2010;70(1):99–108. doi: 10.1158/0008-5472.CAN-09-1882. [DOI] [PMC free article] [PubMed] [Google Scholar]
- Pardoll DM. The blockade of immune checkpoints in cancer immunotherapy. Nat Rev Cancer. 2012;12(4):252–264. doi: 10.1038/nrc3239. [DOI] [PMC free article] [PubMed] [Google Scholar]
- Pardoll DM, Topalian SL. The role of CD4+ T cell responses in antitumor immunity. Curr Opin Immunol. 1998;10(5):588–594. doi: 10.1016/s0952-7915(98)80228-8. [DOI] [PubMed] [Google Scholar]
- Powell DJ, Jr, Parker LL, et al. Large-scale depletion of CD25+regulatory T cells from patient leukapheresis samples. J Immunother. 2005;28(4):403–411. doi: 10.1097/01.cji.0000170363.22585.5a. [DOI] [PMC free article] [PubMed] [Google Scholar]
- Puisieux I, Bain C, et al. Restriction of the T-cell repertoire in tumor-infiltrating lymphocytes from nine patients with renal-cell carcinoma. Relevance of the CDR3 length analysis for the identification of in situ clonal T-cell expansions. Int J Cancer. 1996;66(2):201–208. doi: 10.1002/(SICI)1097-0215(19960410)66:2<201::AID-IJC11>3.0.CO;2-F. [DOI] [PubMed] [Google Scholar]
- Rodriguez PC, Ernstoff MS, et al. Arginase I-producing myeloid-derived suppressor cells in renal cell carcinoma are a subpopulation of activated granulocytes. Cancer Res. 2009;69(4):1553–1560. doi: 10.1158/0008-5472.CAN-08-1921. [DOI] [PMC free article] [PubMed] [Google Scholar]
- Rodriguez PC, Hernandez CP, et al. Arginase I in myeloid suppressor cells is induced by COX-2 in lung carcinoma. J Exp Med. 2005;202(7):931–939. doi: 10.1084/jem.20050715. [DOI] [PMC free article] [PubMed] [Google Scholar]
- Rodriguez PC, Quiceno DG, et al. L-arginine availability regulates T-lymphocyte cell-cycle progression. Blood. 2007;109(4):1568–1573. doi: 10.1182/blood-2006-06-031856. [DOI] [PMC free article] [PubMed] [Google Scholar]
- Rodriguez PC, Quiceno DG, et al. Arginase I production in the tumor microenvironment by mature myeloid cells inhibits T-cell receptor expression and antigen-specific T-cell responses. Cancer Res. 2004;64(16):5839–5849. doi: 10.1158/0008-5472.CAN-04-0465. [DOI] [PubMed] [Google Scholar]
- Rodriguez PC, Zea AH, et al. L-arginine consumption by macrophages modulates the expression of CD3 zeta chain in T lymphocytes. J Immunol. 2003;171(3):1232–1239. doi: 10.4049/jimmunol.171.3.1232. [DOI] [PubMed] [Google Scholar]
- Roskoski R., Jr Sunitinib: a VEGF and PDGF receptor protein kinase and angiogenesis inhibitor. Biochem Biophys Res Commun. 2007;356(2):323–328. doi: 10.1016/j.bbrc.2007.02.156. [DOI] [PubMed] [Google Scholar]
- Schendel DJ, Gansbacher B, et al. Tumor-specific lysis of human renal cell carcinomas by tumor-infiltrating lymphocytes. I HLA-A2-restricted recognition of autologous and allogeneic tumor lines. J Immunol. 1993;151(8):4209–4220. [PubMed] [Google Scholar]
- Schmielau J, Finn OJ. Activated granulocytes and granulocyte-derived hydrogen peroxide are the underlying mechanism of suppression of t-cell function in advanced cancer patients. Cancer Res. 2001;61(12):4756–4760. [PubMed] [Google Scholar]
- Schwartz A, Gershon RK. Regulation of in vitro cytotoxic T lymphocyte generation. III Interactions or regulatory T cell subsets in suppressor and target populations. J Mol Cell Immunol. 1984;1(4):237–252. [PubMed] [Google Scholar]
- Serafini P, Carbley R, et al. High-dose granulocyte-macrophage colony-stimulating factor-producing vaccines impair the immune response through the recruitment of myeloid suppressor cells. Cancer Res. 2004;64(17):6337–6343. doi: 10.1158/0008-5472.CAN-04-0757. [DOI] [PubMed] [Google Scholar]
- Serafini P, Mgebroff S, et al. Myeloid-derived suppressor cells promote cross-tolerance in B-cell lymphoma by expanding regulatory T cells. Cancer Res. 2008;68(13):5439–5449. doi: 10.1158/0008-5472.CAN-07-6621. [DOI] [PMC free article] [PubMed] [Google Scholar]
- Sinha P, Clements VK, et al. Cross-talk between myeloid-derived suppressor cells and macrophages subverts tumor immunity toward a type 2 response. J Immunol. 2007;179(2):977–983. doi: 10.4049/jimmunol.179.2.977. [DOI] [PubMed] [Google Scholar]
- Sinha P, Clements VK, et al. Reduction of myeloid-derived suppressor cells and induction of M1 macrophages facilitate the rejection of established metastatic disease. J Immunol. 2005;174(2):636–645. doi: 10.4049/jimmunol.174.2.636. [DOI] [PubMed] [Google Scholar]
- Smith FO, Downey SG, et al. Treatment of metastatic melanoma using interleukin-2 alone or in conjunction with vaccines. Clin Cancer Res. 2008;14(17):5610–5618. doi: 10.1158/1078-0432.CCR-08-0116. [DOI] [PMC free article] [PubMed] [Google Scholar]
- Solito S, Bronte V, et al. Antigen specificity of immune suppression by myeloid-derived suppressor cells. J Leukoc Biol. 2011;90(1):31–36. doi: 10.1189/jlb.0111021. [DOI] [PubMed] [Google Scholar]
- Steffens MG, Oosterwijk-Wakka JC, et al. Immunohistochemical analysis of tumor antigen saturation following injection of monoclonal antibody G250. Anticancer Res. 1999;19(2A):1197–1200. [PubMed] [Google Scholar]
- Takaba J, Mishima V, et al. Role of bone marrow-derived monocytes/macrophages in the repair of mucosal damage caused by irradiation and/or anticancer drugs in colitis model. Mediators Inflamm. 2010:634145. doi: 10.1155/2010/634145. [DOI] [PMC free article] [PubMed] [Google Scholar]
- Talmadge JE. Pathways mediating the expansion and immunosuppressive activity of myeloid-derived suppressor cells and their relevance to cancer therapy. Clin Cancer Res. 2007;13(18 Pt 1):5243–5248. doi: 10.1158/1078-0432.CCR-07-0182. [DOI] [PubMed] [Google Scholar]
- Tatsumi T, Herrem CJ, et al. Disease stage variation in CD4+ and CD8+ T-cell reactivity to the receptor tyrosine kinase EphA2 in patients with renal cell carcinoma. Cancer Res. 2003;63(15):4481–4489. [PubMed] [Google Scholar]
- Tatsumi T, Kierstead LS, et al. Disease-associated bias in T helper type 1 (Th1)/Th2 CD4(+) T cell responses against MAGE-6 in HLA-DRB10401(+) patients with renal cell carcinoma or melanoma. J Exp Med. 2002;196(5):619–628. doi: 10.1084/jem.20012142. [DOI] [PMC free article] [PubMed] [Google Scholar]
- Toes RE, Ossendorp F, et al. CD4 T cells and their role in antitumor immune responses. J Exp Med. 1999;189(5):753–756. doi: 10.1084/jem.189.5.753. [DOI] [PMC free article] [PubMed] [Google Scholar]
- Troy AJ, Summers KL, et al. Minimal recruitment and activation of dendritic cells within renal cell carcinoma. Clin Cancer Res. 1998;4(3):585–593. [PubMed] [Google Scholar]
- Uzzo RG, Rayman P, et al. Mechanisms of apoptosis in T cells from patients with renal cell carcinoma. Clin Cancer Res. 1999;5(5):1219–1229. [PubMed] [Google Scholar]
- Wang Z, Davies JD. CD8 blockade promotes the expansion of antigen-specific CD4+ FOXP3+ regulatory T cells in vivo. Int Immunopharmacol. 2007;7(2):249–265. doi: 10.1016/j.intimp.2006.10.012. [DOI] [PMC free article] [PubMed] [Google Scholar]
- Watanabe S, Deguchi K, et al. Tumor-induced CD11b+Gr-1+ myeloid cells suppress T cell sensitization in tumor-draining lymph nodes. J Immunol. 2008;181(5):3291–3300. doi: 10.4049/jimmunol.181.5.3291. [DOI] [PubMed] [Google Scholar]
- Xin H, Zhang C, et al. Sunitinib inhibition of Stat3 induces renal cell carcinoma tumor cell apoptosis and reduces immunosuppressive cells. Cancer Res. 2009;69 (6):2506–2513. doi: 10.1158/0008-5472.CAN-08-4323. [DOI] [PMC free article] [PubMed] [Google Scholar]
- Yao Q, Nishiuchi R, et al. Human leukemias with mutated FLT3 kinase are synergistically sensitive to FLT3 and Hsp90 inhibitors: the key role of the STAT5 signal transduction pathway. Leukemia. 2005;19(9):1605–1612. doi: 10.1038/sj.leu.2403881. [DOI] [PubMed] [Google Scholar]
- Youn JI, Nagaraj S, et al. Subsets of myeloid-derived suppressor cells in tumor-bearing mice. J Immunol. 2008;181(8):5791–5802. doi: 10.4049/jimmunol.181.8.5791. [DOI] [PMC free article] [PubMed] [Google Scholar]
- Zea AH, Rodriguez PC, et al. Arginase-producing myeloid suppressor cells in renal cell carcinoma patients: a mechanism of tumor evasion. Cancer Res. 2005;65(8):3044–3048. doi: 10.1158/0008-5472.CAN-04-4505. [DOI] [PubMed] [Google Scholar]
- Zhang B, Jia H, et al. Depletion of regulatory T cells facilitates growth of established tumors: a mechanism involving the regulation of myeloid-derived suppressor cells by lipoxin A4. J Immunol. 2010;185(12):7199–7206. doi: 10.4049/jimmunol.1001876. [DOI] [PubMed] [Google Scholar]