Summary
To characterize the function of the sodium/inositol symporter SMIT2 in skeletal muscle, human SMIT2 cDNA was transfected into L6 myoblasts using pcDNA3.1 expression vector. Compared with the pcDNA3.1 vector only transfection, this overexpression increased the uptake of [3H]D-chiro-inositol (DCI) by 159-fold. [3H]myo-Inositol uptake increased by 37-fold. In contrast, [14C]D-glucose, [14C]2-deoxy-D-glucose, or [14C]3-O-methyl-D-glucose uptake remained unchanged in the presence of either 0, 5.5, or 25 mM unlabeled glucose. The Km of DCI and myo-inositol for DCI uptake was 111.0 and 158.0 μM, respectively, whereas glucose competed for DCI uptake with a Ki of 6.1 mM. Insulin treatment of non-transfected L6 cells (2 μM for 24 hours) increased [3H]DCI specific uptake 18-fold. DCI transport is up regulated by insulin and competitively inhibited by millimolar levels of glucose. Therefore, expression and/or function of SMIT2, a high affinity transporter specific for DCI and myo-inositol, may be reduced in diabetes mellitus, insulin resistance and polycystic ovary syndrome causing the abnormal DCI metabolism observed in these conditions.
Keywords: SMIT2, D-chiro-inositol, myo-inositol, insulin resistance, diabetes, PCOS, DCI, glucose, pinitol
Introduction
myo-Inositol (MI) is a well-studied component of inositol phosphate insulin signaling molecules [1–3]. D-chiro-Inositol (DCI), an epimer of MI, is a distinctive inositol that may also mediate insulin bioactivity. Acute administration of DCI lowered plasma glucose concentrations in Streptozotocin (STZ)-diabetic rats and increased glucose utilization in insulin-resistant monkeys [4, 5]. The same acute administration of DCI (10 mg/Kg), but not MI, increased glucose disappearance rates by 50% in STZ-diabetic rats [4]. DCI pretreatment prevented glucosamine-induced reduction in peripheral glucose uptake [6]. More recently, it was shown that DCI, but not MI, increased glucose uptake in L6 myotubes when supplemented at concentrations as low as 0.1 mM [7]. These experiments suggest that DCI is active in muscle.
SMIT2 (SLC5A11), member 11 of solute carrier family 5, sodium/glucose cotransporter, was characterized biochemically in human HepG2 cells by this laboratory [8]. SMIT2 transports MI and DCI with similar affinity for both substrates in HepG2 cells (Km=348 μM) [8]. MI also is transported by the high-affinity SMIT1 transporter [9] and hydrogen-dependent symporter HMIT [10]. SMIT1 does not transport DCI [11]. It is not clear whether or not HMIT transports DCI. However, HMIT is predominately expressed in the brain [10] and thus may not play an important role in muscle DCI transport. SMIT2 was later cloned [11] and shown to be expressed in muscle and other tissues such as kidney, brain, heart, and liver [12].
Several studies have characterized the function of SMIT2 in transporting MI. SMIT2 mediates MI uptake in apical membrane of rat small intestine although SMIT1 is present [13]. SMIT2 also is located in rabbit kidney and is responsible for MI re-absorption [14]. However, functional analysis of SMIT2 in muscle has been lacking. Furthermore, the functional analysis of SMIT2 in transporting DCI has been very limited. Coady at el. injected cRNA for rabbit SMIT2 into Xenopus oocytes and showed with the voltage clamp technique that SMIT2 transports DCI [11].
Metabolism of both MI and DCI is abnormal in diabetes mellitus. Insulin-mimetic fractions isolated from muscle biopsies of Pima Indians with type 2 diabetes mellitus showed reduced DCI [15]. DCI content increased after administration of insulin in normal subjects but not in patients with type 2 diabetes. These results suggest insulin regulation of DCI metabolism under normal conditions but impaired regulation in diabetes. DCI deficiency in diabetes might be due to reduced transport, but direct studies of insulin effects on DCI transport have not been reported.
SMIT2 belongs to the family of sodium/glucose cotransporters, implying glucose transport capability [16]. Previous work with rabbit SMIT2 cRNA injection into Xenopus oocytes shows that SMIT2 transports very little D-glucose (as judged by electric potentials) at a concentration of 1 mM but that some transport is found at 50 mM [11]. By contrast, the same SMIT2 cRNA injection does not increase 3-O-methyl-glucose or 2-deoxy-glucose uptake even at 50 mM [11]. Thus, it remains unclear whether or not SMIT2 transports glucose.
In the present study, by overexpressing human SMIT2 cDNA, we demonstrate that SMIT2 transports DCI as well as MI with similar affinity in L6 myoblasts. In contrast, SMIT2 appears not to contribute to glucose transport in L6 myoblasts. Glucose and pinitol (3-O-methyl-DCI) bind to SMIT2 with lower affinity and compete for inositol transport. Furthermore, the DCI transport pathway in L6 cells appears to be up regulated by insulin, probably modulated through an effect on the SMIT2 transporter. Part of this manuscript has been presented at the Arteriosclerosis, Thrombosis and Vascular Biology Annual Conference of 2008 [17].
Materials and Methods
Materials
DCI (lot 5700003) was obtained from New Zealand Pharmaceuticals. Pinitol was supplied by Humanetics Corporation, Minneapolis, MN. MI (lot 607944) was purchased from Calbiochem. myo-[2-3H]-Inositol (20 Ci/mmoL), [14C]D-glucose (360 mCi/mmoL), [14C]2-deoxy-D-glucose (360 mCi/mmoL), and [14C]3-O-methyl-D-glucose (350 mCi/mmoL) were purchased from American Radiolabeled Chemicals (St. Louis, MO). [3H]DCI was prepared as described previously [8] and repurified with a 3-mL LC-Si SPE column (Supelco) before use. Insulin and BSA were purchased from Sigma.
Expression vectors and transient transfection
Human SMIT2 cDNA was obtained by reverse transcription from PolyA mRNA purified from HepG2 cells. Restriction sites of KpnI and EcoRI were engineered onto the forward primer (5′-AGGTACCGCCACCATGGAGAGCGGCACCAG-3′) and backward primer (5′-GCGCGAATTCCCACACTAAGCAAAATAGCCCCAG-3′), respectively. The cDNA was amplified and subcloned into the pcDNA3.1 expression vector (Invitrogen) after both cDNA and the vector were digested with KpnI and EcoRI, which was designated pcDNA3.1-H-SMIT2. PCR was performed to amplify the EGFP cDNA with NheI (forward primer, 5′-ACCTGCTAGCCACCATGGTGAGCAAGGG -3′) and EcoRI (backward primer, 5′-TGAATTCTTACTTGTACAGCTCGTCCATGCCGAG-3′) designed into the primers using pEGFP-N1 (Clontech) as the template. The EGFP cDNA was subcloned onto NheI and EcoRI sites of pcDNA3.1 after restriction digestion of both cDNA and the vector, which was named pcDNA3.1-EGFP. The identity of both human SMIT2 and EGFP cDNAs was verified by dye-terminator sequencing performed in the Protein and Nucleic Acid Chemistry Laboratory of Washington University.
L6 myoblasts (7.5×10⁵ to each well of 12-well plates) were grown in Dulbecco’s modified Eagle’s medium (DMEM) containing 10.0% fetal bovine serum and 25.0 mM glucose for 48 hours to 70% confluence before transfection or insulin treatment. Transient transfection was then done using Lipofectamine™ 2000 (Invitrogen) according to the manufacturer’s protocol.
Transport assays
All transport assays were performed 24 hours after the start of transfection in uptake buffer (glucose- and MI-deficient DMEM containing 0.1% BSA). Insulin was added to uptake buffer for 24 hours before DCI transport assay. The inositol uptake assay was conducted with 1.2 μCi/mL of [3H]DCI or myo-[2-3H]-inositol with or without unlabeled competitors as indicated in the figures. The inositol assay time was 3.0 hours with untransfected cells and 1.0 hour with overexpression.
Glucose transport (using [14C]D-glucose, [14C]2-deoxy-D-glucose, or [14C]3-O-methyl-D-glucose) was studied in uptake buffer at 0.1 μCi/mL each (0.28 nMol/mL) for 20 minutes in the presence of 0, 5.5, or 25.0 mM unlabeled glucose. Insulin was added in the regular growth medium for 24 hours before glucose uptake assay.
For both inositol and glucose uptake, cells were collected at the end of assay in 0.5 mL of 0.1 N NaOH after washing with cold DPBS six times. Aliquots were taken for BCA protein assay and liquid scintillation counting, both after neutralization with HCl.
Glucose and inositol uptake was expressed as DPM/mg protein. For the determination of insulin effect on DCI uptake, specific uptake was calculated as the difference between uptake observed without the addition of DCI and that supplemented with 10 mM unlabeled DCI.
RT-PCR and real-time quantitative PCR analyses
Total RNA was treated with RNase-free DNase (Promega) after isolation by using Trizol® (Invitrogen) and further purification with RNeasy mini kit (Qiagen). First-strand cDNA was synthesized with iScript™ cDNA Synthesis Kit (Bio-Rad) on total RNA (0.5 μg) in a volume of 20 μL using a mixture of oligo(dT) and random hexamer primers. Aliquots (2.5 μL) of the reverse transcription were then subjected to PCR (50°C for 2 minutes, 95°C for 10 minutes, 95°C for 15 seconds followed by 60°C for 30 seconds for 40 cycles) using gene-specific primers: 5′-TCCCGTCTCTTTGGTACTGG -3′ (forward primer for rat SMIT2), 5′-GACTCCGCTGAACAATCACCT-3′ (backward primer for rat SMIT2); 5′-GCCTCCACAGTTAGATCCCC-3′ (forward primer for human SMIT2), 5′-CAGAACTAGCACCGCGATGT -3′ (backward primer for human SMIT2); and 5′-TGAAGCATACAGGTCCTGGC -3′ (forward primer for rat cyclophilin A), 5′-TGTTTGGTCCAGCATTTGC -3′ (backward primer for rat cyclophilin A). Real-time quantitative PCR analyses were performed with SYBR Green and an iCycler iQ™ Real-Time PCR Detection System from Bio-Rad in a volume of 25 μL, each reaction using iQ™ SYBR Green Supermix (Bio-Rad). Real-time PCR products were electrophoresed on 1.2% agarose gels to verify that the primer pairs amplified a single product of the predicted size. The iCycler iQ™ Detection System software was used to analyze the data, and threshold cycle numbers were calculated. Rat cyclophilin A levels were used as an internal control. An expression value for human SMIT2 and rat SMIT2 relative to rat cyclophilin was calculated by 2−ΔΔCt method [18]. The mRNA levels are presented in arbitrary units where the vector-only transfection was assigned a value of 1.0.
Statistical analyses
Statistical analyses were conducted using SAS (V8.2, SAS Institute, Cary, NC). Comparisons among means of treatments were done using Duncan’s multiple range test or a two-sample t-test whenever it was appropriate. Data are expressed as means ± SEM. Differences between treatment means were designated as being significantly different if P < 0.05 (or otherwise as indicated).
Results
Effects of overexpressing human SMIT2 cDNA in L6 myoblasts on [3H]DCI and [3H]MI uptake
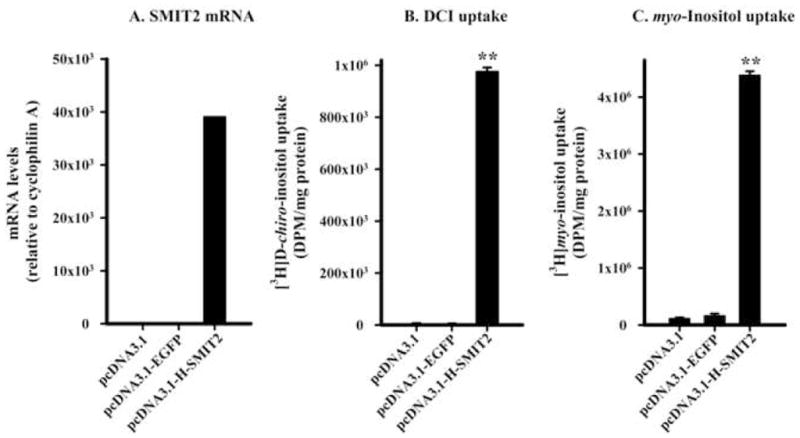
Human SMIT2 cDNA overexpression resulted in a large increase in mRNA level relative to cyclophilin A mRNA in L6 myoblasts compared with the transfection of pcDNA3.1 vector only (Figure 1A). [3H]DCI uptake increased by 159-fold (Figure 1B). Similarly, the overexpression of human SMIT2 cDNA resulted in a 37-fold increase in [3H]MI uptake (Figure 1C). Overexpression of EGFP subcloned in the same expression vector did not increase SMIT2 mRNA level or the uptake of DCI or MI, indicating that the overexpression of human SMIT2 cDNA and its increase in mRNA level were responsible for the significant increase in DCI and MI uptake in L6 myoblasts.
Figure 1. Increases in human SMIT2 mRNA level, [3H]D-chiro-inositol (DCI), and [3H]myo-inositol uptake upon human SMIT2 cDNA overexpression in L6 myoblasts.

Levels of human SMIT2 mRNA and rat cyclophilin A (panel A) on pooled total RNA isolated from cells transfected with pcDNA3.1 (n=4 wells), pcDNA3.1-EGFP (n=4), or pcDNA3.1-H-SMIT2 (n=4) were determined by quantitative real-time PCR as described in Materials and Methods. Uptake of [3H]DCI (B) and [3H]myo-inositol (C) was assayed from individual wells (n=4 for each transfection) as described in Materials and Methods. The level of statistical differences relative to pcDNA3.1 is indicated by **P < 0.01 (for DCI and myo-inositol uptake).
Kinetics of DCI transport in L6 myoblasts
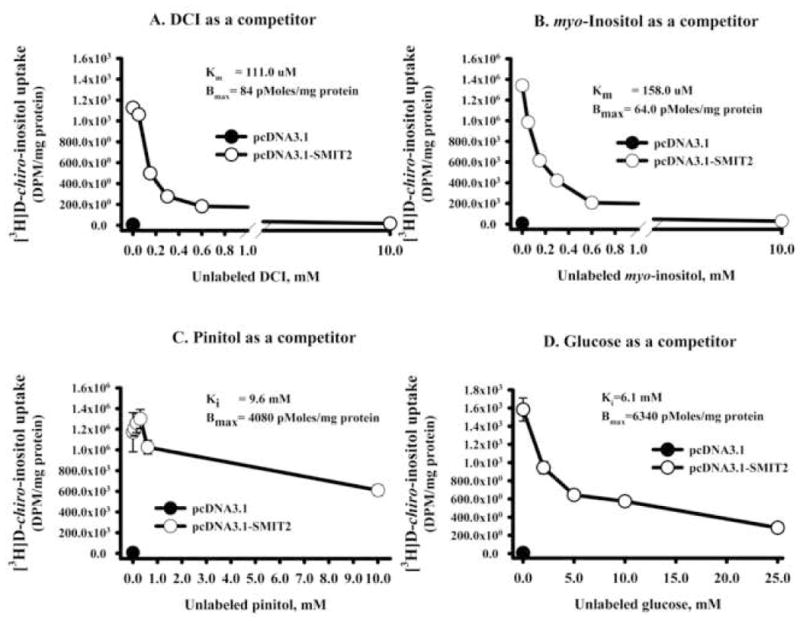
To assess the competition of various inositols and glucose, [3H]DCI uptake was determined with 0 mM or 10 mM unlabeled DCI, MI, or pinitol, and 0 mM or 25 mM glucose using the transfected cells. Both DCI and MI competed equally well for DCI uptake, reducing it by more than 98%. In contrast, pinitol at 10 mM or glucose at 25 mM did not compete as well, decreasing DCI uptake only by 37.6% and 77.3%, respectively.
To further quantitate the kinetics, [3H]DCI uptake was performed in transfected cells at various concentrations of competitors. Specific binding was calculated as total binding minus binding in cells transfected with pcDNA3.1 vector only. The computed Km for DCI (Figure 2A) and MI (Figure 2B) and the Ki for pinitol (Figure 2C) and glucose (Figure 2D) were 110 μM, 158 μM, 9.6 mM, and 6.1 mM, respectively, with maximum binding capacities of 84.0, 64.0, 4080, and 6340 pMoles/mg protein. These results indicate that SMIT2 was a high affinity transporter for DCI and MI. In contrast, pinitol and glucose bind to SMIT2 with a relatively low affinity.
Figure 2. Kinetics of [3H]D-chiro-inositol (DCI) upon human SMIT2 overexpression.

L6 myoblasts transfected with pcDNA3.1-H-SMIT2 were incubated for 1 hour in uptake buffer containing 1.2 μCi/mL tracer and various concentrations of unlabeled DCI, myo-inositol, pinitol, or glucose. No unlabeled competitor was added to cells transfected with pcDNA3.1 only and this uptake (shown by the closed circle) was subtracted as the endogenous uptake from those transfected with pcDNA3.1-H-SMIT2. Displacement of tracer by unlabeled DCI (panel A), myo-inositol (B), pinitol (C), and glucose (D) is shown. Points represent the mean and standard error of the mean (n=4 wells each). Km (for DCI and myo-inositol) or Ki (for pinitol or glucose) and maximum binding were calculated from Eadie-Hofstee plot of the data (plot not shown).
Effects of human SMIT2 cDNA overexpression on glucose uptake in L6 myoblasts
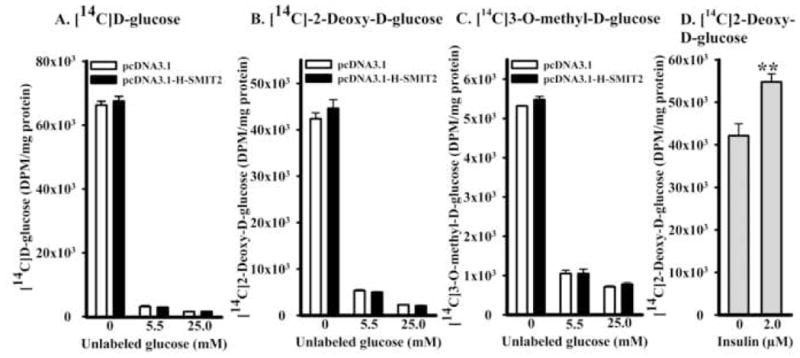
Next, we determined whether SMIT2 also transported glucose in L6 myoblasts. Glucose transport was first determined in the absence of unlabeled glucose in L6 myoblasts transfected with pcDNA3.1 or pcDNA3.1-H-SMIT2, using [14C]D-glucose, [14C]2-deoxy-D-glucose, or [14C]3-O-methyl-D-glucose as tracers. Consistently, human SMIT2 transfection did not enhance glucose uptake (Figure 3A, 3B, and 3C). Since glucose binds to SMIT2 with a relatively low affinity, we determined the effect on the same three tracers in the presence of 5.5 or 25 mM unlabeled glucose. Again, overexpression of human SMIT2 cDNA did not alter uptake of either tracer.
Figure 3. Effects of human SMIT2 cDNA overexpression on glucose uptake.

Uptake of [14C]D-glucose (panel A), 2-deoxy-D-glucose (B), and 3-O-methyl-D-glucose (C) was determined in L6 myoblasts transfected with pcDNA3.1 or pcDNA3.1-H-SMIT2 in the presence of either 0, 5.5 or 25 mM unlabeled glucose. The uptake of [14C]2-deoxy-D-glucose also was determined in non-transfected L6 myoblasts treated with or without 2 μM insulin for 24 hours as a positive control of glucose uptake (D). The level of statistical differences of insulin effect on 2-deoxy-D-glucose uptake is indicated by **P < 0.01.
On the other hand, insulin at 2 μM significantly increased [14C]2-deoxy-D-glucose uptake in non-transfected L6 myoblasts by 29.9 ± 0.11% (Figure 3D). The effect of insulin on [14C]2-deoxy-D-glucose uptake thus acted as a positive control for the investigation of SMIT2 overexpression on glucose uptake in L6 myoblasts.
Effects of insulin on DCI transport
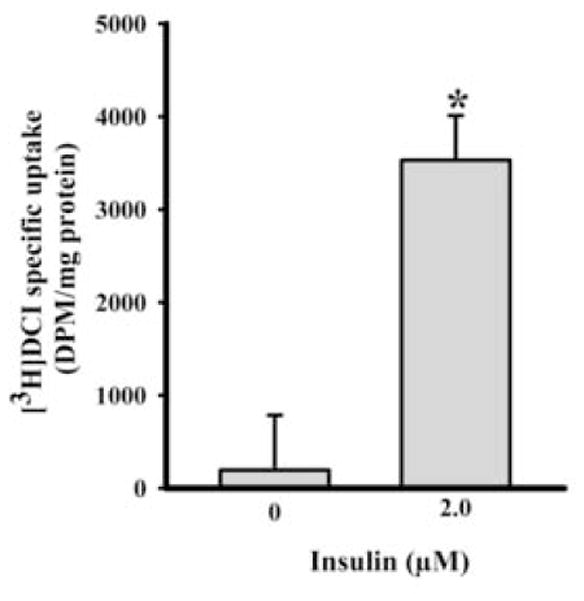
Finally, we tested whether insulin regulated DCI transport in L6 myoblasts. L6 myoblasts were pre-treated with or without 2 μM insulin in uptake buffer containing 0.5% serum for 24 hours. [3H]DCI was then added in uptake buffer for 3 hours. Insulin increased specific [3H]DCI transport 18-fold (Figure 4).
Figure 4. Effects of insulin on [3H]D-chiro-inositol (DCI) specific uptake.

Insulin (0 or 2 μM) was supplemented in uptake buffer with 0.5% fetal bovine serum for 24 hours. Then [3H]DCI uptake was assayed for 3 hours at 37°C in the presence and absence of 10 mM unlabeled DCI. Specific [3H]DCI uptake was calculated as uptake difference between 10 mM unlabeled DCI and no such supplementation. The level of statistical differences is indicated by *P < 0.05.
Discussion
Inositol transport is likely to be important in understanding diabetes and the mechanisms involved in insulin action. The study of DCI transport in HepG2 cells initially resulted in the description of a single kinetic pathway that carried both DCI and MI [8]. The transporter was found to be sodium-dependent and inhibited by phlorizin. Coady and collaborators then studied an orphan from the SLC5 family of sodium-dependent sugar transporters that bore some homology to SMIT1, the sodium-dependent MI transporter [11, 19]. SMIT2 has been well characterized in transporting MI [13, 14]. However, functional analysis of SMIT2 in muscle is lacking. Furthermore, functional analysis of SMIT2 in transporting DCI has been limited to the use of cRNA Injection System in Xenopus oocytes with voltage clamp technique [11]. In this work we have expressed human SMIT2 cDNA in rat L6 skeletal muscle cells and demonstrated that it transports MI and DCI, but not glucose. The DCI transport pathway is competed by glucose and stimulated by insulin.
Endogenous rat SMIT2 was expressed in L6 cells and transported MI and DCI (data not shown). Furthermore, when transfected into L6 cells, human SMIT2 cDNA resulted in a 159-fold increase in [3H]DCI uptake when compared with pcDNA3.1 vector only transfection (Figure 1B). Consistent with previous functional data in other tissue types, overexpression of human SMIT2 cDNA also led to a 37-fold increase in [3H]MI uptake in skeletal muscle cells (Figure 1C). The smaller increase in [3H]MI uptake may be due to the natural abundance of SMIT1 in L6 cells, which transports MI but not DCI [11]. The relative contribution by SMIT1 vs. SMIT2 to the transport of MI remains to be determined. Kinetic studies demonstrated a similar Km for DCI (110.0 μM, Figure 2A) and MI (158.0 μM, Figure 2B). However, Ki values for pinitol (9.6 mM, Figure 2C) and glucose (6.1 mM, Figure 2D) were much higher.
SMIT2, related to the family of sodium-dependent glucose transporters including SGLT1, has been postulated to be a low-affinity glucose transporter [20]. However, SMIT2 does not appear to be quantitatively important for glucose transport in L6 cells. Glucose transport measured either with labeled glucose or with glucose analogs was not affected by SMIT2 transfection in the absence of unlabeled glucose (Figure 3). However, unlabeled glucose did compete for [3H]DCI uptake (Figure 2D). Previous work with rabbit SMIT2 cRNA injection into Xenopus oocytes showed that SMIT2 transported very little D-glucose (as judged by electric potentials) at a concentration of 1 mM but that some transport was found at 50 mM [11]. By contrast, the same SMIT2 cRNA injection did not increase 3-O-methyl-glucose or 2-deoxy-glucose uptake even at 50 mM. Since SMIT2 binds to glucose with low affinity, it may transport glucose at a higher concentration. Nonetheless, the overexpression of human SMIT2 in the current study did not increase the uptake of any of the three tracers in the presence of 5.5 or 25 mM unlabeled glucose. Since glucose is transported by several other molecules, it is possible that the additional transport due to SMIT2 overexpression is difficult to measure. Alternatively, glucose may compete for SMIT2 sites at the cell surface but without being internalized. Our results suggest that SMIT2 functions as an inositol rather than as a glucose transporter. Recent results also argue against the participation of SMIT2 in glucose uptake in the small intestine [13].
DCI transport appears to be up regulated by insulin. Short-term insulin administration to humans increased muscle DCI content in normal subjects but not in those with type 2 diabetes mellitus [15]. This could have been due to increased insulin-dependent DCI synthesis, reduced tissue metabolism or efflux, or increased inflow. These pathways have not been extensively studied, but some data supported DCI synthesis through conversion from MI [21]. Our work here supports the mechanism of increased DCI inflow into muscle, probably through SMIT2. In vitro, [3H]DCI specific transport increased 18-fold in L6 cells after treatment with insulin (Figure 4). Previous clinical studies also favored an effect of insulin on DCI transport in the kidney. In type 2 diabetics there was a significant direct correlation between endogenous plasma insulin level (a measure of insulin resistance) and renal DCI clearance [22]. Furthermore, prolonged treatment with insulin resulted in increased renal DCI reabsorption [22]. Our work suggests that these results might have been due in part to a direct effect of insulin on SMIT2.
Diabetes mellitus is associated with elevated glucose as well as disorders of insulin metabolism. It was demonstrated that excretion and clearance of DCI were positively correlated with plasma glucose (r=0.568) [22]. Reduced renal tubular reabsorption of DCI appeared to account for much of the effect. Glucose directly competes with DCI transport through SMIT2 with a Ki of 6.1 mM (Figure 2D). This is above the normal upper limit of 5.6 mM for fasting glucose and less than the glucose values of up to 25 mM that may be observed in uncontrolled diabetic outpatients. Thus, we suggest that reduced inositol transport through SMIT2 could be due in part to hyperglycemia.
Taken together with previous clinical studies in diabetic patients and women with polycystic ovary syndrome, our results suggest that SMIT2 expression and function – measurable by DCI transport – may be a marker for the effects of insulin or glucose or both. In addition, intracellular deficiency of the inositols transported by SMIT2 may contribute directly to the altered metabolism and complications of diabetes and insulin resistance. Further work is needed to assess the regulation and physiological significance of inositol transport in normal and disease states.
Acknowledgments
The work was supported by NIH grants R01 DK58698, P30 DK56341 and P60 DK 20579.
Footnotes
Publisher's Disclaimer: This is a PDF file of an unedited manuscript that has been accepted for publication. As a service to our customers we are providing this early version of the manuscript. The manuscript will undergo copyediting, typesetting, and review of the resulting proof before it is published in its final citable form. Please note that during the production process errors may be discovered which could affect the content, and all legal disclaimers that apply to the journal pertain.
References
- 1.Larner J, Galasko G, Cheng K, DePaoli-Roach AA, Huang L, Daggy P, Kellogg J. Science. 1979;206:1408–1410. doi: 10.1126/science.228395. [DOI] [PubMed] [Google Scholar]
- 2.Thompson MP, Larner J, Kilpatrick DL. Mol Cell Biochem. 1984;62:67–75. doi: 10.1007/BF00230079. [DOI] [PubMed] [Google Scholar]
- 3.Malchoff CD, Huang L, Gillespie N, Palasi CV, Schwartz CF, Cheng K, Hewlett EL, Larner J. Endocrinology. 1987;120:1327–1337. doi: 10.1210/endo-120-4-1327. [DOI] [PubMed] [Google Scholar]
- 4.Ortmeyer HK, Huang LC, Zhang L, Hansen BC, Larner J. Endocrinology. 1993;132:646–651. doi: 10.1210/endo.132.2.8425484. [DOI] [PubMed] [Google Scholar]
- 5.Ortmeyer HK, Larner J, Hansen BC. Obes Res. 1995;3(Suppl 4):605S–608S. doi: 10.1002/j.1550-8528.1995.tb00232.x. [DOI] [PubMed] [Google Scholar]
- 6.Yoshino K, Takeda N, Sugimoto M, Nakashima K, Okumura S, Hattori J, Sasaki A, Kawachi S, Takami K, Takami R, Yasuda K. Metabolism. 1999;48:1418–1423. doi: 10.1016/s0026-0495(99)90153-1. [DOI] [PubMed] [Google Scholar]
- 7.Yap A, Nishiumi S, Yoshida K, Ashida H. Cytotechnology. 2007;55:103–108. doi: 10.1007/s10616-007-9107-y. [DOI] [PMC free article] [PubMed] [Google Scholar]
- 8.Ostlund RE, Jr, Seemayer R, Gupta S, Kimmel R, Ostlund EL, Sherman WR. J Biol Chem. 1996;271:10073–10078. doi: 10.1074/jbc.271.17.10073. [DOI] [PubMed] [Google Scholar]
- 9.van Calker D, Belmaker RH. Bipolar Disord. 2000;2:102–107. doi: 10.1034/j.1399-5618.2000.020203.x. [DOI] [PubMed] [Google Scholar]
- 10.Uldry M, Ibberson M, Horisberger JD, Chatton JY, Riederer BM, Thorens B. EMBO J. 2001;20:4467–4477. doi: 10.1093/emboj/20.16.4467. [DOI] [PMC free article] [PubMed] [Google Scholar]
- 11.Coady MJ, Wallendorff B, Gagnon DG, Lapointe JY. J Biol Chem. 2002;277:35219–35224. doi: 10.1074/jbc.M204321200. [DOI] [PubMed] [Google Scholar]
- 12.Roll P, Massacrier A, Pereira S, Robaglia-Schlupp A, Cau P, Szepetowski P. Gene. 2002;285:141–148. doi: 10.1016/s0378-1119(02)00416-x. [DOI] [PubMed] [Google Scholar]
- 13.Aouameur R, Da Cal S, Bissonnette P, Coady MJ, Lapointe JY. Am J Physiol Gastrointest Liver Physiol. 2007;293:G1300–1307. doi: 10.1152/ajpgi.00422.2007. [DOI] [PubMed] [Google Scholar]
- 14.Lahjouji K, Aouameur R, Bissonnette P, Coady MJ, Bichet DG, Lapointe JY. Biochim Biophys Acta. 2007;1768:1154–1159. doi: 10.1016/j.bbamem.2007.01.007. [DOI] [PubMed] [Google Scholar]
- 15.Kennington AS, Hill CR, Craig J, Bogardus C, Raz I, Ortmeyer HK, Hansen BC, Romero G, Larner J. N Engl J Med. 1990;323:373–378. doi: 10.1056/NEJM199008093230603. [DOI] [PubMed] [Google Scholar]
- 16.HUGO Gene Nomenclature Committee at the European Bioinformatics Institute.
- 17.Lin X, Ma L, Ostlund RE. Arterioscler Thromb Vasc Biol. 2008;28:e-67. (Abstract) [Google Scholar]
- 18.Livak KJ, Schmittgen TD. Methods. 2001;25:402–408. doi: 10.1006/meth.2001.1262. [DOI] [PubMed] [Google Scholar]
- 19.Bourgeois F, Coady MJ, Lapointe JY. J Physiol. 2005;563:333–343. doi: 10.1113/jphysiol.2004.076679. [DOI] [PMC free article] [PubMed] [Google Scholar]
- 20.Wright EM, Hirayama BA, Loo DF. J Intern Med. 2007;261:32–43. doi: 10.1111/j.1365-2796.2006.01746.x. [DOI] [PubMed] [Google Scholar]
- 21.Pak Y, Huang LC, Lilley KJ, Larner J. J Biol Chem. 1992;267:16904–16910. [PubMed] [Google Scholar]
- 22.Ostlund RE, Jr, McGill JB, Herskowitz I, Kipnis DM, Santiago JV, Sherman WR. Proc Natl Acad Sci U S A. 1993;90:9988–9992. doi: 10.1073/pnas.90.21.9988. [DOI] [PMC free article] [PubMed] [Google Scholar]


