

Abstract
Background
To determine the influence of lifting speed and type on peak and cumulative back compressive force (BCF) and shoulder moment (SM) loads during symmetric lifting. Another aim of the study was to compare static and dynamic lifting models.
Methods
Ten male participants performed a floor-to-shoulder, floor-to-waist, and waist-to-shoulder lift at three different speeds [slow (0.34 m/s), medium (0.44 m/s), and fast (0.64 m/s)], and with two different loads [light (2.25 kg) and heavy (9 kg)]. Two-dimensional kinematics and kinetics were determined. A three-way repeated measures analysis of variance was used to calculate peak and cumulative loading of BCF and SM for light and heavy loads.
Results
Peak BCF was significantly different between slow and fast lifting speeds (p < 0.001), with a mean difference of 20% between fast and slow lifts. The cumulative loading of BCF and SM was significantly different between fast and slow lifting speeds (p < 0.001), with mean differences ≥80%.
Conclusion
Based on peak values, BCF is highest for fast speeds, but the BCF cumulative loading is highest for slow speeds, with the largest difference between fast and slow lifts. This may imply that a slow lifting speed is at least as hazardous as a fast lifting speed. It is important to consider the duration of lift when determining risks for back and shoulder injuries due to lifting and that peak values alone are likely not sufficient.
Keywords: back, lifting, speed, shoulder
1. Introduction
The lifetime prevalence rate of low back pain (LBP) has been estimated to be between 60% and 80%, implying that over half of the general population will have LBP at some point during their lives. The LBP has a high price tag, estimated at billions of dollars annually. Manual material handling (MMH) is considered a task associated with LBP [1].
A survey of 1221 men in the age group of 18–55 years was conducted to determine their history of LBP. Approximately 70% of the respondents had experienced either moderate or severe LBP at some point during their lives. The researchers reported that repetitive heavy lifting in the workplace was a risk factor for LBP [2].
In another study, researchers evaluated over 400 repetitive MMH jobs. They found that the load moment was one of the five workplace factors that distinguished high- from low-risk jobs, based on their model [3].
Compressive forces have been used to assess spinal loading during MMH tasks, especially those at the L5/S1 interface [4]. Numerous researchers have found dynamic calculations to be superior to corresponding static calculations for predicting back compressive forces (BCFs) [5–7]. Static calculations at any speed would yield identical results for BCFs if postures were the same. Dynamic BCF calculations would differ if the speed of the MMH task was different, due to the dissimilar accelerations and decelerations of the load, even if postures were the same between lifts.
Although the effect of cumulative and peak loading in increasing the risk of LBP remains unclear, various models have been suggested to address the need for a model to recognize differences in loading patterns and musculoskeletal injury risk [8–10].
Results of several studies indicate that peak moment about the lower back increases with lifting speed [4,11–13]. In one study it was found that peak low BCF increases [14], whereas in another study, peak and average moment and peak and average axial force at the lower back was shown to be increased [15]. Interestingly, results of another study [16] indicated that the total absolute muscle work actually decreased with higher lifting speed. It is unclear whether any of these aforementioned studies investigated the effect of all three of the variables included in this study, namely, (1) lift speed, (2), lift type/location, and (3) load lifted, according to the specific task definitions used in this study.
Shoulder musculoskeletal disorders (MSDs) are also of concern among those with MMH jobs. In a previous study, shoulder MSDs in nurses were examined. Researchers found that over 70% of those who reported an MSD reported MSD at the shoulder. In addition, work place risk factors for nurses were manually handling patients and undertaking physically laborious work [17].
A major purpose of this investigation was to determine and analyze the impact of lifting speed and lift type on peak and cumulative BCF and shoulder moment (SM) loads during symmetric lifting. Another purpose was to investigate differences between the static and dynamic models used for computing these loads.
2. Materials and methods
2.1. Participants
The study population included 10 adult male participants with a mean [± standard deviation (SD)] age of 27.5 (±4.1) years, height of 175.6 (±5.6) cm, and weight of 73.8 (±9.3) kg. All the participants were free from injuries or other disorders that would affect their ability to perform the lifting tasks. Each participant signed a consent document before participating in the study, which provided information about the study methods as well as possible risks of participation. The University of Utah's Institutional Review Board approved this study protocol (IRB: 00013692).
2.2. Data acquisition
Reflective markers were attached unilaterally on the left side of a participant at the following locations: head, acromion process, lateral epicondyle of the humerus (elbow joint), distal radius (wrist joint), center of the hand, sacrum, greater trochanter, femoral condyle, malleolus, calcaneus, and metatarsal head. Two-dimensional motion data were captured with a GS-55 digital camcorder (Panasonic). A six-axis AMTI force plate (Advanced Mechanical Technologies Inc., Watertown, MA, USA) recorded the ground reaction force and moment data. The Vicon Motus (Vicon, Centennial, CO, USA) software was used to obtain and process camera and force plate data.
Three independent variables were used for the lifting conditions, namely, hand load (2.25 and 9 kg), lift type [floor to waist (FW), waist to shoulder (WS), and floor to shoulder (FS)], and lift speed (fast, medium, and slow). In total, each participant performed three cycles of all 18 symmetric lifting conditions, consisting of a combination of the three lifting variables. Fig. 1 shows the vertical dimensions for each lift type, with the uppermost shelf at shoulder height and the middle shelf at waist height.
Fig. 1.
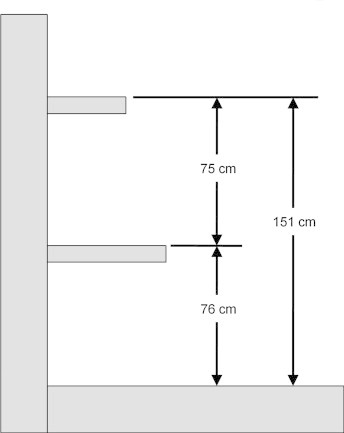
Vertical shelf locations for each lift type.
Lifting speed was controlled using a metronome. For each lifting condition, the participant would begin lifting at the speed indicated by the metronome. Researchers began recording data when the lifting speed and metronome speed were closely matched. Data collection continued for several cycles. The lift conditions are shown in Table 1.
Table 1.
Lift conditions
| Speed |
L = 2.25kg load |
H = 9kg load |
||||
|---|---|---|---|---|---|---|
| FW | WS | FS | FW | WS | FS | |
| S (Slow) | S, L, FW | S, L, WS | S, L, FS | S, H, FW | S, H, WS | S, H, FS |
| M (Medium) | M, L, FW | M, L, WS | M, L, FS | M, H, FW | M, H, WS | M, H, FS |
| F (Fast) | F, L, FW | F, L, WS | F, L, FS | F, H, FW | F, H, WS | F, H, FS |
A total of 18 conditions were used.
FS, floor-to-shoulder; FW, Lift types of floor-to-waist; WS, waist-to-shoulder.
2.3. Data analysis
Vicon Motus was used to process the motion and force plate data to calculate kinematics and kinetics. Centers of mass and locations of centers of mass were estimated based on anthropometric data [18]. Additional joint and muscle locations were estimated from previously published study results [19,20]. The start and end of each lift cycle were identified within each lifting trial. Three lift cycles were averaged to comprise a composite lifting cycle for every lifting condition. The composite lift cycle was normalized to 201 data points, which allowed for direct comparisons between the lifts performed at different speeds.
Forces and moments of interest were calculated using both static and dynamic equations to evaluate the effects of lifting speed on forces and moments at the shoulder and back. The following equations were used to calculate the static and dynamic BCFs based on motion and force data:
| (1) |
| (2) |
where L is the load in the hands, g is gravity, aL is the acceleration of the hands, aT is the acceleration of the trunk, mUB is the mass of the upper body, and MF is the erector spinae muscle force. The differences between the static and dynamic calculations are that the acceleration terms for each mass are accounted for in the dynamic equations, but are not included in the static equations. The influence from Coriolis acceleration is neglected. MF is calculated using the following formula:
| (3) |
where ML5S1 is the sum of the moments about the L5/S1 interface and DES is the perpendicular distance from the L5/S1 interface to the erector spinae muscle group. Static and dynamic equations for the SM are as follows:
| (4) |
| (5) |
where DL-S, DUA-S, and DLA-S are the distances from the shoulder to the load, to the upper arm center of mass, and to the lower arm center of mass, respectively. The masses of the upper and lower arms are mUA and mLA with accelerations of aUA and aLA, respectively.
The authors' technique for comparing results between participants is unique, in that the BCF values were normalized by body mass and the SM values were normalized by body mass and height. Normalization techniques are often used in gait analysis kinetics [21–23] and seem reasonable for making direct comparisons between individuals with different anthropometry for evaluating lifting tasks.
The cumulative load for a given variable was defined as the area under the curve for the duration of the lift cycle. The cumulative load was calculated for both BCF and SM by multiplying the average over the lift cycle by the total duration of the lift cycle.
Mean differences were calculated as follows:
| (6) |
where X1 is the mean value of either BCF or SM at a certain speed or lift type and X2 is the mean BCF or SM value for a different speed or lift type that is to be compared with X1.
2.4. Statistical analysis
The focus of the statistical analysis was on the peak and cumulative loads of BCFs and SMs. Statistical analyses were performed using SPSS (SPSS Inc., Chicago, IL, USA). Part of a three-way repeated measures analysis of variance (RM-ANOVA) analyzed the difference between static and dynamic measures for assessing peak and cumulative BCF and SM. In addition, RM-ANOVA was used to perform a comparative analysis between lift types and speeds. The RM-ANOVA was run for both light and heavy hand-load conditions. Paired comparisons were made with adjustments for multiple comparisons using the Bonferroni method. If the assumption of sphericity was violated based on Mauchly's test, the Greenhouse–Geisser correction was used. The results were considered statistically significant when p < 0.05 (α = 0.05). The differences in BCF and SM loads, based on hand load, were not statistically analyzed, but the results are reported and shown for completeness.
3. Results
Participants performed a set of three cycles for all 18 lifting conditions. This resulted in mean (±SD) velocities of 0.64 (±0.17), 0.44 (± 0.13), and 0.34 (± 0.07) m/s for fast, medium, and slow lifts, respectively.
3.1. Static versus dynamic
Dynamic calculations were 16% and 5% higher than static calculations (p < 0.001) for peak BCF and peak SM, respectively. For the BCF and SM cumulative loading, there was a difference of less than 1% and 2%, respectively, between static and dynamic calculations (p < 0.001).
Fig. 2 illustrates the difference between static and dynamic calculations for a fast lift. The dynamic calculation for BCF shows a local maximum near the beginning of the lift due to initial acceleration of the load, much higher than the static calculation. A local minimum follows shortly after the maximum and drops below the static calculation. Once deceleration and additional control are warranted for object placement, the static and dynamic calculations are nearly the same. A similar pattern is seen for the static and dynamic SM calculations.
Fig. 2.
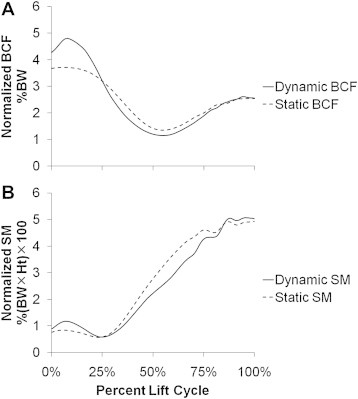
(A) Average static versus dynamic back compressive force for floor-to-shoulder lift at fast speed with high weight. (B) Average static versus dynamic shoulder moment. BCF, back compressive force; BW, body weight; Ht, height; SM, shoulder moment.
3.2. Lifting speed
Based on paired comparisons, peak BCF was significantly different between fast and slow lift speeds (p < 0.01), whereas peak SM was not significantly different. Both BCF and SM cumulative loads were significantly different between fast and slow speeds (p < 0.001). This was true for both light and heavy hand loads. Fig. 3 depicts the means of the dynamic calculations for peak and cumulative loading of BCF and SM. The error bars in the figure represent the standard error of the mean.
Fig. 3.
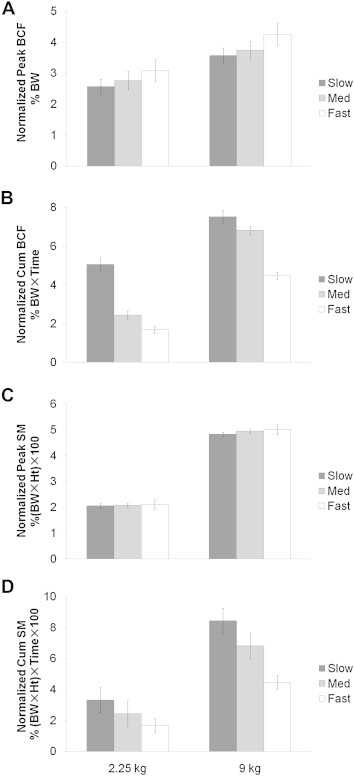
(A) Peak dynamic back compressive force (BCF), (B) cumulative dynamic BCF, (C) peak dynamic shoulder moment (SM), and (D) cumulative dynamic SM at three lifting speeds with two different hand loads. BW, body weight; Ht, height.
Table 2 is a summary of the mean differences between fast and slow lifting speeds for the variables in the previous figure. The values in Table 2 are positive if the fast lifting speed resulted in greater values than the slow lifting speed. Conversely, if the values are negative, slow lifting speeds produced greater values than the fast lifting speed.
Table 2.
Mean differences between fast and slow lift speeds
| Hand load (kg) | BCF |
SM |
||
|---|---|---|---|---|
| Peak | Cumulative load | Peak | Cumulative load | |
| 2.25 | 17.6%* | −56.7%* | 3.60% | −66.0%* |
| 9 | 18.3%* | −58.2%* | 2.70% | −61.6%* |
Positive mean differences indicate that fast lifting speed produced greater values than slow lifting speed; negative values indicate slow lifting speeds produced greater values than fast speed.
*Significant difference between fast and slow speeds (p < 0.001).
BCF, back compressive force; SM, shoulder moment.
3.3. Lift type
Based on paired comparisons, BCF peak and cumulative loading were significantly different between WS and other lift types (p < 0.001), with WS having smaller values. For SM, peak and cumulative load values were significantly lower for FW lifts than for FS and WS lifts (p < 0.001), as depicted in Fig. 4. These findings were true for both light and heavy hand loads. Absolute mean differences are shown in Table 3.
Fig. 4.
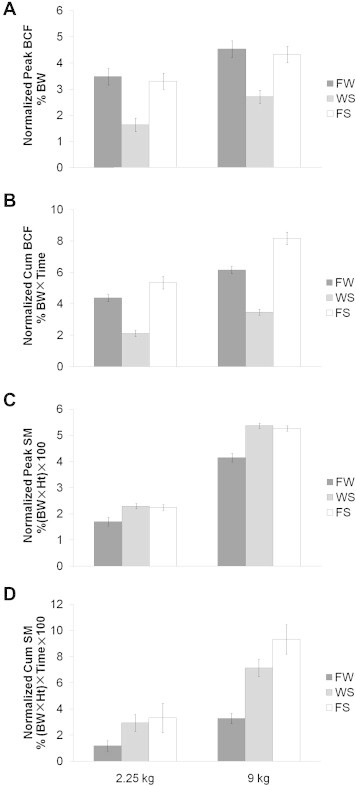
(A) Peak dynamic back compressive force (BCF), (B) cumulative dynamic BCF, (C) peak dynamic shoulder moment (SM), and (D) cumulative dynamic SM for three lift types with two different hand loads. BW, body weight; FS, floor to shoulder; FW, floor to waist; Ht, height; WS, waist to shoulder.
Table 3.
Absolute mean differences between lift types
| Hand load (kg) | FW–WS |
FW–FS |
WS–FS |
||||
|---|---|---|---|---|---|---|---|
| Peak | Cumulative load | Peak | Cumulative load | Peak | Cumulative load | ||
| BCF | 2.25 | 72.7%* | 69.7%* | 5.30% | 20.1%† | 68.0%* | 86.8%* |
| BCF | 9 | 50.6%* | 55.8%* | 4.6%† | 28.1%† | 46.3%* | 80.7%* |
| SM | 2.25 | 29.8%* | 85.6%* | 27.7%* | 95.1%* | 2.20% | 11.90% |
| SM | 9 | 25.7%* | 74.1%* | 23.8%* | 96.0%* | 1.90% | 26.60% |
*Significant difference (p < 0.001).
†Significant difference (p < 0.01).
BCF, back compressive force; FS, floor to shoulder; FW, floor to waist; SM, shoulder moment; WS, waist to shoulder.
3.4. Load
Peak and cumulative BCF and SM loads were higher for the 9-kg, heavy, hand-load condition than the 2.25-kg, light, hand-load condition in all cases for every participant.
4. Discussion
This research indicates that dynamic calculations of peak loading during lifting tasks account for the existing forces and those which are not captured using static models alone. Dynamic calculations take the speed of lift into account unlike the static calculations. This finding confirms the results of other studies that have used dynamic calculations to determine peak loading [5–7]. However, the results of this study show that if cumulative loading is the only desired output, static calculations would be a good approximation for the dynamic loading of the lifting task. There was a difference of less than 2% for both BCF and SM calculations between the static and dynamic cumulative loads.
Results suggest that the analysis of parameters of interest plays an important role in predicting risk during lifting [20]. Using BCF as the parameter of interest and examining risk using peak value, it is clear that the slow lifting speed is preferable to the fast lifting speed because the peak BCF value is approximately 18% lower on average than the fast speed. It has been reported that BCF at a slow lifting speed was different from other lifting speeds [24] and also that the L5/S1 moment increased as the lifting speed increased [25]. The L5/S1 moment is proportional to the BCF, and so the results of this study confirm the results of other studies. It has also been suggested that excessive speed of lifting should be avoided [13]. Based on peak BCF alone, this is a proper suggestion. However, the mean difference between peak values at fast and slow speeds for the SM values in this study is minimal (less than 4% difference).
Conversely, the study results indicate that based on impulse, a slow lifting speed may be more hazardous than a fast speed for both BCF and SM. The cumulative loading values are much greater at the slow lifting speed than the fast speed due to the longer lifting duration. The values for BCF and SM are near or exceed 60% mean difference between fast and slow speeds. If this were the only way to measure risk, it would appear that the risk for a slow lift would be twice than that of a fast lift.
A notable finding of this study is that the mean difference, based on cumulative load, between fast and slow speeds was approximately three-and-a-half times greater than the mean difference based on peak values for BCF. This might imply that, as a whole, a fast speed is less hazardous than a slow speed. This notion supports the suggestion that faster lifting of heavy objects would reduce the exposure time and would likely be less hazardous than slow lifting [26].
However, the optimum lifting speed may be a medium speed; peak values are lower than a fast lifting speed and cumulative loading values are lower than a slow lifting speed. This medium lifting speed could be thought of as a “natural” lifting speed. Another option is to alter the speed of lift during the lift cycle. Because BCF peaks toward the beginning of a lift, it is likely beneficial to start slowly and avoid jerky movements when beginning a lift. As the lift progresses, the speed of lift could then be increased to reduce the total lift duration. This may also be an acceptable method to mitigate peak forces while limiting the cumulative load exposure during a lift.
Both FW and FS lifts have BCF peak and cumulative loading values that exceed the WS values by approximately 50%. In terms of BCF, the WS lift appears to have less risk than the floor lifts. In terms of SM, FW lifts appear to be the least hazardous lift types studied, with the values being lower for both peak and cumulative loads. The FS and WS lift types required participants to perform a shoulder lift, where the upper arm was extended. It would be advisable to eliminate floor lifts wherever possible to decrease both the peak BCF and the lift duration. In addition, it would not be advisable to lift a load above the shoulders, which can greatly increase the peak and cumulative SM values. Overall, FS lifts pose the greatest overall risks when compared with FW and WS lifts. The FS lifts should be re-designed to allow for a higher start of lift and a lower end of lift to reduce peak forces and moments and to decrease the lift duration. In all cases and for every participant, greater hand loads resulted in higher BCF and SM loads. Practical and statistical significance is implied between the light and heavy hand loads by examining the average values and error bars shown in Figs. 3 and 4.
Various assessment methods exist to account for both peak and cumulative BCF to determine risk for each lift cycle [8]. Additional methods should be developed and compared with epidemiological data to determine the best assessment method to evaluate risk in terms of the individual lift cycle. A better assessment of an individual lift cycle would lead to better determination of risk for a job that includes multiple lifts. This assessment should use dynamic measures rather than static measures.
It might be possible to predict BCF and SM peak and cumulative load values based on the BCF and SM values at the beginning and end of lift as well as the lift duration and lift type. Using such prediction equations would allow researchers to assess the risk for a lift cycle quickly rather than assessing the whole lift cycle to obtain an accurate evaluation of risk [27].
In addition, lifting speed should be incorporated into current, widely available models that predict the BCF and SM values or the risk of the lift. These models include the NIOSH revised lifting equation, the Snook Liberty Tables, Michigan's Three-Dimensional Static Strength Prediction Program, and the Utah Back Compressive Force model.
After five participants had participated in the study, a “stop” was added to the shelves to help researchers identify the end of the lift cycle for the remaining five participants. This should also make the starting location of the hand load consistent for the WS lift.
Slow, medium, and fast speeds were controlled by allowing participants to adjust to a metronome. Although the participants aimed to match the metronome, small errors still occurred. Additional errors occurred due to adjustments during the lift cycle as participants slowed down toward the end of a lift to try and make a lift longer. As was mentioned previously, researchers tried to minimize this speed error by allowing participants to lift a number of cycles until they became accustomed to that speed before collecting data.
Motion-collection techniques using cameras and reflective markers are subject to small errors resulting from marker placement, skin motion, and camera resolution. In addition, in this two-dimensional study, a one-sided marker set and only one video camera were used to capture and analyze data, with symmetry assumed. This may have led to additional errors in terms of marker location compared with the actual underlying anthropometric data, and inaccuracies due to minor asymmetry in lifting. Although there may be slight errors in the overall quantification of BCF and SM, the findings related to speed of lift and the use of dynamic calculations hold true, due to the nature of the comparisons and the statistical analysis used.
Conflict of interest
No potential conflict of interest relevant to this article was reported.
Acknowledgments
This work was supported, in part, by the Rocky Mountain Center for Occupational and Environmental Health at the University of Utah. The Rocky Mountain Center, an Education and Research Center, is supported by Training Grant No. T42/OH 008414 from the Centers for Disease Control and Prevention/National Institute for Occupational Safety and Health. The contents are solely the responsibility of the authors and do not necessarily represent the official views of the National Institute for Occupational Safety and Health. The research was conducted in the Ergonomics and Safety Lab at the University of Utah. Many graduate students in the Ergonomics and Safety Lab contributed to the data collection and processing.
Footnotes
This is an Open Access article distributed under the terms of the Creative Commons Attribution Non-Commercial License (http://creativecommons.org/licenses/by-nc/3.0) which permits unrestricted non-commercial use, distribution, and reproduction in any medium, provided the original work is properly cited.
References
- 1.Cole M.H., Grimshaw P.N. Low back pain and lifting: a review of epidemiology and aetiology. Work. 2003;21:173–184. [PubMed] [Google Scholar]
- 2.Frymoyer J.W., Pope M.H., Clements J.H., Wilder D.G., MacPherson B., Ashikaga T. Risk factors in low-back pain. An epidemiological survey. J Bone Joint Surg Am. 1983;65:213–218. doi: 10.2106/00004623-198365020-00010. [DOI] [PubMed] [Google Scholar]
- 3.Marras W.S., Lavender S.A., Leurgans S.E., Rajulu S.L., Allread W.G., Fathallah F.A., Ferguson S.A. The role of dynamic three-dimensional trunk motion in occupationally-related low back disorders. The effects of workplace factors, trunk position, and trunk motion characteristics on risk of injury. Spine (Phila Pa 1976) 1993;18:617–628. doi: 10.1097/00007632-199304000-00015. [DOI] [PubMed] [Google Scholar]
- 4.Gagnon D., Gagnon M. The influence of dynamic factors on triaxial net muscular moments at the L5/S1 joint during asymmetrical lifting and lowering. J Biomech. 1992;25:891–901. doi: 10.1016/0021-9290(92)90229-t. [DOI] [PubMed] [Google Scholar]
- 5.Menzer H.M., Reiser R.F., 2nd Dynamic versus static analyses of lifting a box from the floor. Biomed Sci Instrum. 2005;41:305–310. [PubMed] [Google Scholar]
- 6.Gagnon M., Smyth G. Biomechanical exploration on dynamic modes of lifting. Ergonomics. 1992;35:329–345. doi: 10.1080/00140139208967817. [DOI] [PubMed] [Google Scholar]
- 7.Aghazadeh F., Ayoub M.M. A comparison of dynamic- and static-strength models for prediction of lifting capacity. Ergonomics. 1985;28:1409–1417. doi: 10.1080/00140138508963267. [DOI] [PubMed] [Google Scholar]
- 8.Waters T., Yeung S., Genaidy A., Callaghan J., Barriera-Viruet H., Abdallah S., Kumar S. Cumulative spinal loading exposure methods for manual material handling tasks. Part 2: methodological issues and applicability for use in epidemiological studies. Theor Issues Ergon. 2006;7:131–148. [Google Scholar]
- 9.Kumar S. Cumulative load as a risk factor for back pain. Spine (Phila Pa 1976) 1990;15:1311–1316. doi: 10.1097/00007632-199012000-00014. [DOI] [PubMed] [Google Scholar]
- 10.Newell T.M., Kumar S. Comparison of instantaneous and cumulative loads on the low back and neck in orthodontists. Clin Biomech (Bristol, Avon) 2005;20:130–137. doi: 10.1016/j.clinbiomech.2004.09.011. [DOI] [PubMed] [Google Scholar]
- 11.Kingma I., Baten C.T., Dolan P., Toussaint H.M., van Dieën J.H., de Looze M.P., Adams M.A. Lumbar loading during lifting: a comparative study of three measurement techniques. J Electromyogr Kinesiol. 2001;11:337–345. doi: 10.1016/s1050-6411(01)00011-6. [DOI] [PubMed] [Google Scholar]
- 12.Lavender S.A., Andersson G.B.J., Schipplein O.D., Fuentes H.J. The effects of initial lifting height, load magnitude, and lifting speed on the peak dynamic L5/S1 moments. Int J Ind Ergon. 2003;31:51–59. [Google Scholar]
- 13.Bush-Joseph C., Schipplein O., Andersson G.B., Andriacchi T.P. Influence of dynamic factors on the lumbar spine moment in lifting. Ergonomics. 1988;31:211–216. doi: 10.1080/00140138808966662. [DOI] [PubMed] [Google Scholar]
- 14.Davis K.G., Marras W.S., Heaney C.A., Waters T.R., Gupta P. The impact of mental processing and pacing on spine loading: 2002 Volvo Award in biomechanics. Spine (Phila Pa 1976) 2002;27:2645–2653. doi: 10.1097/00007632-200212010-00003. [DOI] [PubMed] [Google Scholar]
- 15.Hall S.J. Effect of attempted lifting speed on forces and torque exerted on the lumbar spine. Med Sci Sports Exerc. 1985;17:440–444. doi: 10.1249/00005768-198508000-00006. [DOI] [PubMed] [Google Scholar]
- 16.Lin C.J., Bernard T.M., Ayoub M.M. A biomechanical evaluation of lifting speed using work- and moment-related measures. Ergonomics. 1999;42:1051–1059. doi: 10.1080/001401399185135. [DOI] [PubMed] [Google Scholar]
- 17.Smith D.R., Mihashi M., Adachi Y., Koga H., Ishitake T. A detailed analysis of musculoskeletal disorder risk factors among Japanese nurses. J Saf Res. 2006;37:195–200. doi: 10.1016/j.jsr.2006.01.004. [DOI] [PubMed] [Google Scholar]
- 18.Dempster W.T. Aerospace Medical Research Laboratories; Ohio (OH): 1955. Space requirements of the seated operator. Report number WADC-TR-55-159. [Google Scholar]
- 19.Németh G., Ohlsén H. 3D-location of the L5-S1 fulcrum in relation to the hip. Spine (Phila Pa 1976) 1989;14:604–605. doi: 10.1097/00007632-198906000-00011. [DOI] [PubMed] [Google Scholar]
- 20.Merryweather A., Bloswick D., Sesek R. A calculation of dynamic back compressive force: a pilot study of identify load displacement velocity constants. J Saf Health Environ Res. 2008;5:1–15. [Google Scholar]
- 21.Kaufman K.R., Hughes C., Morrey B.F., Morrey M., An K.N. Gait characteristics of patients with knee osteoarthritis. J Biomech. 2001;34:907–915. doi: 10.1016/s0021-9290(01)00036-7. [DOI] [PubMed] [Google Scholar]
- 22.Mündermann A., Dyrby C.O., Andriacchi T.P. Secondary gait changes in patients with medial compartment knee osteoarthritis: increased load at the ankle, knee, and hip during walking. Arthritis Rheum. 2005;52:2835–2844. doi: 10.1002/art.21262. [DOI] [PubMed] [Google Scholar]
- 23.Hurwitz D.E., Sumner D.R., Andriacchi T.P., Sugar D.A. Dynamic knee loads during gait predict proximal tibial bone distribution. J Biomech. 1998;31:423–430. doi: 10.1016/s0021-9290(98)00028-1. [DOI] [PubMed] [Google Scholar]
- 24.Davis K.G., Marras W.S., Waters T.R. Evaluation of spinal loading during lowering and lifting. Clin Biomech (Bristol, Avon) 1998;13:141–152. doi: 10.1016/s0268-0033(97)00037-5. [DOI] [PubMed] [Google Scholar]
- 25.Buseck M., Schipplein O.D., Andersson G.B., Andriacchi T.P. Influence of dynamic factors and external loads on the moment at the lumbar spine in lifting. Spine (Phila Pa 1976) 1988;13:918–921. doi: 10.1097/00007632-198808000-00009. [DOI] [PubMed] [Google Scholar]
- 26.Gracovetsky S. Determination of safe load. Br J Ind Med. 1986;43:120–133. doi: 10.1136/oem.43.2.120. [DOI] [PMC free article] [PubMed] [Google Scholar]
- 27.Greenland K.O., Merryweather A.S., Bloswick D.S. Prediction of peak back compressive forces as a function of lifting speed and compressive forces at lift origin and destination—a pilot study. Saf Health Work. 2011;2:236–242. doi: 10.5491/SHAW.2011.2.3.236. [DOI] [PMC free article] [PubMed] [Google Scholar]