

Abstract
BACKGROUND:
The prevalence of chronic hepatitis B (CHB) infection among immigrants to North America ranges from 2% to 15%, 40% of whom develop advanced liver disease. Screening for hepatitis B surface antigen is not recommended for immigrants.
OBJECTIVE:
To estimate the disease burden of CHB among immigrants in Canada using Markov cohort models comparing a cohort of immigrants with CHB versus a control cohort of immigrants without CHB.
METHODS:
Markov cohort models were used to estimate life years, quality-adjusted life years and lifetime direct medical costs (adjusted to 2008 Canadian dollars) for a cohort of immigrants with CHB living in Canada in 2006, and an age-matched control cohort of immigrants without CHB living in Canada in 2006. Parameter values were derived from the published literature.
RESULTS:
At the baseline estimate, the model suggested that the cohort of immigrants with CHB lost an average of 4.6 life years (corresponding to 1.5 quality-adjusted life years), had an increased average of $24,249 for lifetime direct medical costs, and had a higher lifetime risk for decompensated cirrhosis (12%), hepatocellular carcinoma (16%) and need for liver transplant (5%) when compared with the control cohort.
DISCUSSION:
Results of the present study showed that the socio-economic burden of CHB among immigrants living in Canada is sub-stantial. Governments and health systems need to develop policies that promote early recognition of CHB and raise public awareness regarding hepatitis B to extend the lives of infected immigrants.
Keywords: Chronic hepatitis B, Disease burden, Immigrants
Abstract
HISTORIQUE :
La prévalence d’infection par l’hépatite B chronique (HBC) chez les immigrants d’Amérique du Nord oscille entre 2 % et 15 %, et 40 % d’entre eux contractent une maladie hépatique avancée. Le dépistage de l’antigène de surface de l’hépatite B n’est pas recommandé chez les immigrants.
OBJECTIF :
Évaluer le fardeau d’HBC chez les immigrants du Canada au moyen de modèles de Markov qui comparent une cohorte d’immigrants atteints d’HBC à une cohorte témoin d’immigrants sans HBC.
MÉTHODOLOGIE :
Les chercheurs ont utilisé les modèles de Markov pour évaluer les années de vie pondérées en fonction de la qualité et les coûts médicaux directs pendant la vie (rajustés en dollars canadiens de 2008) chez une cohorte d’immigrants atteints de l’HBC qui vivaient au Canada en 2006 et chez une cohorte témoin appariée selon l’âge d’immigrants sans HBC qui vivaient également au Canada en 2006. Ils ont dérivé les valeurs paramétriques des publications.
RÉSULTATS :
Lors de l’évaluation de départ, le modèle laissait supposer que la cohorte d’immigrants ayant une HBC perdait une moyenne de 4,6 années de vie (soit 1,5 année de vie pondérée en fonction de la qualité), payaient en moyenne 24 249 $ de plus en frais médicaux directs et présentaient un risque plus élevé de cirrhose décompensée (12 %), de carcinome hépatocellulaire (16 %) et d’indication de transplantation hépatique (5 %) au cours de leur vie que la cohorte témoin.
EXPOSÉ :
Selon les résultats de la présente étude, les immigrants qui habitent au Canada présentent un important fardeau socioéconomique d’HBC. Les gouvernements et les systèmes de santé devraient préparer des politiques favorisant la promotion d’un dépistage rapide de l’HBC et mieux faire connaître l’hépatite B afin que les immigrants infectés vivent plus longtemps.
A large proportion of the chronic hepatitis B (CHB) population in Canada is comprised of individuals who were born abroad and are currently living in Canada (ie, immigrants). Canada accepted approximately four million immigrants between 1981 and 2006. More than 90% came from countries where hepatitis B virus (HBV) is either highly (>8%) or moderately (>2%) endemic, whereas the overall prevalence of HBV in Canada is <1% (1). Approximately 5% of immigrants in Canada have CHB, 40% of whom will silently progress to cirrhosis and, consequently, be at risk of dying prematurely from liver failure and/or liver cancer (2).
The objective of the present study was to estimate the health and economic burden associated with CHB among immigrants living in Canada and to determine the magnitude of disease burden.
METHODS
Two state-transition cohort models (3) were developed to project health outcomes and costs: one for a cohort of immigrants with CHB living in Canada in 2006, and one age-matched control cohort of immigrants without CHB living in Canada in 2006. The differences in life expectancy (life years [LYs]), quality-adjusted life expectancy (quality-adjusted LYs [QALYs]), and lifetime direct medical costs between the two cohorts were calculated to evaluate the health and economic burden associated with CHB in this population (4).
Cohort
The estimated number of immigrants with CHB residing in Canada in 2006 was 297,700 individuals (HBV prevalence of 4.81%) (Appendix 1). This number was estimated by multiplying the number of people who immigrated into Canada from each country by the prevalence in that country (5,6). The total number of immigrants, their age and country of origin were determined using data from the 2006 national census (1). The prevalence in various countries was obtained from review of the literature (5,7,8).
To estimate the distribution of disease states (see Appendix 2 for description of modelled health states) among immigrants with CHB, the medical records of immigrant patients with CHB who attended the tertiary referral liver clinic at the Toronto Western Hospital (Toronto, Ontario) were reviewed. The date of birth, country of origin, date of first visit, serological status (hepatitis B surface antigen [HBsAg], hepatitis B e antigen [HBeAg] and anti-HBeAg), alanine transaminase (ALT) level, and viral load (IU/mL) from the clinic database to estimate the distribution of disease progression states in patients stratified according to eight age groups (zero to 15, 16 to 25, 26 to 35, 36 to 45, 46 to 55, 56 to 65, 66 to 75, and 75 years of age and older) were extracted. A total of 774 medical records were retrieved.
Individuals born abroad and currently living in Canada may already have been tested and aware of their infection (9–11). According to a recent community-based immigrant survey conducted in Vancouver, British Columbia (10), between 19% and 89% of immigrants had been tested for HBV, depending their country of birth. In the present analysis, it was assumed that 30% (5% to 90% in sensitivity analysis) of the immigrants in Canada are aware of their infection with HBV, and for every year 0.5% (12) (0.1% to 2% in sensitivity analysis) of the unknown individuals will be diagnosed as having CHB infection.
The control cohort of immigrants without CHB in the present study was created with a similar sample size and age distribution as the cohort of immigrants with CHB living in Canada in 2006.
Decision model
In the present analysis, two state-transition cohort models were implemented using TreeAge Pro 2009 software (TreeAge Software, USA). The CHB model had 37 health states that included a combination of serological status (HBsAg and HBeAg), liver inflammation (ALT [normal/elevated]), viral load (high/low) and clinical states (cirrhosis, hepatocellular carcinoma [HCC], liver transplant). The formal definition of all 37 health states can be found in Appendix 2 (5).
In the simulation, cohort members with CHB moved between predefined health states in annual cycles until all members had died. Health states and allowed transitions among health states are shown in Appendix Figure 1 and Appendix Figure 2. In this model, CHB-infected individuals are initially assumed to have no cirrhosis but progress over time to different clinical states of CHB characterized by a combination of serology, ALT value and viral load, and/or development of cirrhosis. Those developing cirrhosis may develop decompensated liver disease and/or HCC and may die from the complications of liver disease or require a liver transplant.
Another Markov model with a one-year cycle length was constructed for each of the eight age groups in the control cohort of immigrants without CHB. It was assumed that this control cohort of immigrants without CHB were free of infection with HBV during their lifetime. Within each cycle, immigrants without CHB may die from all disease causes except CHB according to Canadian life tables.
Model probabilities
Probabilities representing the likelihood of HBV-related events were identified from literature reviews and expert sources (Table 1). Distribution of CHB health states at the start of the simulation is listed in Appendix 3.
TABLE 1.
Values for model variables
| Variable | Baseline | Low | High | Source | |
|---|---|---|---|---|---|
| Population | |||||
| Prevalence | |||||
| Immigrants with chronic HBV infection | 4.81% | 0.24% | 14.08% |
Appendix 1 (5,7) |
|
| Annual CHB diagnostic rate | 0.5% | 0.1% | 2% | (12) | |
| Known to be infected rate | 30% | 5% | 90% | (10,11) | |
| Annual transition probabilities related to chronic infection | |||||
|
| |||||
| CHB: No treatment states | |||||
| Immune tolerant (HBsAg+; HBeAg+; viral load: high; ALT level: normal) | |||||
| HCC | 0.00032 | 0.000028 | 0.00035 | (35) | |
| Chronic HBeAg+ hepatitis B | 0.1423 | 0.12 | 0.16 | (36) | |
| Chronic HBeAg+ hepatitis B (HBsAg+; HBeAg+; viral load: high; ALT level: high) | |||||
| Compensated cirrhosis | 0.044 | 0.022 | 0.088 | (37–39) | |
| HCC | 0.008 | 0.004 | 0.016 | (39–41) | |
| HBeAg seroconversion | 0.1 | 0.07 | 0.13 | (39,42–44) | |
| Inactive (HBsAg+; HBeAg−; viral load: low; ALT level: normal) | |||||
| Compensated cirrhosis | 0.001 | 0.001 | 0.002 | (2,39) | |
| HCC | 0.003 | 0.0015 | 0.006 | (2,39) | |
| Immune (HBsAg loss) | 0.008 | 0.0005 | 0.02 | (39,43) | |
| Reactivation (chronic HBeAg− hepatitis B) | 0.0254 | 0.02 | 0.05 | (2,45) | |
| Reversion (chronic HBeAg+ hepatitis B) | 0.0048 | 0.004 | 0.018 | (2,39,43) | |
| Chronic HBeAg− hepatitis B (HBsAg+; HBeAg−; viral load: high; ALT level: high) | |||||
| Compensated cirrhosis | 0.029 | 0.015 | 0.058 | (2,46,47) | |
| HCC | 0.008 | 0.004 | 0.012 | (2,41,47,48) | |
| Compensated cirrhosis: No treatment states | |||||
| Chronic HBeAg+ hepatitis B with cirrhosis (HBsAg+; HBeAg+; viral load: high; ALT level: high) | |||||
| Decompensated cirrhosis | 0.073 | 0.035 | 0.1 | (49) | |
| HCC | 0.034 | 0.01 | 0.12 | (49,50) | |
| HBeAg seroconversion | 0.1 | 0.07 | 0.13 | * | |
| Inactive w/cirrhosis (HBsAg+; HBeAg−; viral load: low; ALT level: normal) | |||||
| Decompensated cirrhosis | 0.008 | 0.004 | 0.016 | (39,51) | |
| HCC | 0.022 | 0.011 | 0.044 | (39,51) | |
| Immune (HBsAg loss) | 0.008 | 0.0005 | 0.02 | (39,43) | |
| Reactivation (chronic HBeAg− hepatitis B) | 0.0254 | 0.02 | 0.05 | (2,45) | |
| Reversion (chronic HBeAg+ hepatitis B) | 0.0048 | 0.008 | 0.018 | (39,43) | |
| Chronic HBeAg− hepatitis B w/cirrhosis (HBsAg+; HBeAg−; viral load: high; ALT level: high) | |||||
| Decompensated cirrhosis | 0.073 | 0.035 | 0.1 | (49) | |
| HCC | 0.037 | 0.01 | 0.12 | (41,49,50) | |
| Decompensated cirrhosis | |||||
| HCC | 0.06 | 0.01 | 0.113 | (12,41,52) | |
| Liver transplant | 0.05 | 0 | 0.4 | (12,52) | |
| Death | 0.173 | 0.058 | 0.221 | (12,52) | |
| HCC | |||||
| Liver transplant | 0.15 | 0.05 | 0.4 | (12,52) | |
| Death | 0.351 | 0.181 | 0.451 | (12,52) | |
| Liver transplant | |||||
| Death | 0.067 | 0.02 | 0.113 | (12,52) | |
| Treatment-related transition probabilities | |||||
| Entecavir | |||||
| Chronic HBeAg+ hepatitis B (HBsAg+; HBeAg+; viral load: high; ALT level: high) | |||||
| Resistance | 0.003 | 0 | 0.01 | (18,39,53–55) | |
| Withdrawal of treatment | 0.0028 | 0 | 0.01 | (18,39,53,55) | |
| Undetectable HBV DNA | 0.61 | 0.39 | 0.80 | (18,39,53,55) | |
| Normalization of ALT | 0.69 | 0.45 | 0.86 | (18,39,53,55) | |
| HBeAg seroconversion | 0.21 | 0.14 | 0.23 | (18,39,53,55) | |
| HBsAg loss | 0.01 | 0 | 0.05 | (18,39,53,55) | |
| Chronic HBeAg− hepatitis B (HBsAg+; HbeAg−; viral load: high; ALT level: high) | |||||
| Resistance | 0.003 | 0 | 0.01 | (18,47,56) | |
| Withdrawal of treatment | 0.018 | 0 | 0.02 | (18,47,56) | |
| Undetectable HBV DNA | 0.86 | 0.51 | 0.98 | (18,47,56) | |
| Normalization of ALT | 0.76 | 0.63 | 0.82 | (18,47,56) | |
| Tenofovir | |||||
| Chronic HBeAg+ hepatitis B (HBsAg+; HBeAg+; viral load: high; ALT level: high) | |||||
| Resistance | 0 | 0 | 0 | (18,57) | |
| Withdrawal of treatment | 0.028 | 0.01 | 0.05 | (18,57) | |
| Undetectable HBV DNA | 0.89 | 0.71 | 0.98 | (18,57) | |
| Normalization of ALT | 0.71 | 0.41 | 0.93 | (18,57) | |
| HBeAg seroconversion | 0.18 | 0.12 | 0.30 | (18,57) | |
| HBsAg loss | 0.05 | 0 | 0.54 | (18,57) | |
| Chronic HBeAg− hepatitis B (HBsAg+; HBeAg−; viral load: high; ALT level: high) | |||||
| Resistance | 0 | 0 | 0.01 | (18,57) | |
| Withdrawal of treatment | 0 | 0 | 0.03 | (18,57) | |
| Undetectable HBV DNA | 0.92 | 0.44 | 1 | (18,57) | |
| Normalization of ALT | 0.73 | 0.43 | 0.84 | (18,57) | |
| Lamivudine | |||||
| Chronic HBeAg+ hepatitis B (HBsAg+; HBeAg+; viral load: high; ALT level: high) | |||||
| Resistance | 0.11 | 0.05 | 0.15 | (18) | |
| Withdrawal of treatment | 0.028 | 0.01 | 0.05 | † | |
| Undetectable HBV DNA | 0.31 | 0.17 | 0.49 | (18) | |
| Normalization of ALT | 0.60 | 0.46 | 0.72 | (18) | |
| HbeAg seroconversion | 0.18 | 0.15 | 0.21 | (18) | |
| HbsAg loss | 0.008 | 0 | 0.02 | (18) | |
| Chronic HbeAg− hepatitis B (HBsAg+; HBeAg−; viral load: high; ALT level: high) | |||||
| Resistance | 0.11 | 0.05 | 0.15 | (18) | |
| Withdrawal of treatment | 0 | 0 | 0.03 | † | |
| Undetectable HBV DNA | 0.73 | 0.65 | 0.80 | (18) | |
| Normalization of ALT | 0.75 | 0.54 | 0.89 | (18) | |
| Pegylated interferon | |||||
| Chronic HBeAg+ hepatitis B (HBsAg+; HBeAg+; viral load: high; ALT level: high) | |||||
| Withdrawal of treatment | 0.03 | 0.01 | 0.05 | (18,58) | |
| Undetectable HBV DNA | 0.2 | 0.08 | 0.36 | (18) | |
| Normalization of ALT | 0.39 | 0.2 | 0.61 | (18) | |
| HbeAg seroconversion | 0.23 | 0.14 | 0.35 | (18) | |
| HbsAg loss | 0.01 | 0 | 0.07 | (18) | |
| Chronic HbeAg− Hepatitis B (HBsAg+; HBeAg+; viral load: high; ALT level: high) | |||||
| Withdrawal of treatment | 0.07 | 0.01 | 0.08 | (18,59) | |
| Undetectable HBV DNA | 0.67 | 0.41 | 0.89 | (18) | |
| Normalization of ALT | 0.60 | 0.09 | 0.89 | (18) | |
Assume same as chronic hepatitis B (CHB) positive;
Assume same as tenofovir/entecavir. − Negative; + Positive; ALT Alanine aminotransferase; HBeAg Hepatitis B e antigen; HBsAg Hepatitis B surface antigen; HBV Hepatitis B virus; HCC Hepatocellular carcinoma
Treatment for CHB
The baseline analysis assumed that patients offered antiviral therapy would be treated with either entecavir or tenofovir because they are the two most potent drugs with the highest genetic barrier to resistance. According to the Canadian guidelines (13), HBeAg-positive patients should be treated if both the HBV DNA concentration is >20,000 IU/mL and the ALT level is elevated (>1.5 × upper limit of normal [ULN]) for up to 12 months after HBeAg seroconversion. HBeAg-negative patients whose HBV DNA concentration is consistently >2000 IU/mL and have an elevated ALT level (>1.5×ULN) would be treated indefinitely. All patients with compensated cirrhosis with HBV DNA concentration >2000 IU/mL are treated indefinitely.
Patients on entecavir who develop resistance (1.5% at five years) (14) are switched to tenofovir. Presently, there is no evidence that patients receiving tenofovir develop resistance for up to four years after initialization of therapy (15). Thus, no resistance was assumed for patients who are treated with tenofovir.
Also performed were two additional analyses on lamivudine and pegylated interferon. Because the cost of lamivudine is relatively low, it is still frequently prescribed in North America (16,17) for CHB, despite the high rate of drug resistance. In the lamivudine analysis, patients on lamivudine who develop resistance are switched to tenofovir or entecavir. For the pegylated interferon analysis, HBeAg-positive patients were treated for 48 weeks while the HBeAg-negative patients were treated for one year (13) with pegylated interferon alpha-2a according to Canadian guidelines (13).
Estimates of treatment effectiveness were obtained from a systematic review and Bayesian meta-analysis (18) (Table 1). The probability of being treated was estimated using the medical records of immigrant patients with CHB who attended the liver clinic at Toronto Western Hospital (Appendix 4). This probability was changed accordingly as the disease progression state changed.
Direct medical costs and utilities
The health care costs included in the analysis include the direct costs of screening and the cost of treatment for the different CHB health states. These costs included diagnostic laboratory testing, procedures, outpatient visits, inpatient admission and medication, and were collected from published sources (Table 2). For the age-matched control cohort of immigrants without CHB living in Canada, the annual average health care costs reported by the Canadian Institute for Health Information (19) were used.
TABLE 2.
Costs and utilities used in the model
| Costs and utilities |
Cost*
|
Reference(s) | ||
|---|---|---|---|---|
| Baseline | Low | High | ||
| Acute hepatitis B | ||||
| Symptomatic/hospitalized | $17,537 | $10,317 | $19,092 | 12,60 |
| Symptomatic/not hospitalized | $576 | $370 | $862 | 12,60 |
| Chronic hepatitis B | ||||
| Diagnostic tests and laboratory tests | $483 | $442 | $534 | 61 |
| Procedures (professional fees only) | $20 | $17 | $24 | 61 |
| Outpatient visits | $400 | $340 | $487 | 61 |
| Medications (entecavir) | $8,000 | $7,000 | $9,000 | 39,47,62 |
| Medications (tenofovir) | $6,109 | $5,000 | $7,000 | 62,63 |
| Medications (lamivudine) | $1,865 | $1,000 | $2,500 | 39 |
| Medications (pegylated interferon) 48 weeks | $12,528 | $9,504 | $14,256 | 64 |
| Compensated cirrhosis | ||||
| Diagnostic tests and laboratory tests | $562 | $518 | $617 | 61 |
| Procedures (professional fees only) | $89 | $72 | $113 | 61 |
| Outpatient visits | $399 | $349 | $460 | 61 |
| Inpatient admissions | $929 | $397 | $2,500 | 61 |
| Medications (entecavir) | $8,000 | $7,000 | $9,000 | 39,47,62 |
| Medications (tenofovir) | $6,109 | $5,000 | $7,000 | 62,63 |
| Medications (lamivudine) | $1,865 | $1,000 | $2,500 | 39 |
| Medications (pegylated interferon) 52 weeks | $13,572 | $10,296 | $15,444 | 64 |
| Decompensated cirrhosis | ||||
| Diagnostic tests and laboratory tests | $993 | $916 | $1,090 | 61 |
| Procedures (professional fees only) | $388 | $324 | $472 | 61 |
| Outpatient visits | $550 | $440 | $707 | 61 |
| Inpatient admissions | $9,221 | $6,145 | $14,635 | 61 |
| Home care | $24 | $18 | $35 | 61 |
| Medications | $699 | $626 | $777 | 39,47 |
| Liver transplant | ||||
| Diagnostic tests and laboratory tests | $1,990 | $1,809 | $2,208 | 61 |
| Procedures (professional fees only) | $6,784 | $6,285 | $7,289 | 61 |
| Outpatient visits | $833 | $682 | $1,037 | 61 |
| Inpatient admissions | $58,418 | $54,480 | $65,871 | 61 |
| Home care | $44 | $34 | $58 | 61 |
| Medications | $36,712 | $34,203 | $40,131 | 61 |
| Post-transplant | ||||
| Diagnostic tests and laboratory tests | $1,265 | $1,128 | $1,468 | 61 |
| Procedures (professional fees only) | $228 | $155 | $343 | 61 |
| Outpatient visits | $764 | $688 | $860 | 61 |
| Inpatient admissions | $11,011 | $6,254 | $19,079 | 61 |
| Home care | $28 | $21 | $37 | 61 |
| Medications | $27,153 | $25,887 | $29,353 | 61 |
| Hepatocellular carcinoma | ||||
| Diagnostic tests and laboratory tests | $937 | $845 | $1,062 | 61 |
| Procedures (professional fees only) | $1,042 | $927 | $1,175 | 61 |
| Outpatient visits | $746 | $629 | $902 | 61 |
| Inpatient admissions | $9,857 | $6,970 | $13,939 | 61 |
| Home care | $533 | $354 | $793 | 61 |
| Medications | $1,006 | $921 | $1,100 | 61 |
| Cost of screening | $84 | $10 | $400 | 65 |
| Average health care | $4,119 | $3,707 | $4,530 | 19 |
| Utilities | ||||
| Canadian population average | 0.93 | 0.85 | 1 | 20 |
| Noncirrhotic chronic hepatitis B | 0.87 | 0.85 | 0.88 | 20 |
| Compensated cirrhosis | 0.81 | 0.75 | 0.86 | 20 |
| Decompensated cirrhosis | 0.49 | 0.22 | 0.75 | 20 |
| Hepatocellular carcinoma | 0.85 | 0.76 | 0.95 | 20 |
| Post-transplant | 0.72 | 0.60 | 0.83 | 20 |
2008 Canadian dollars (CAD $1 = US $0.813 using purchasing power parity conversion rate)
Utility data were obtained from a previous study involving more than 400 patients with CHB across different CHB health states (20), from early disease stage to HCC and/or post-liver transplantation (Table 2). The utilities used in the analysis were based on published Health Utilities Index Mark 3 scores (20). It was assumed that patients who spontaneously clear HBV infection and those who have never been infected had utility scores similar to the general Canadian adult population (21). For the control cohort, average health care cost and average utility scores for the general Canadian adult population were used.
Economic assumptions
The analysis was conducted from the health care payer perspective. Future costs and health benefits were discounted at a rate of 5% (22). Non-Canadian cost data were converted to Canadian dollars at the purchasing power parity conversion rate (23). All cost data were adjusted to 2008 using the Statistics Canada Consumer Price Index for health care and personal items (24).
RESULTS
Base case
At the baseline estimate (Table 3), the present model projected that the cohort of immigrants with CHB would, on average, live 28.43 years as of 2006. Also projected was that the age-matched control cohort of immigrants without CHB would live 33.21 years. With respect to life expectancy adjusted for quality of life, our models projected that health gains were smaller, but still very substantial at 1.49 QALY per person over the lifetime of the cohort when compared with the control cohort of immigrants without CHB. In terms of lifetime direct medical costs, the model suggested that the cohort of immigrants with CHB increased by an average of $24,249 over the lifetime of the cohort when compared with the control cohort of immigrants without CHB. To demonstrate the magnitude of disease burden from 297,572 individuals who were born abroad and are currently living in Canada with CHB, the model calculated that individuals with CHB could lose a total of approximately 1.3 million LYs or 0.4 million QALYs, and increase the burden on the health care system in Canada by $7 billion as a direct result of CHB.
TABLE 3.
Baseline disease burden of chronic hepatitis B (CHB) among immigrants living in Canada
| Indicators for disease burden | With CHB | Without CHB | Difference |
|---|---|---|---|
| Treatment using tenofovir only | |||
| Average LY (year) | 28.64 | 33.21 | −4.57 |
| Average QALY (year) | 11.93 | 13.42 | −1.49 |
| Average lifetime direct medical costs, $ | 83,706 | 59,457 | 24,249 |
| Total LY (year) | 8,523,753 | 9,882,598 | −1,358,845 |
| Total QALY (year) | 3,550,436 | 3,994,710 | −444,274 |
| Total lifetime direct medical costs, $ | 24,908,432,988 | 17,692,698,536 | 7,215,734,452 |
| Treatment using entecavir only | |||
| Average LY (year) | 28.47 | 33.21 | −4.74 |
| Average QALY (year) | 11.90 | 13.42 | −1.53 |
| Average lifetime direct medical costs, $ | 86,637 | 59,457 | 27,180 |
| Total LY (year) | 8,473,278 | 9,882,598 | −1,409,320 |
| Total QALY (year) | 3,540,213 | 3,994,710 | −454,497 |
| Total lifetime direct medical costs, $ | 25,780,649,619 | 17,692,698,536 | 8,087,951,083 |
| Treatment using lamivudine and tenofovir | |||
| Average LY (year) | 28.60 | 33.21 | −4.61 |
| Average QALY (year) | 11.91 | 13.42 | −1.51 |
| Average lifetime direct medical costs, $ | 80,042 | 59,457 | 20,585 |
| Total LY (year) | 8,511,417 | 9,882,598 | −1,371,181 |
| Total QALY (year) | 3,545,421 | 3,994,710 | −449,289 |
| Total lifetime direct medical costs, $ | 23,818,128,984 | 17,692,698,536 | 6,125,430,448 |
| Treatment using lamivudine and entecavir | |||
| Average LY (year) | 28.43 | 33.21 | −4.78 |
| Average QALY (year) | 11.88 | 13.42 | −1.54 |
| Average lifetime direct medical costs, $ | 81,166 | 59,457 | 21,709 |
| Total LY (year) | 8,458,783 | 9,882,598 | −1,423,815 |
| Total QALY (year) | 3,536,087 | 3,994,710 | −458,623 |
| Total lifetime direct medical costs, $ | 24,152,615,241 | 17,692,698,536 | 6,459,916,704 |
| Treatment using pegylated interferon | |||
| Average LY (year) | 27.69 | 33.21 | −5.52 |
| Average QALY (year) | 11.73 | 13.42 | −1.69 |
| Average lifetime direct medical costs, $ | 78,286 | 59,457 | 18,829 |
| Total LY (year) | 8,240,972 | 9,882,598 | −1,641,626 |
| Total QALY (year) | 3,491,102 | 3,994,710 | −503,608 |
| Total lifetime direct medical costs, $ | 23,295,642,649 | 17,692,698,536 | 5,602,944,113 |
Note: 2008 Canadian dollars (CAD $1 = US $0.813 using purchasing power parity conversion rate). LY Life year; QALY Quality-adjusted life year
The present model also simulated the average annual direct medical costs per person starting in 2006 for the cohort of immigrants with CHB and the cohort of immigrants without CHB (Figure 1). The annual health care cost for immigrants without CHB was $3,878 per person. The annual incremental health care cost per person for the CHB cohort was $472 in 2006, rising to a maximum of $959 in 2014.
Figure 1).

Comparison in average annual direct medical costs between immigrants with chronic hepatitis B (CHB) and immigrants without CHB since 2006
Also projected was the annual distribution of CHB-related clinical outcomes in the cohort of immigrants with CHB since 2006 (Table 4). From the simulated results, 44% of immigrants with CHB remained undiagnosed after 20 years of follow-up and silently progressed to advanced liver disease. The prevalence of advanced liver disease among immigrants with CHB will peak over the next 25 years in those not diagnosed and/or not given treatment even if needed. The prevalence of compensated cirrhosis peaked at 11% at year 25, the prevalence of decompensated cirrhosis peaked at 1.2% at year 20 and the prevalence of HCC peaked at 1.2% at year 10. Among patients with CHB who were aware of their diagnosis, the present model projected that the uptake of antiviral therapy was low, at only 9%, because the timing of antiviral therapy is poorly understood. The cumulative risks of liver-related adverse outcomes are depicted in Figure 2. One in five (21%) CHB patients alive in 2006 will die from liver disease. One in six (16%) will develop liver cancer and one in 20 (5%) will require a liver transplant.
TABLE 4.
Baseline annual distribution of major clinical outcomes among immigrants with chronic hepatitis B (CHB)
| Year | Population, n | Undiagnosed CHB | Patients undergoing treatment |
Cirrhosis
|
HCC | Liver transplant | CHB-related death | |
|---|---|---|---|---|---|---|---|---|
| Compensated | Decompensated | |||||||
| 2006 | 297,572 | 73.38 | 4.35 | 1.16 | 0.00 | 0.43 | 0.00 | 0.00 |
| 2010 | 281,807 | 66.66 | 7.55 | 5.07 | 0.48 | 1.07 | 0.11 | 0.40 |
| 2015 | 253,964 | 59.65 | 8.62 | 8.26 | 1.04 | 1.24 | 0.15 | 0.61 |
| 2020 | 222,442 | 53.85 | 8.35 | 9.89 | 1.24 | 1.17 | 0.15 | 0.65 |
| 2025 | 191,247 | 48.82 | 7.75 | 10.56 | 1.20 | 1.01 | 0.14 | 0.59 |
| 2030 | 161,286 | 44.28 | 7.17 | 10.69 | 1.05 | 0.82 | 0.11 | 0.50 |
| 2035 | 133,251 | 36.54 | 6.06 | 9.64 | 0.88 | 0.64 | 0.09 | 0.41 |
| 2040 | 107,342 | 32.96 | 5.63 | 9.32 | 0.70 | 0.49 | 0.07 | 0.32 |
| 2045 | 84,249 | 26.10 | 4.59 | 7.85 | 0.54 | 0.35 | 0.05 | 0.24 |
| 2050 | 63,942 | 23.34 | 4.26 | 7.43 | 0.41 | 0.25 | 0.03 | 0.17 |
| 2055 | 46,981 | 16.84 | 3.11 | 5.58 | 0.30 | 0.17 | 0.02 | 0.12 |
| 2060 | 33,159 | 14.93 | 2.86 | 5.19 | 0.22 | 0.11 | 0.02 | 0.08 |
| 2065 | 22,612 | 9.70 | 1.83 | 3.46 | 0.16 | 0.07 | 0.01 | 0.05 |
| 2070 | 14,501 | 5.15 | 0.96 | 1.87 | 0.11 | 0.04 | 0.01 | 0.03 |
Data presented as % unless otherwise indicated. HCC Hepatocellular carcinoma
Figure 2).

Cumulative risks of decompensated cirrhosis, hepatocellular carcinoma (HCC), liver transplant and chronic hepatitis B (CHB)-related death among immigrants with CHB since 2006
In terms of different antiviral therapies, the Canadian guideline (13) indicated entecavir or tenofovir should be used as first-line therapy. Because the pattern of care is not clear, additional disease burden analyses were performed on different antiviral therapies (Table 3). Among different antiviral therapies, the baseline analysis (using tenofovir as first-line therapy) generated the lowest LY or QALY lost, while lamivudine prescribed as first-line therapy and switching to tenofovir when resistance occurred generated average lifetime direct medical costs ($20,867 per person), but the consequence of this strategy is a higher average LY lost (4.72 years per person) and a higher average QALY lost (1.53 years per person). Using tenofovir as first-line therapy led to a gain of 0.15 LY per person, and an aggregated cost increase of $3,380 per person.
Sensitivity analysis
One-way sensitivity analysis was performed to evaluate the impact of uncertainty for all parameters in the model.
The projection results changed according to the following:
Effectiveness of antiviral treatment: if we decreased the rate of suppressing HBV viral load in HBeAg-negative patients by one-half of the value, the LY and QALY will be approximately decreased by 0.5 years for immigrants with CHB;
The progression rates to advanced liver disease: if the progression rates to advanced liver disease was reduced, the LY and QALY will be increased among immigrants with CHB while the average direct medical cost would be decreased;
Known to be infected: If it is assumed all the immigrants with CHB had no knowledge about their infection, the LY and QALY would be decreased while the average direct medical cost would be increased, because most of the immigrants with CHB will remain undiagnosed and usually progress into late-phase liver disease (ie, cirrhosis and/or HCC).
Appendix Figure 3 summarizes the most sensitive variables using tornado diagrams for LY, QALY and cost.
DISCUSSION
In the present study, we developed two Markov cohort models – one for immigrants with CHB and one for immigrants without CHB – to compare and project the disease burden of CHB among immigrants. Our analysis indicates that immigrants in Canada with CHB could live 4.6 years less than those without CHB under current care in Canada. Our analysis also suggests that the economic burden of CHB among immigrants living in Canada was substantial. The total increase in lifetime direct medical costs due to CHB among immigrants in Canada could be $7 billion.
The most recent economic burden of illness reported by Health Canada was completed in 1998 (25). In this report, infectious and parasitic diseases cost $909 million (direct cost) in the Canadian health system in 1998. If we adjust this cost to 2008 cost using the Consumer Price Index, infectious and parasitic diseases would cost $1,057 million in 2008. From our model, the annual incremental health care cost per person for the CHB cohort is $732 in 2008. With the estimated 297,572 individuals who were born abroad and are currently living in Canada with CHB, CHB contributed $218 million (approximately 20% of the total estimated $1,057 million in the infectious and parasitic diseases category) in 2008.
The direct medical costs caused by CHB among immigrants living in Canada are significant if compared with other disease categories (Appendix 5). CHB represents approximately 7.6% of the estimated total direct cancer cost or 2.7% of the estimated total direct cost of cardiovascular disease in 2008. However, there are only limited policies on screening and promoting early recognition regarding CHB in Canada. Currently, routine vaccination of adolescents and infants born to infected mothers are in place. HBV immunization coverage among one-year-olds in Canada in 2008 was only 17% (26). Serological screening for CHB is recommended for all pregnant woman, children adopted from highly endemic countries, and some high-risk groups (27,28). However, serological screening for CHB is not routinely conducted in immigrants at entrance to Canada. In addition, HBV-related stigma is common in immigrants (29–31), which can become a barrier to screening and treatment.
Our findings are consistent with other disease burden studies, although comparing CHB disease burden with other infectious diseases was difficult because of the different outcome measures (eg, QALYs, disability-adjusted LYs [DALYs], etc) and different assumptions (eg, discount rate, target population). According to the WHO global burden of disease study (32), the economic burden of hepatitis B is ranked sixth among all infectious diseases in Canada in terms of DALYs. A recent disease burden study from Ontario in 2010 (33) ranked hepatitis B fourth among all infectious diseases in terms of DALYs. The infectious diseases that have higher burden ranking than hepatitis B were hepatitis C, Streptococcus pneumoniae and human papillomavirus. Recent studies from the United States (6) and Germany (34) also reported increasing CHB disease burden from immigrants. In both studies, imported CHB cases from immigrants account for a significant proportion of new cases found in the studied countries.
In our study, we compared the disease burden in the population with the disease with a matched control group without the disease. Together with our comprehensive disease history model, our study could exclude the burden of other diseases or conditions existing in the study population. Furthermore, because our utility data were primarily derived from the immigrant population, we can more accurately estimate the disease burden of CHB among immigrants in Canada.
Our analysis has several limitations. Due to the lack of data, our analysis assumed that the prevalence of CHB among immigrants was the same as that reported in their home countries. In addition, our analysis also assumed that the distribution of disease progression states among immigrants with CHB in Canada was the same as the cohort of immigrants with CHB who attended the tertiary referral liver clinic at the Toronto Western Hospital. These assumptions could have significantly biased the results of the present study.
According to our analysis, the economic burden of CHB among immigrants living in Canada was substantial. There were significant loss of LYs and QALYs, and increases in direct medical costs caused by CHB among immigrants living in Canada. Governments and health systems should develop policies that promote early recognition and raise public awareness regarding hepatitis B to extend the lives of CHB-infected immigrants.
Acknowledgments
The authors express their appreciation to Dr Jordan Feld, Dr David Wong, Unsal Acarsu and Colina Yim for their valuable suggestions and insight in this study.
APPENDIX 1.
Estimated hepatitis B prevalence for immigrants in Canada
| Hepatitis B immigrant rate (estimated), % | Hepatitis B immigrant population (estimated), n | ||||||
|---|---|---|---|---|---|---|---|
|
|
|
||||||
| Low | Mid | High | Low | Mid | High | ||
| Total - Place of birth of respondent | 6,136,520 | 2.94 | 4.81 | 6.79 | 182,185 | 297,701 | 420,352 |
| United States of America | 250,535 | 0.10 | 0.30 | 0.40 | 251 | 752 | 1,002 |
| Central America | 130,460 | 0.98 | 1.88 | 3.46 | 1,273 | 2,449 | 4,519 |
| Caribbean and Bermuda | 317,765 | 1.19 | 2.44 | 3.85 | 3,784 | 7,757 | 12,248 |
| South America | 250,710 | 0.90 | 1.51 | 2.12 | 2,263 | 3,788 | 5,318 |
| Europe | 2,278,345 | 0.76 | 1.79 | 2.84 | 17,387 | 40,722 | 64,606 |
| Western | 424,645 | 0.20 | 0.89 | 1.80 | 849 | 3,795 | 7,640 |
| Eastern | 511,095 | 1.60 | 3.42 | 4.94 | 8,171 | 17,459 | 25,223 |
| Southern | 698,080 | 1.02 | 2.35 | 3.83 | 7,120 | 16,416 | 26 714 |
| Italy | 296,850 | 0.70 | 2.40 | 3.50 | 2,078 | 7,124 | 10,390 |
| Other Southern Europe | 401,220 | 1.26 | 2.32 | 4.07 | 5,043 | 9,292 | 16,325 |
| Northern Europe | 644,525 | 0.19 | 0.47 | 0.78 | 1,247 | 3,052 | 5,029 |
| United Kingdom | 579,620 | 0.20 | 0.50 | 0.80 | 1,159 | 2,898 | 4,637 |
| Other Northern Europe | 64,900 | 0.13 | 0.24 | 0.60 | 87 | 154 | 392 |
| Africa | 374,565 | 7.46 | 10.42 | 15.13 | 27,925 | 39,037 | 56,676 |
| Western Africa | 48,645 | 7.00 | 14.08 | 21.97 | 3,404 | 6,849 | 10,686 |
| Eastern Africa | 129,920 | 10.00 | 11.80 | 17.00 | 12,992 | 15,331 | 22,086 |
| Northern Africa | 134,505 | 4.00 | 7.10 | 10.00 | 5,380 | 9,550 | 13,451 |
| Central Africa | 22,405 | 10.00 | 13.60 | 17.00 | 2,241 | 3,047 | 3,809 |
| Southern Africa | 39,085 | 10.00 | 10.90 | 17.00 | 3,908 | 4,260 | 6,644 |
| Asia and the Middle East | 2,525,155 | 5.03 | 7.92 | 10.75 | 126,968 | 200,068 | 271,526 |
| West Central Asia and the Middle East | 370,515 | 1.98 | 3.52 | 4.99 | 7,331 | 13,422 | 18,507 |
| Eastern Asia | 874,365 | 9.05 | 12.38 | 15.78 | 79,153 | 108,249 | 137,962 |
| China | 466,940 | 10.00 | 13.60 | 17.00 | 46,694 | 63,504 | 79,380 |
| Hong Kong, Special Administrative Region | 215,430 | 10.00 | 13.60 | 17.00 | 21,543 | 29,298 | 36,623 |
| Other Eastern Asia | 185,990 | 5.55 | 7.87 | 11.26 | 10,316 | 14,631 | 20,939 |
| Southeast Asia | 560,995 | 4.97 | 9.13 | 12.04 | 27,854 | 51,237 | 67,538 |
| Philippines | 303,195 | 4.20 | 7.00 | 9.00 | 12,734 | 21,224 | 27,288 |
| Other Southeast Asia | 257,790 | 5.87 | 11.64 | 15.61 | 15,120 | 30,013 | 40,250 |
| Southern Asia | 719,280 | 1.76 | 3.78 | 6.61 | 12,629 | 27,161 | 47,518 |
| India | 443,690 | 1.00 | 2.80 | 6.00 | 4,437 | 12,423 | 26,621 |
| Other Southern Asia | 242,365 | 2.90 | 5.40 | 7.53 | 7,029 | 13,076 | 18,239 |
| Oceania and other | 58,985 | 3.98 | 5.34 | 7.60 | 2,347 | 3,149 | 4,486 |
APPENDIX 2.
Health states used in the Markov model
| Health state number | Short description |
Serological status, liver inflammation and viral load details
|
|||
|---|---|---|---|---|---|
| HBsAg status | HBeAg status | ALT level (×ULN) | Viral load, IU/mL | ||
| 1 | HBeAg-negative chronic hepatitis B state | Positive | Negative | <1.5 | ≥2000 |
| 2 | HBeAg-negative chronic hepatitis B state | Positive | Negative | ≥1.5 | <2000 |
| 3 | Immune tolerant | Positive | Positive | <1.5 | ≥20,000 |
| 4 | HBeAg-positive chronic hepatitis B state | Positive | Positive | ≥1.5 | ≥20,000 |
| 5 | Inactive chronic hepatitis B | Positive | Negative | <1.5 | <2000 |
| 6 | HBeAg-negative chronic hepatitis B state | Positive | Negative | ≥1.5 | ≥2000 |
| 7 | HBeAg-positive chronic hepatitis B state on treatment | Positive | Positive | <1.5 | <20,000 |
| 8 | HBeAg-positive chronic hepatitis B state on treatment | Positive | Positive | ≥1.5 | <20,000 |
| 9 | HBeAg-negative chronic hepatitis B state on treatment | Positive | Negative | <1.5 | ≥2000 |
| 10 | HBeAg-negative chronic hepatitis B state on treatment | Positive | Negative | ≥1.5 | <2000 |
| 11 | HBeAg-positive chronic hepatitis B state on treatment | Positive | Positive | <1.5 | ≥20,000 |
| 12 | HBeAg-positive chronic hepatitis B state on treatment | Positive | Positive | ≥1.5 | ≥20,000 |
| 13 | HBeAg-negative chronic hepatitis B state on treatment | Positive | Negative | <1.5 | <2000 |
| 14 | HBeAg-negative chronic hepatitis B state on treatment | Positive | Negative | ≥1.5 | ≥2000 |
| 15 | HBeAg-negative chronic hepatitis B state with compensated cirrhosis | Positive | Negative | <1.5 | ≥2000 |
| 16 | HBeAg-negative chronic hepatitis B state with compensated cirrhosis | Positive | Negative | ≥1.5 | <2000 |
| 17 | HBeAg-positive chronic hepatitis B state with compensated cirrhosis on treatment | Positive | Positive | <1.5 | ≥2000 |
| 18 | HBeAg-positive chronic hepatitis B state with compensated cirrhosis on treatment | Positive | Positive | ≥1.5 | ≥2000 |
| 19 | Inactive Chronic hepatits B with compensated cirrhosis | Positive | Negative | <1.5 | <2000 |
| 20 | HBeAg-negative chronic hepatitis B state with compensated cirrhosis | Positive | Negative | ≥1.5 | ≥2000 |
| 21 | HBeAg-positive chronic hepatitis B state with compensated cirrhosis on treatment | Positive | Positive | <1.5 | <2000 |
| 22 | HBeAg-positive chronic hepatitis B state with compensated cirrhosis on treatment | Positive | Positive | ≥1.5 | <2000 |
| 23 | HBeAg-negative chronic hepatitis B state with compensated cirrhosis on treatment | Positive | Negative | <1.5 | ≥2000 |
| 24 | HBeAg-negative chronic hepatitis B state with compensated cirrhosis on treatment | Positive | Negative | ≥1.5 | <2000 |
| 25 | HBeAg-positive chronic hepatitis B state with compensated cirrhosis on treatment | Positive | Positive | <1.5 | ≥2000 |
| 26 | HBeAg-positive chronic hepatitis B state with compensated cirrhosis on treatment | Positive | Positive | ≥1.5 | ≥2000 |
| 27 | HBeAg-negative chronic hepatitis B state with compensated cirrhosis on treatment | Positive | Negative | <1.5 | <2000 |
| 28 | HBeAg-negative chronic hepatitis B state with compensated cirrhosis on treatment | Positive | Negative | ≥1.5 | ≥2000 |
| 29 | Decompensated cirrhosis | ||||
| 30 | Hepatocellular carcinoma | ||||
| 31 | Liver transplant | ||||
| 32 | Immune | ||||
| 33 | Vaccine-induced immunity | ||||
| 34 | No previous exposure | ||||
| 35 | Naturally Immune | ||||
| 36 | Post-liver transplant | ||||
| 37 | Death | ||||
HBeAg Hepatitis B e antigen; HBsAg Hepatitis B surface antigen; ULN Upper limit of normal
APPENDIX 3.
Estimated distribution of disease progression states among immigrants with chronic hepatitis B (CHB) using the medical records of immigrant patients with CHB who attended the liver clinic at Toronto Western Hospital, Toronto, Ontario
| Disease states |
Age, years
|
|||||
|---|---|---|---|---|---|---|
| <20 | 21–30 | 31–40 | 41–50 | 51–65 | >65 | |
| Immune tolerant (HBsAg+; HBeAg+; viral load: high; ALT level: normal) | 47.83 | 42.86 | 21.08 | 17.26 | 9.77 | 15.94 |
| Chronic HBeAg+ hepatitis B (HBsAg+; HBeAg+; viral load: high; ALT level: high) | 21.74 | 26.32 | 24.10 | 16.07 | 4.65 | 2.90 |
| Inactive hepatitis B (HBsAg+; HBeAg−; viral load: low; ALT level: normal) | 21.74 | 21.05 | 39.76 | 50.00 | 67.44 | 65.22 |
| Chronic HBeAg− hepatitis B (HBsAg+; HBeAg−; viral load: high; ALT level: high) | 8.70 | 9.77 | 15.06 | 16.67 | 18.14 | 15.94 |
Data presented as % unless otherwise specified. − Negative; + Positive; ALT Alanine aminotransferase; HBeAg Hepatitis B e antigen; HBsAg Hepatitis B surface antigen
APPENDIX 4.
Estimated probability of treatment using the medical records of immigrant patients with chronic hepatitis B who attended the liver clinic at Toronto Western Hospital, Toronto, Ontario
| Disease states |
Age, years
|
|||||
|---|---|---|---|---|---|---|
| Age <20 | 21–30 | 31–40 | 41–50 | 51–65 | >65 | |
| Immune tolerant (HBsAg+; HBeAg+; viral load: high; ALT level: normal) | 9.09 | 12.28 | 14.29 | 41.38 | 42.86 | 45.45 |
| Chronic HBeAg+ hepatitis B (HBsAg+; HBeAg+; viral load: high; ALT level: high) | 20.00 | 14.29 | 45.00 | 66.67 | 70.00 | 50.00 |
| Inactive hepatitis B (HBsAg+; HBeAg−; viral load: low; ALT level: normal) | 40.00 | 3.57 | 10.61 | 25.00 | 44.14 | 55.56 |
| Chronic HBeAg− hepatitis B (HBsAg+; HBeAg−; viral load: high; ALT level: high) | 0.00 | 30.77 | 40.00 | 32.14 | 53.85 | 45.45 |
Data presented as %. − Negative; + Positive; ALT Alanine aminotransferase; HBeAg Hepatitis B e antigen; HBsAg Hepatitis B surface antigen
APPENDIX 5.
Comparing disease burden of illness in Canada according to diagnostic category against chronic hepatitis B (CHB)
| Disease category | Estimated total direct cost 2008 (in millions), $ | Proportion of CHB from immigrant direct cost, % |
|---|---|---|
| CHB from immigrant | 217.8 | 100 |
| Birth defects | 204.35 | 106.6 |
| Blood diseases | 248.05 | 87.8 |
| Cancer | 2,862.28 | 7.6 |
| Cardiovascular diseases | 7,925.31 | 2.7 |
| Digestive diseases | 4,114.87 | 5.3 |
| Endocrine and related diseases | 1,841.93 | 11.8 |
| Genitourinary diseases | 3,019.08 | 7.2 |
| Ill-defined conditions | 2,046.16 | 10.6 |
| Infectious and parasitic diseases | 1,056.62 | 20.6 |
| Injuries | 3,748.49 | 5.8 |
| Mental disorders | 5,440.93 | 4.0 |
| Musculoskeletal diseases | 3,078.48 | 7.1 |
| Nervous system/sense organ diseases | 3,280.86 | 6.6 |
| Perinatal conditions | 355.46 | 61.3 |
| Pregnancy | 1,507.74 | 14.4 |
| Respiratory diseases | 4,023.51 | 5.4 |
| Skin and related diseases | 1,713.72 | 12.7 |
| Well patient care | 3,049.31 | 7.1 |
| Others | 3,744.65 | 5.8 |
| Unattributable | 44,326.82 | 0.5 |
| Overall Total | 97,588.6 | 0.2 |
Appendix Figure 1).
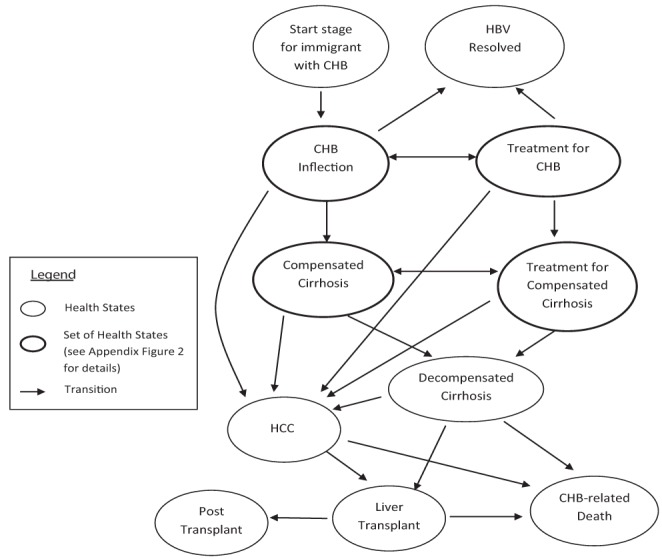
Markov model of hepatitis B virus (HBV) infection and progression. CHB Chronic hepatitis B; HCC Hepatocellular carcinoma
Appendix Figure 2).

Detailed Markov model of chronic hepatitis B virus (HBV) infection and progression. −Negative; + Positive; ALT Alanine amino-transferase; HBeAg Hepatitis B e antigen; HBsAg Hepatitis B surface antigen
Appendix Figure 3).

Result of sensitivity analysis: Tornado diagrams for life years (LY), quality-adjusted LYs (QALY) and cost (2008 Canadian dollars [CAD $1 = US $0.813]). CHB Chronic hepatitis B
Footnotes
FINANCIAL DISCLOSURES: The present study was supported by an unrestricted grant from Gilead Sciences. None of the funding organizations or sponsors had any role in the design and conduct of the study; the collection, management, analysis, or interpretation of the data; or the preparation, review or approval of the manuscript.
FUNDING/SUPPORT: Dr Heathcote has received consulting fees and grant support from Axcan, Ortho Biotech, Idenix Pharmaceuticals, Human Genome Sciences, Gilead Sciences, GlaxoSmithKline, Novartis, Merck, Vertex, Hoffmann-La Roche, Tibotec, Boehringer Ingelheim and Bristol-Myers Squibb. Dr Krahn received a grant to fund this study from Gilead Sciences.
REFERENCES
- 1.Statistics Canada . CANSIM Table 051-0006. Immigrants to Canada, by Country of Last Permanent Residence, Quarterly (persons) Ottawa, Ontario, Canada: Statistics Canada; 2009. < www.statcan.gc.ca/pub/91-214-x/2009000/related-connexes-eng.htm> (Accessed February 1, 2010). [Google Scholar]
- 2.Hsu YS, Chien RN, Yeh CT, et al. Long-term outcome after spontaneous HBeAg seroconversion in patients with chronic hepatitis B. Hepatology. 2002;35:1522–7. doi: 10.1053/jhep.2002.33638. [DOI] [PubMed] [Google Scholar]
- 3.Gold MR, Siegel JE, Russell LB, Weinstein MC. Cost-effectiveness in Health and Medicine. New York: Oxford University Press; 1996. [Google Scholar]
- 4.Chen W. Chronic Hepatitis C among Immigrants Living in Canada: Natural History, Disease Burden, and Cost-Effectiveness of Screening. Toronto: University of Toronto; 2010. [Google Scholar]
- 5.Wong WW, Woo G, Jenny Heathcote E, Krahn M. Cost effectiveness of screening immigrants for hepatitis B. Liver Int. 2011;31:1179–90. doi: 10.1111/j.1478-3231.2011.02559.x. [DOI] [PubMed] [Google Scholar]
- 6.Mitchell T, Armstrong GL, Hu DJ, Wasley A, Painter JA. The increasing burden of imported chronic hepatitis B – United States, 1974–2008. PLoS One. 2011;6:e27717. doi: 10.1371/journal.pone.0027717. [DOI] [PMC free article] [PubMed] [Google Scholar]
- 7.World Health Organization . Hepatitis B. Geneva, Switzerland: World Health Organization; 2002. < www.who.int/mediacentre/factsheets/fs204/en/> (Accessed February 1, 2010). [Google Scholar]
- 8.Eckman MH, Kaiser TE, Sherman KE. The cost-effectiveness of screening for chronic hepatitis B infection in the United States. Clin Infect Dis. 2011;52:1294–306. doi: 10.1093/cid/cir199. [DOI] [PMC free article] [PubMed] [Google Scholar]
- 9.Lutgehetmann M, Meyer F, Volz T, et al. [Knowledge about HBV, prevention behaviour and treatment adherence of patients with chronic hepatitis B in a large referral centre in Germany.] Z Gastroenterol. 2010;48:1126–32. doi: 10.1055/s-0029-1245304. [DOI] [PubMed] [Google Scholar]
- 10.Hislop TG, Bajdik CD, Teh C, et al. Hepatitis B testing and vaccination in immigrants attending English as a second language classes in British Columbia, Canada. Asian Pac J Cancer Prev. 2009;10:997–1002. [PMC free article] [PubMed] [Google Scholar]
- 11.Tu RS, Li L, Tsai JH, et al. A cross-border comparison of hepatitis B testing among Chinese residing in Canada and the United States. Asian Pac J Cancer Prev. 2009;10:483–90. [PMC free article] [PubMed] [Google Scholar]
- 12.Hutton DW, Tan D, So SK, Brandeau ML. Cost-effectiveness of screening and vaccinating Asian and Pacific Islander adults for hepatitis B. Ann Intern Med. 2007;147:460–9. doi: 10.7326/0003-4819-147-7-200710020-00004. [DOI] [PubMed] [Google Scholar]
- 13.Sherman M, Shafran S, Burak K, et al. Management of chronic hepatitis B: Consensus guidelines. Can J Gastroenterol. 2007;21(Suppl C):5C–24C. [PMC free article] [PubMed] [Google Scholar]
- 14.Tenney DJ, Rose RE, Baldick CJ, et al. Long-term monitoring shows hepatitis B virus resistance to entecavir in nucleoside-naive patients is rare through 5 years of therapy. Hepatology. 2009;49:1503–14. doi: 10.1002/hep.22841. [DOI] [PubMed] [Google Scholar]
- 15.van Bommel F, de Man RA, Wedemeyer H, et al. Long-term efficacy of tenofovir monotherapy for hepatitis B virus-monoinfected patients after failure of nucleoside/nucleotide analogues. Hepatology. 2010;51:73–80. doi: 10.1002/hep.23246. [DOI] [PubMed] [Google Scholar]
- 16.Delaney WEt, Borroto-Esoda K. Therapy of chronic hepatitis B: Trends and developments. Curr Opin Pharmacol. 2008;8:532–40. doi: 10.1016/j.coph.2008.09.008. [DOI] [PubMed] [Google Scholar]
- 17.Les I, Garcia-Martinez R, Cordoba J, Quintana M, Esteban R, Buti M. Current trends in chronic hepatitis B management: Results of a questionnaire. Eur J Gastroenterol Hepatol. 2009;21:1177–83. doi: 10.1097/MEG.0b013e3283154f3a. [DOI] [PubMed] [Google Scholar]
- 18.Woo G, Tomlinson G, Nishikawa Y, et al. Tenofovir and entecavir are the most effective antiviral agents for chronic hepatitis B: A systematic review and Bayesian meta-analyses. Gastroenterology. 2010;139:1218–29. doi: 10.1053/j.gastro.2010.06.042. [DOI] [PubMed] [Google Scholar]
- 19.Canadian Institute for Health Information . Health Care in Canada. Ottawa, ON, Canada: Canadian Institute for Health Information; 2004. < https://secure.cihi.ca/free_products/hcic2004_e.pdf> (Accessed February 1, 2010). [Google Scholar]
- 20.Woo G, Tomlinson G, Yim C, et al. Health state utilities and quality of life in patients with hepatitis B. Can J Gastroenterol. 2012;26:445–51. doi: 10.1155/2012/736452. [DOI] [PMC free article] [PubMed] [Google Scholar]
- 21.Mittmann N, Trakas K, Risebrough N, Liu BA. Utility scores for chronic conditions in a community-dwelling population. Pharmacoeconomics. 1999;15:369–76. doi: 10.2165/00019053-199915040-00004. [DOI] [PubMed] [Google Scholar]
- 22.Canadian Agency for Drugs and Technologies in Health . Guidelines for the Economic Evaluation of Health Technologies. 3rd edn. Canada, Ottawa, ON, Canada: Canadian Agency for Drugs and Technologies in Health; 2006. < http://cadth.ca/media/pdf/186_EconomicGuidelines_e.pdf> (Accessed February 1, 2011). [Google Scholar]
- 23.Organisation for Economic Co-Operation and Development . OECD iLibrary: PPPs and Exchange Rates. Paris, France: Organisation for Economic Co-Operation and Development; 2009. < www.oecd-ilibrary.org/statistics> (Accessed February 1, 2011). [Google Scholar]
- 24.Statistics Canada . CANSIM Table 326-0021. Consumer price index (CPI), 2005 basket content, annual (2002=100) Ottawa: Statistics Canada; 2009. < www5.statcan.gc.ca/cansim/a05?lang=eng&id=3260021> (Accessed February 1, 2011). [Google Scholar]
- 25.Public health Agency of Canada . Economic Burden of Illness in Canada, 1998. Ottawa, ON, Canada: Public health Agency of Canada; 1998. < www.phac-aspc.gc.ca/ebic-femc/ebic-femc98/index-eng.php> (Accessed February 1, 2010). [Google Scholar]
- 26.World Health Organization . WHO Statistical Information System. Geneva, Switzerland: World Health Organization; 2009. < www.who.int/whosis> (Accessed February 1, 2010). [Google Scholar]
- 27.Public Health Agency of Canada . Canada Communicable Disease Report. Ottawa: Public Health Agency of Canada; 1995. < www.phac-aspc.gc.ca/publicat/ccdr-rmtc/> (Accessed February 1, 2010). [Google Scholar]
- 28.Public Health Agency of Canada . Canadian Immunization Guide. Ottawa: Public health Agency of Canada; 2006. < www.phac-aspc.gc.ca/publicat/cig-gci/> (Accessed February 1, 2011). [Google Scholar]
- 29.Cotler SJ, Cotler S, Xie H, Luc BJ, Layden TJ, Wong SS. Characterizing hepatitis B stigma in Chinese immigrants. J Viral Hepat. 2012;19:147–52. doi: 10.1111/j.1365-2893.2011.01462.x. [DOI] [PubMed] [Google Scholar]
- 30.Malespin M, Wong S, Siqueira F, et al. Barriers to treatment of hepatitis B in an urban Chinatown community. J Clin Gastroenterol. 2012;46:e66–70. doi: 10.1097/MCG.0b013e31824e159c. [DOI] [PubMed] [Google Scholar]
- 31.Wu H, Yim C, Chan A, Ho M, Heathcote J. Sociocultural factors that potentially affect the institution of prevention and treatment strategies for prevention of hepatitis B in Chinese Canadians. Can J Gastroenterol. 2009;23:31–6. doi: 10.1155/2009/608352. [DOI] [PMC free article] [PubMed] [Google Scholar]
- 32.World Health Organization . The global burden of disease: 2004 update. Geneva, Switzerland: World Health Organization; 2008. < www.who.int/healthinfo/global_burden_disease/2004_report_update/en/> (Accessed September 1, 2011). [Google Scholar]
- 33.Kwong JC, Crowcroft NS, Campitelli MS, et al. Ontario Burden of Infectious Disease Study. Toronto, Ontario, Canada: Institute for Clinical Evaluative Sciences (ICES); 2010. < www.ices.on.ca/file/ONBOIDS_FullReport_intra.pdf> (Accessed September 1, 2011). [Google Scholar]
- 34.Fischer C, Mauss S, Zehnter E, Bokemeyer B, Heyne R, Huppe D. [Epidemiology and clinical characteristics of patients with chronic hepatitis B (CHB) in Germany – results of a nationwide cross-sectional study] Z Gastroenterol. 2012;50:22–9. doi: 10.1055/s-0031-1281628. [DOI] [PubMed] [Google Scholar]
- 35.Wen WH, Chang MH, Hsu HY, Ni YH, Chen HL. The development of hepatocellular carcinoma among prospectively followed children with chronic hepatitis B virus infection. J Pediatr. 2004;144:397–9. doi: 10.1016/j.jpeds.2003.11.022. [DOI] [PubMed] [Google Scholar]
- 36.Chu CM, Liaw YF. Chronic hepatitis B virus infection acquired in childhood: Special emphasis on prognostic and therapeutic implication of delayed HBeAg seroconversion. J Viral Hepat. 2007;14:147–52. doi: 10.1111/j.1365-2893.2006.00810.x. [DOI] [PubMed] [Google Scholar]
- 37.Lin SM, Sheen IS, Chien RN, Chu CM, Liaw YF. Long-term beneficial effect of interferon therapy in patients with chronic hepatitis B virus infection. Hepatology. 1999;29:971–5. doi: 10.1002/hep.510290312. [DOI] [PubMed] [Google Scholar]
- 38.Liaw YF, Tai DI, Chu CM, Chen TJ. The development of cirrhosis in patients with chronic type B hepatitis: A prospective study. Hepatology. 1988;8:493–6. doi: 10.1002/hep.1840080310. [DOI] [PubMed] [Google Scholar]
- 39.Veenstra DL, Sullivan SD, Clarke L, et al. Cost effectiveness of entecavir versus lamivudine with adefovir salvage in HBeAg-positive chronic hepatitis B. Pharmacoeconomics. 2007;25:963–77. doi: 10.2165/00019053-200725110-00006. [DOI] [PubMed] [Google Scholar]
- 40.Liaw YF, Tai DI, Chu CM, et al. Early detection of hepatocellular carcinoma in patients with chronic type B hepatitis. A prospective study. Gastroenterology. 1986;90:263–7. doi: 10.1016/0016-5085(86)90919-4. [DOI] [PubMed] [Google Scholar]
- 41.Papatheodoridis GV, Manolakopoulos S, Touloumi G, et al. Virological suppression does not prevent the development of hepatocellular carcinoma in HBeAg-negative chronic hepatitis B patients with cirrhosis receiving oral antiviral(s) starting with lamivudine monotherapy: Results of the nationwide HEPNET. Greece cohort study. Gut. 2011;60:1109–16. doi: 10.1136/gut.2010.221846. [DOI] [PubMed] [Google Scholar]
- 42.Marcellin P, Chang TT, Lim SG, et al. Adefovir dipivoxil for the treatment of hepatitis B e antigen-positive chronic hepatitis B. N Engl J Med. 2003;348:808–16. doi: 10.1056/NEJMoa020681. [DOI] [PubMed] [Google Scholar]
- 43.McMahon BJ, Holck P, Bulkow L, Snowball M. Serologic and clinical outcomes of 1536 Alaska natives chronically infected with hepatitis B virus. Ann Intern Med. 2001;135:759–68. doi: 10.7326/0003-4819-135-9-200111060-00006. [DOI] [PubMed] [Google Scholar]
- 44.Yuen MF, Yuan HJ, Hui CK, et al. A large population study of spontaneous HBeAg seroconversion and acute exacerbation of chronic hepatitis B infection: Implications for antiviral therapy. Gut. 2003;52:416–9. doi: 10.1136/gut.52.3.416. [DOI] [PMC free article] [PubMed] [Google Scholar]
- 45.Chu CM, Liaw YF. Incidence and risk factors of progression to cirrhosis in inactive carriers of hepatitis B virus. Am J Gastroenterol. 2009;104:1693–9. doi: 10.1038/ajg.2009.187. [DOI] [PubMed] [Google Scholar]
- 46.Iloeje UH, Yang HI, Su J, Jen CL, You SL, Chen CJ. Predicting cirrhosis risk based on the level of circulating hepatitis B viral load. Gastroenterology. 2006;130:678–86. doi: 10.1053/j.gastro.2005.11.016. [DOI] [PubMed] [Google Scholar]
- 47.Veenstra DL, Spackman DE, Di Bisceglie A, Kowdley KV, Gish RG. Evaluating anti-viral drug selection and treatment duration in HBeAg-negative chronic hepatitis B: A cost-effectiveness analysis. Aliment Pharmacol Ther. 2008;27:1240–52. doi: 10.1111/j.1365-2036.2008.03691.x. [DOI] [PubMed] [Google Scholar]
- 48.Chen CJ, Yang HI, Su J, et al. Risk of hepatocellular carcinoma across a biological gradient of serum hepatitis B virus DNA level. JAMA. 2006;295:65–73. doi: 10.1001/jama.295.1.65. [DOI] [PubMed] [Google Scholar]
- 49.Kanwal F, Farid M, Martin P, et al. Treatment alternatives for hepatitis B cirrhosis: A cost-effectiveness analysis. Am J Gastroenterol. 2006;101:2076–89. doi: 10.1111/j.1572-0241.2006.00769.x. [DOI] [PubMed] [Google Scholar]
- 50.Benvegnu L, Gios M, Boccato S, Alberti A. Natural history of compensated viral cirrhosis: A prospective study on the incidence and hierarchy of major complications. Gut. 2004;53:744–9. doi: 10.1136/gut.2003.020263. [DOI] [PMC free article] [PubMed] [Google Scholar]
- 51.Fattovich G, Pantalena M, Zagni I, Realdi G, Schalm SW, Christensen E. Effect of hepatitis B and C virus infections on the natural history of compensated cirrhosis: A cohort study of 297 patients. Am J Gastroenterol. 2002;97:2886–95. doi: 10.1111/j.1572-0241.2002.07057.x. [DOI] [PubMed] [Google Scholar]
- 52.Kanwal F, Gralnek IM, Martin P, Dulai GS, Farid M, Spiegel BM. Treatment alternatives for chronic hepatitis B virus infection: A cost-effectiveness analysis. Ann Intern Med. 2005;142:821–31. doi: 10.7326/0003-4819-142-10-200505170-00007. [DOI] [PubMed] [Google Scholar]
- 53.Chang TT, Gish RG, de Man R, et al. A comparison of entecavir and lamivudine for HBeAg-positive chronic hepatitis B. N Engl J Med. 2006;354:1001–10. doi: 10.1056/NEJMoa051285. [DOI] [PubMed] [Google Scholar]
- 54.Chang TT, Lai CL, Kew Yoon S, et al. Entecavir treatment for up to 5 years in patients with hepatitis B e antigen-positive chronic hepatitis B. Hepatology. 2010;51:422–30. doi: 10.1002/hep.23327. [DOI] [PubMed] [Google Scholar]
- 55.Ren FY, Piao DM, Piao XX. A one-year trial of entecavir treatment in patients with HBeAg-positive chronic hepatitis B. World J Gastroenterol. 2007;13:4264–7. doi: 10.3748/wjg.v13.i31.4264. [DOI] [PMC free article] [PubMed] [Google Scholar]
- 56.Lai CL, Shouval D, Lok AS, et al. Entecavir versus lamivudine for patients with HBeAg-negative chronic hepatitis B. N Engl J Med. 2006;354:1011–20. doi: 10.1056/NEJMoa051287. [DOI] [PubMed] [Google Scholar]
- 57.Marcellin P, Heathcote EJ, Buti M, et al. Tenofovir disoproxil fumarate versus adefovir dipivoxil for chronic hepatitis B. N Engl J Med. 2008;359:2442–55. doi: 10.1056/NEJMoa0802878. [DOI] [PubMed] [Google Scholar]
- 58.Lau GK, Piratvisuth T, Luo KX, et al. Peginterferon alfa-2a, lamivudine, and the combination for HBeAg-positive chronic hepatitis B. N Engl J Med. 2005;352:2682–95. doi: 10.1056/NEJMoa043470. [DOI] [PubMed] [Google Scholar]
- 59.Marcellin P, Lau GK, Bonino F, et al. Peginterferon alfa-2a alone, lamivudine alone, and the two in combination in patients with HBeAg-negative chronic hepatitis B. N Engl J Med. 2004;351:1206–17. doi: 10.1056/NEJMoa040431. [DOI] [PubMed] [Google Scholar]
- 60.Jacobs RJ, Saab S, Meyerhoff AS. The cost effectiveness of hepatitis immunization for US college students. J Am Coll Health. 2003;51:227–36. doi: 10.1080/07448480309596355. [DOI] [PubMed] [Google Scholar]
- 61.Gagnon YM, Levy AR, Iloeje UH, Briggs AH. Treatment costs in Canada of health conditions resulting from chronic hepatitis B infection. J Clin Gastroenterol. 2004;38(10 Suppl 3):S179–86. doi: 10.1097/00004836-200411003-00011. [DOI] [PubMed] [Google Scholar]
- 62.Common Drug Review Drug Database Canadian Agency for Drugs and Technologies in Health 2009. [PubMed]
- 63.Buti M, Brosa M, Casado MA, Rueda M, Esteban R. Modeling the cost-effectiveness of different oral antiviral therapies in patients with chronic hepatitis B. J Hepatol. 2009;51:640–6. doi: 10.1016/j.jhep.2009.04.013. [DOI] [PubMed] [Google Scholar]
- 64.Veenstra DL, Sullivan SD, Dusheiko GM, et al. Cost-effectiveness of peginterferon alpha-2a compared with lamivudine treatment in patients with HBe-antigen-positive chronic hepatitis B in the United Kingdom. Eur J Gastroenterol Hepatol. 2007;19:631–8. doi: 10.1097/MEG.0b013e3281108079. [DOI] [PubMed] [Google Scholar]
- 65.Ontario Ministry of Health and Long-Term Care . Schedule of Laboratory Fees. Toronto: Ontario Ministry of Health and Long-Term Care; 1999. < www.health.gov.on.ca/english/providers/program/ohip/sob/lab/lab_services_sched_01_19990401.pdf> (Accessed February 1, 2010). [Google Scholar]