

Abstract
Celiac disease is a common autoimmune disorder characterized by an intestinal inflammation triggered by gluten, a storage protein found in wheat, rye and barley. Similar to other autoimmune diseases such as type 1 diabetes, psoriasis and rheumatoid arthritis, celiac disease is the result of an immune response to self-antigens leading to tissue destruction and production of autoantibodies. Common diseases like celiac disease have a complex pattern of inheritance with inputs from both environmental as well as additive and non-additive genetic factors. In the past few years, Genome Wide Association Studies (GWAS) have been successful in finding genetic risk variants behind many common diseases and traits. To complement and add to the previous findings, we performed a GWAS including 206 trios from 97 nuclear Swedish and Norwegian families affected with celiac disease. By stratifying for HLA-DQ, we identified a new genome-wide significant risk locus covering the DUSP10 gene. To further investigate the associations from the GWAS we performed pathway analyses and two-locus interaction analyses. These analyses showed an over-representation of genes involved in type 2 diabetes and identified a set of candidate mechanisms and genes of which some were selected for mRNA expression analysis using small intestinal biopsies from 98 patients. Several genes were expressed differently in the small intestinal mucosa from patients with celiac autoimmunity compared to intestinal mucosa from control patients. From top-scoring regions we identified susceptibility genes in several categories: 1) polarity and epithelial cell functionality; 2) intestinal smooth muscle; 3) growth and energy homeostasis, including proline and glutamine metabolism; and finally 4) innate and adaptive immune system. These genes and pathways, including specific functions of DUSP10, together reveal a new potential biological mechanism that could influence the genesis of celiac disease, and possibly also other chronic disorders with an inflammatory component.
Introduction
Celiac disease (CD) is a common chronic disease and even though most often diagnosed in early childhood, it can present itself at any age. Most of the individuals with CD remain undiagnosed and an estimated 2% of the Swedish population is affected without having been diagnosed [1]. Ongoing disease will increase the overall risk for developing other chronic inflammatory diseases, neurological manifestations and malnutrition disorders. CD is the only autoimmune disorder where the actual genes responsible for the association in HLA are known (HLA-DQA1 and HLA-DQB1) [2]. In the past few years Genome Wide Association Studies (GWAS) have had tremendous success in identifying new genes, or gene regions, that influence common diseases. These studies use several hundreds of thousands of genetic markers (single nucleotide polymorphisms, SNPs) across all human chromosomes in order to pin down the chromosomal locations of genes, which could influence the disease.
A large joint effort has been done, not the least in CD, and 40 new CD-associated genetic regions marked by SNPs have been discovered [3]–[7]. However, these genes cannot account for all CD heritability, and part of the genetic variance that influences disease development is still unknown [8].
Most GWAS so far have been performed on case control samples. A case control study design has some advantages compared to using a family study design. For example, in a case control design it is possible to select a perfectly matched set of controls to increase the chance of discovering susceptibility genes, and furthermore, cases and controls are usually easier to collect than individuals from the same family. However, using a family material can be a very good complement to a case control design. First of all, families with several affected members are likely to have a stronger genetic component compared to sporadic cases. Familial cases tend to be enriched for disease-predisposing alleles and there is an increased power especially for detecting rare genetic variants [9]. Another important fact is that statistical analyses based on family data are robust against population stratification. Already in their paper from 1996, Risch and Merikangas suggested that all sib-pair families collected for non-parametric linkage analysis in complex diseases, should be re-run “Genome-Wide” using SNP markers and the potentially more powerful Transmission Disequilibrium Test (TDT) [10]. The TDT test in sib-pairs is a test of linkage in the presence of association. Hereafter we refer to whole genome sibling TDT as “Linkage GWAS”.
In this study, we aimed to uncover additional genetic factors in CD by performing a Linkage GWAS using 206 affected children (sib-pairs) within 97 nuclear families using the TDT test. In addition to the Linkage GWAS we explored gene-gene interactions and pathway analyses. We also performed a non-parametric linkage (NPL) analysis and compared the results with the published linkage analysis, with microsatellite markers, performed in the same set of families previously [11]. Furthermore, quantitative PCR was used to investigate levels of gene expression in small intestinal biopsies from additional patients with CD autoimmunity (CAI) and control patients. Finally, we stratified the TDT analysis on HLA genotype. It has been shown that carrying DQB1*02 on both chromosomes (i.e. being homozygous), confers higher risk of developing CD as compared to heterozygote individuals [12]. It is therefore conceivable that heterozygote individuals may require more additional risk factors outside HLA, in order to accumulate sufficient risk to develop CD, compared with homozygous individuals. Based on this assumption we stratified the patient in an HLA low-risk group and an HLA high-risk group. By stratifying the Linkage GWAS, we expected to uncover even more of the so-called “missing heritability” in CD. This strategy could identify different risk factors all together or perhaps a more likely scenario is that the same risk factors outside HLA would just be more common in the HLA low-risk group.
Results
Genotyping and Imputation
We included single nucleotide polymorphism (SNP) markers that had a call rate above 97%, which led to the exclusion of 1.3% of the Omni Express and 0.6% of the 660W-Quad SNP markers. Out of the 127,535,126 imputed genotypes, 88.3% had a posterior probability of over 0.95. Approximately 90% of the 944,512 SNP markers had a minor allele frequency of at least 0.01 after imputation.
Transmission Disequilibrium Test (TDT)
All markers from the TDT analysis are shown in Figure 1a. As expected, the region around the CD associated HLA genes on chromosome 6 showed the strongest association with the most significant p-value reaching 4.9×10⁻²¹ at marker rs424232. In Table 1, we present the 35 most significant associations found outside of HLA (HLA defined as SNP markers located within 27–34 Mb on chromosome 6). The most significant finding outside of the HLA region was the marker rs12734338 on chromosome 1, including the PPP1R12B gene.
Figure 1. Manhattanplot of the TDT p-values.

a) The location of all genotyped SNPs on chromosomes 1–22 and X plotted on the x-axis. –log10(p-value) result for each SNP and all transmissions on the y-axis. b) The location of all genotyped SNPs on chromosomes 1–22 and X plotted on the x-axis. –log10(p-value) result for each SNP and all transmissions, to children in the low risk group, on the y-axis. c) Regional plot of association results and recombination rates, within the region surrounding DUSP10, generated by SNAP (http://www.broadinstitute.org/mpg/snap/ldplot.php). The x-axis show 500 kb around the most associated SNP. Genomic locations of genes within the region of interest (NCBI Build 36 human assembly) were annotated from the UCSC Genome Browser (arrows). The left y-axis show –log10(p-value) and estimated recombination rates (cM/Mb) from HapMap Project (NCBI Build 36) are shown in light blue lines.
Table 1. Transmission Disequilibrium Test (TDT).
| TDT (PLINK) | exp TDT | |||||||||||||
| Chr | SNP | Genes | BP | A1 | A2 | T | U | p-value | T | U | T/U | p-value | NPL | GWAS catalog |
| 1 | rs12734338 | PPP1R12B SYT2 UBE2T | 200736346 | C | T | 39 | 90 | 7.11E-06 | 61.44 | 132.45 | 0.46 | 3.41E-07 | 0,0095 | |
| 10 | rs10886159 | EMX2OS RAB11FIP2 EMX2 | 119603600 | C | T | 24 | 50 | 2.51E-03 | 40.16 | 98.48 | 0.41 | 7.30E-07 | 0,19* | |
| 21 | rs10439884 | BAGE2 TPTE BAGE | 9993822 | A | G | 10 | 23 | 2.36E-02 | 15.52 | 55.78 | 0.28 | 1.86E-06 | 0,22* | |
| 14 | rs1958589 | EAPP SNX6 C14orf147 | 33914127 | C | T | 15 | 36 | 3.28E-03 | 27.25 | 73.64 | 0.37 | 3.87E-06 | 0,32* | |
| 17 | rs17760268 | ANKFN1 NOG | 51966290 | C | T | 27 | 11 | 9.44E-03 | 57.24 | 17.45 | 3.28 | 4.13E-06 | 0,33* | Cannabis depend./height |
| 4 | rs1032355 | RG9MTD2 C4orf17 MTTP | 100758919 | C | T | 33 | 81 | 6.94E-06 | 35.07 | 85.28 | 0.41 | 4.74E-06 | 0,0069 * | |
| 22 | rs4911642 | CCT8L2 psiTPTE22 | 14884399 | C | T | 20 | 38 | 1.81E-02 | 34.38 | 84.15 | 0.41 | 4.86E-06 | 0,21* | HIV-1 viral setpoint |
| 20 | rs157640 | DOK5 | 52847946 | G | T | 71 | 135 | 8.23E-06 | 72 | 138 | 0.52 | 5.25E-06 | 0,38 | Functional MRI |
| 1 | rs2068824 | NAV1 | 199861288 | C | T | 2 | 16 | 9.67E-04 | 6.83 | 36.77 | 0.19 | 5.75E-06 | 0,014* | |
| 3 | rs2605393 | STAC | 36384605 | G | T | 40 | 83 | 1.06E-04 | 58.52 | 118.88 | 0.49 | 5.86E-06 | 0,13* | |
| 19 | rs2664156 | KLK2 KLK3 KLKP1 KLK4 KLK15 | 56068975 | C | T | 48 | 16 | 6.33E-05 | 91.96 | 40.01 | 2.30 | 6.13E-06 | 0,34* | Prostate cancer |
| 16 | rs195656 | HYDIN | 69604985 | A | G | 18 | 34 | 2.65E-02 | 29.79 | 76.09 | 0.39 | 6.83E-06 | 0,52* | |
| 11 | rs4930144 | IGF2AS TH MRPL23 TNNT3 SYT8 ASCL2 TNNI2LSP1 IGF2 INS-IGF2 INS H19 | 2005064 | A | G | 62 | 32 | 1.97E-03 | 116.06 | 57.04 | 2.03 | 7.28E-06 | 0,38* | Prostate cancer/Type 1 diabetes |
| 4 | rs17029173 | RG9MTD2 C4orf17 MTTP | 100728344 | G | T | 27 | 70 | 1.27E-05 | 27.06 | 71.49 | 0.38 | 7.65E-06 | 0,0069 * | |
| 4 | rs13128441 | STK32B | 5213290 | C | T | 32 | 77 | 1.63E-05 | 32 | 79 | 0.41 | 8.16E-06 | 0,74* | Coronary heart disease |
| 3 | rs1871350 | STAC | 36348769 | C | T | 27 | 69 | 1.81E-05 | 27.06 | 71.19 | 0.38 | 8.49E-06 | 0,13* | |
| 3 | rs2046000 | STAC | 36327368 | A | C | 28 | 72 | 1.08E-05 | 28.05 | 72.46 | 0.39 | 9.42E-06 | 0,13* | |
| 17 | rs7209752 | CCDC144C LOC284194 SPECC1 AKAP10 | 19909989 | A | G | 9 | 26 | 4.06E-03 | 12.61 | 46.46 | 0.27 | 1.06E-05 | 0,75* | |
| 1 | rs3795277 | KIAA1751 PRKCZ GABRD | 1970978 | A | C | 20 | 8 | 2.33E-02 | 46.62 | 12.76 | 3.65 | 1.11E-05 | 0,52* | Reasoning/height |
| 2 | rs10203748 | TGFBRAP1 C2orf49 NCK2 FHL2 GPR45 | 105442542 | C | T | 20 | 43 | 3.76E-03 | 23.93 | 65.35 | 0.37 | 1.17E-05 | 0,013* | AIDS |
| 11 | rs318966 | NTM | 130871348 | A | G | 15 | 42 | 3.49E-04 | 33.86 | 80.79 | 0.42 | 1.17E-05 | 0,015* | Asperger disorder |
| 6 | rs9402234 | TMEM200A SAMD3 | 130869175 | C | T | 17 | 7 | 4.12E-02 | 49.86 | 14.87 | 3.35 | 1.37E-05 | 0,38* | height |
| 9 | rs1536689 | C9orf93 BCN2a | 16119630 | A | G | 42 | 18 | 1.95E-03 | 97.95 | 46.04 | 2.13 | 1.52E-05 | 0,097* | HbA1c/glucose lecvels |
| 4 | rs6838036 | DC2 AGXT2L1 RPL34 | 109630528 | A | C | 106 | 57 | 1.24E-04 | 127.72 | 67.47 | 1.89 | 1.62E-05 | 0,0048 * | |
| 3 | rs17283813 | LPP | 190122389 | A | G | 11 | 26 | 1.37E-02 | 17.51 | 53.96 | 0.32 | 1.62E-05 | 0,082* | IgE/vitiligo/Celiac |
| 3 | rs1871352 | STAC | 36329541 | A | C | 27 | 69 | 1.81E-05 | 27.99 | 70.79 | 0.40 | 1.66E-05 | 0,13* | |
| 1 | rs12747934 | FOXD3 | 63540185 | A | G | 20 | 57 | 2.48E-05 | 24.88 | 65.59 | 0.38 | 1.87E-05 | 0,68* | |
| 1 | rs4323662 | LOC100288079 IVNS1ABP | 183697117 | G | T | 41 | 22 | 1.67E-02 | 98.41 | 46.85 | 2.10 | 1.89E-05 | 0,032* | |
| 3 | rs1842149 | STAC | 36366714 | G | T | 51 | 17 | 3.74E-05 | 61.29 | 22.22 | 2.76 | 1.91E-05 | 0,13* | |
| 19 | rs3814892 | PALM HCN2 C19orf21 POLRMT FSTL3 PRSSL1 RNF126 FGF22 | 589853 | A | G | 11 | 31 | 2.03E-03 | 23.45 | 63.03 | 0.37 | 2.08E-05 | 0,88* | |
| 3 | rs12631757 | THRB | 24618577 | C | T | 38 | 15 | 1.58E-03 | 80.09 | 34.53 | 2.32 | 2.09E-05 | 0,22* | Hematol. and biochem. traits |
| 10 | rs7097380 | SORCS1 | 108671659 | A | G | 118 | 60 | 1.38E-05 | 119 | 62 | 1.92 | 2.27E-05 | 0,20* | HbA1c/glucose lecvels |
| 1 | rs12734001 | PPP1R12B SYT2 UBE2T | 200657537 | C | T | 75 | 40 | 1.10E-03 | 129.09 | 69.46 | 1.86 | 2.32E-05 | 0,012* | |
| 10 | rs17094083 | GFRA1 | 117850841 | C | T | 27 | 68 | 2.59E-05 | 30.84 | 74.17 | 0.42 | 2.35E-05 | 0,27* | |
| 3 | rs12632771 | CX3CR1 | 39223856 | A | G | 36 | 8 | 2.43E-05 | 36 | 8 | 4.50 | 2.43E-05 | 0,21* | |
The top 35 associated SNPs are listed together with the surrounding genes defined by either Grail (www.broadinstitute.org/mpg/grail/) or the Genome Browser (http://genome.ucsc.edu/). The disease associations are acquired from the “Catalog of Published Genome-Wide Association Studies” (http://www.genome.gov/gwastudies/).
For PLINK: genotypes were imputed if any of the posterior probabilities were >0.95.
For expTDT: T and U are the expected transmission counts (based on all the posterior imputation probabilities).
NPL – the most significant Non Parametric Linkage (NPL) p-value for the same locus as the SNP. P-values below 0.05 are marked in italics.
T and U – the number of heterozygous parents who transmit the alleles A1 and A2, respectively. T/U – transmission odds based on the expected transmission counts.
the marker in the set of SNPs from the linkage analysis closest to the marker in the SNP column (when this marker was not run in the linkage analysis).
closest known gene. located >500 kb from associated SNP.
HLA Stratified Transmission Disequilibrium Test (TDT)
In Figure 1b and Table 2, we present results from the TDT analysis stratified on the HLA-DQ risk factor. For this analysis 115 affected offspring trios were included in the “low-risk” group and 88 trios were put in the “high-risk” group. A region including the DUSP10 gene (also known as MKP5) reached genome-wide significance (p-value = 3.8×10⁻⁸) in the low-risk group. Figure 1c presents this region including the most associated SNPs plotted on the x-axis using SNAP.
Table 2. HLA stratified Transmission Disequilibrium Test (TDT).
| High Risk | Low risk | All | |||||||||||||||||||||||||
| Chr | SNP | gene(s) | BP | A1 | A2 | T | U | T/U | chisq | p-value | T | U | T/U | chisq | p-value | weighted chisq | T | U | T/U | chisq | P-value | ||||||
| 1 | rs12144971 | DUSP10 | 220099108 | C | T | 26 | 35 | 0.74 | 1.33 | 2.49E-01 | 87 | 28 | 3.11 | 30.27 | 3.76E-08 | 20.24 | 116 | 64 | 1.81 | 15.02 | 1.06E-04 | ||||||
| 1 | rs4240931 | DUSP10 | 220105678 | T | C | 26 | 35 | 0.74 | 1.33 | 2.49E-01 | 87 | 28 | 3.11 | 30.27 | 3.76E-08 | 20.24 | 116 | 64 | 1.81 | 15.02 | 1.06E-04 | ||||||
| 10 | rs1247697 | SVIL | 29901347 | C | A | 41 | 35 | 1.17 | 0.47 | 4.91E-01 | 22 | 69 | 0.32 | 24.27 | 8.35E-07 | 13.44 | 63 | 104 | 0.61 | 10.07 | 1.51E-03 | ||||||
| 1 | rs4846734 | DUSP10 | 220139621 | G | A | 20 | 25 | 0.80 | 0.55 | 4.56E-01 | 53 | 15 | 3.53 | 21.24 | 4.06E-06 | 13.00 | 76 | 41 | 1.85 | 10.47 | 1.21E-03 | ||||||
| 10 | rs7097380 | SORCS1 | 108671659 | A | G | 46 | 34 | 1.35 | 1.8 | 1.80E-01 | 72 | 26 | 2.77 | 21.59 | 3.37E-06 | 12.70 | 118 | 60 | 1.97 | 18.90 | 1.38E-05 | ||||||
| 2 | rs6755308 | PRKCE | 46083771 | A | G | 11 | 33 | 0.33 | 11 | 9.11E-04 | 32 | 8 | 4.00 | 14.40 | 1.48E-04 | 12.62 | 43 | 41 | 1.05 | 0.05 | 8.27E-01 | ||||||
| 1 | rs11811613 | DUSP10 | 220122026 | G | A | 19 | 25 | 0.76 | 0.82 | 3.66E-01 | 54 | 17 | 3.18 | 19.28 | 1.13E-05 | 12.22 | 76 | 43 | 1.77 | 9.15 | 2.49E-03 | ||||||
| 2 | rs13017044 | PRKCE | 46086853 | A | G | 12 | 39 | 0.31 | 14.29 | 1.56E-04 | 43 | 18 | 2.39 | 10.25 | 1.37E-03 | 12.09 | 55 | 57 | 0.96 | 0.04 | 8.50E-01 | ||||||
| 10 | rs11193120 | SORCS1 | 108678768 | G | A | 50 | 35 | 1.43 | 2.64 | 1.04E-01 | 70 | 26 | 2.69 | 20.17 | 7.10E-06 | 11.94 | 120 | 61 | 1.97 | 19.23 | 1.16E-05 | ||||||
| 1 | rs11102146 | KCNA3 | 111007559 | C | T | 13 | 17 | 0.76 | 0.53 | 4.65E-01 | 48 | 15 | 3.20 | 17.29 | 3.22E-05 | 11.88 | 61 | 34 | 1.79 | 7.67 | 5.60E-03 | ||||||
| 10 | rs4748417 | STAM TMEM236 | 17819812 | T | C | 2 | 0 | NA | 2 | 1.57E-01 | 18 | 2 | 9.00 | 12.80 | 3.47E-04 | 11.82 | 20 | 2 | 10.0 | 14.73 | 1.24E-04 | ||||||
| 2 | rs4972810 | DLX1 DLX2 PDK1 MAP1D ITGA6 | 172926135 | A | G | 15 | 11 | 1.36 | 0.61 | 4.33E-01 | 41 | 11 | 3.73 | 17.31 | 3.18E-05 | 11.74 | 56 | 22 | 2.55 | 14.82 | 1.18E-04 | ||||||
| 3 | rs1871352 | STAC | 36329541 | A | C | 15 | 25 | 0.60 | 2.5 | 1.14E-01 | 12 | 44 | 0.27 | 18.29 | 1.90E-05 | 11.71 | 27 | 69 | 0.39 | 18.38 | 1.81E-05 | ||||||
| 3 | rs1871350 | STAC | 36348769 | C | T | 15 | 25 | 0.60 | 2.5 | 1.14E-01 | 12 | 44 | 0.27 | 18.29 | 1.90E-05 | 11.71 | 27 | 69 | 0.39 | 18.38 | 1.81E-05 | ||||||
| 10 | rs10884387 | SORCS1 | 108682142 | T | C | 43 | 33 | 1.30 | 1.32 | 2.51E-01 | 71 | 27 | 2.63 | 19.76 | 8.80E-06 | 11.70 | 114 | 60 | 1.90 | 16.76 | 4.25E-05 | ||||||
| 3 | rs2046000 | STAC | 36327368 | A | C | 15 | 27 | 0.56 | 3.43 | 6.41E-02 | 13 | 45 | 0.29 | 17.66 | 2.65E-05 | 11.68 | 28 | 72 | 0.39 | 19.36 | 1.08E-05 | ||||||
| 1 | rs12734338 | PPP1R12B SYT2 UBE2T | 200736346 | C | T | 20 | 36 | 0.56 | 4.57 | 3.25E-02 | 18 | 53 | 0.34 | 17.25 | 3.27E-05 | 11.66 | 39 | 90 | 0.43 | 20.16 | 7.11E-06 | ||||||
| 22 | rs1296826 | BID BCL2L13 SLC25A18 ATP6V1E1 | 16459518 | C | T | 3 | 9 | 0.33 | 3 | 8.33E-02 | 3 | 23 | 0.13 | 15.38 | 8.77E-05 | 11.47 | 6 | 32 | 0.19 | 17.79 | 2.47E-05 | ||||||
| 4 | rs7687176 | INTS12 GSTCD | 106746555 | T | C | 10 | 7 | 1.43 | 0.53 | 4.67E-01 | 2 | 24 | 0.08 | 18.62 | 1.60E-05 | 11.47 | 12 | 31 | 0.39 | 8.40 | 3.76E-03 | ||||||
| 2 | rs4972809 | DLX1 DLX2 PDK1 MAP1D ITGA6 | 172925337 | A | G | 16 | 12 | 1.33 | 0.57 | 4.50E-01 | 41 | 11 | 3.73 | 17.31 | 3.18E-05 | 11.45 | 57 | 23 | 2.48 | 14.45 | 1.44E-04 | ||||||
| 6 | rs13207543 | ELOVL4 SH3BGRL2 TTK | 80592601 | A | C | 13 | 26 | 0.50 | 4.33 | 3.74E-02 | 52 | 19 | 2.74 | 15.34 | 8.99E-05 | 11.44 | 65 | 45 | 1.44 | 3.64 | 5.65E-02 | ||||||
| 4 | rs1032355 | RG9MTD2 C4orf17 MTTP | 100758919 | C | T | 9 | 42 | 0.21 | 21.35 | 3.82E-06 | 24 | 37 | 0.65 | 2.77 | 9.60E-02 | 11.23 | 33 | 81 | 0.41 | 20.21 | 6.94E-06 | ||||||
| 5 | rs11952677 | SCAMP1 LHFPL2 | 77823690 | G | A | 27 | 34 | 0.79 | 0.80 | 3.70E-01 | 55 | 17 | 3.24 | 20.06 | 7.52E-06 | 11.23 | 84 | 51 | 1.65 | 8.07 | 4.51E-03 | ||||||
| 1 | rs12743521 | DUSP10 | 220167571 | A | G | 21 | 24 | 0.88 | 0.2 | 6.55E-01 | 50 | 15 | 3.33 | 18.85 | 1.42E-05 | 11.22 | 74 | 40 | 1.85 | 10.14 | 1.45E-03 | ||||||
| 12 | rs11068315 | FBXW8 HRK TESC RNFT2 | 115994935 | T | C | 8 | 6 | 1.33 | 0.28 | 5.93E-01 | 4 | 26 | 0.15 | 16.13 | 5.90E-05 | 11.09 | 12 | 32 | 0.38 | 9.09 | 2.57E-03 | ||||||
| 6 | rs7745052 | FBXL4 C6orf168 USP45 COQ3 POU3F2 SFRS18 | 99747331 | A | G | 54 | 17 | 3.18 | 19.28 | 1.13E-05 | 32 | 25 | 1.28 | 0.86 | 3.54E-01 | 11.08 | 86 | 42 | 2.05 | 15.12 | 1.01E-04 | ||||||
| 12 | rs17245501 | PPFIA2 | 80260470 | C | T | 17 | 18 | 0.94 | 0.028 | 8.66E-01 | 45 | 13 | 3.46 | 17.66 | 2.65E-05 | 11.02 | 62 | 31 | 2.00 | 10.33 | 1.31E-03 | ||||||
| 1 | rs7544501 | DUSP10 | 220168985 | T | C | 21 | 24 | 0.88 | 0.2 | 6.55E-01 | 51 | 16 | 3.19 | 18.28 | 1.90E-05 | 11.02 | 75 | 41 | 1.83 | 9.97 | 1.60E-03 | ||||||
| 1 | rs785627 | LPHN2 | 82521165 | T | C | 30 | 17 | 1.77 | 3.60 | 5.79E-02 | 25 | 61 | 0.41 | 15.07 | 1.04E-04 | 11.02 | 56 | 79 | 0.71 | 3.92 | 4.78E-02 | ||||||
| 8 | rs720131 | RAD21 | 117985196 | A | G | 35 | 40 | 0.88 | 0.33 | 5.64E-01 | 79 | 34 | 2.32 | 17.92 | 2.30E-05 | 10.90 | 115 | 75 | 1.53 | 8.42 | 3.71E-03 | ||||||
| 12 | rs11104365 | MGAT4C | 86164650 | C | T | 41 | 57 | 0.72 | 2.61 | 1.06E-01 | 34 | 79 | 0.43 | 17.92 | 2.30E-05 | 10.81 | 77 | 136 | 0.57 | 16.34 | 5.29E-05 | ||||||
| 14 | rs7144018 | NAT12 EXOC5 C14orf108 | 56676820 | C | T | 29 | 3 | 9.67 | 21.12 | 4.30E-06 | 14 | 20 | 0.70 | 1.06 | 3.04E-01 | 10.79 | 45 | 23 | 1.96 | 7.12 | 7.63E-03 | ||||||
The top 32 associated SNPs from the results of the HLA stratified analysis. Surrounding genes are defined by either Grail (www.broadinstitute.org/mpg/grail/) or the Genome Browser (http://genome.ucsc.edu/). The low risk group consists of 115 trios and the high risk group of 88 trios. Genotypes were imputed if any of the posterior probabilities were >0.95.
Chisq – the value of the TDT test statistic for the transmission counts.
Weighted Chisq – based on the transmission counts of the low and high-risk groups. This value is used for ranking the results.
T and U – the number of heterozygous parents who transmit the alleles A1 and A2, respectively. T/U – transmission odds based on the expected transmission counts.
Interaction Analyses
Since some markers just below genome-wide significance are still expected to be true findings, we wanted to try and separate these from the, in fact, true negative findings (those that show linkage and association close to genome-wide significance just by chance). In total, 603 SNP markers from 383 independent regions and their surrounding genes were identified by three inclusion criteria (Fig. 2 and Table S1). These genes were subsequently used for pathway and two-locus interaction analyses.
Figure 2. Illustration of the three inclusion criteria used for pathway and interaction analyses.

The first criteria of p-values less than 3.0×10⁻⁴ in the linkage TDT analysis resulted in a total of 477 markers. The second criteria included a comparison of the results from this study with the results from the study by Dubois et al. [3]. We included 118 SNPs that had a simple score based on a combined p-value less than 5.0×10⁻⁵ and in the same allelic direction in both datasets. The third criteria involved selecting markers with a large effect size. We included 65 markers which had a ratio of transmitted versus not transmitted (T/NT) alleles of over 5 or below 0.2, combined with a p-value of less than 2.0×10⁻³.
Two-locus interaction analysis
Two-locus interaction analysis, identified 582 SNP pairs with a p-value of less than 1.0×10⁻⁴ for the test comparing the model M0 of no association and the general two-locus model MG. Out of these, 101 pairs from 87 regions deviated significantly (p<0.05) from a purely multiplicative model (MM), which is the best fitting model when at least one of the SNP markers is false. Under the null hypothesis we expect to find 29 such pairs. The 101 pairs showed either epistasis (individuals carry both risk alleles) or evidence of heterogeneity (individuals carry either the one or the other risk allele from the two loci).
The results with a p-value <1.0×10⁻⁴ for epistasis and those with high p-value (>0.05), which represent pairs that did not show convincing deviation from the heterogeneity model are listed in Table 3 and 4. Several loci were in an epistatic relationship with HLA; rs4899272 (ACTN1), rs1073933 (COX7C), rs10482751 (TGFB2), rs571879 (APPL1) and rs7590305 (FABP1). Also, previously identified susceptibility loci for CD were involved in several interactions: rs4899272 (ACTN1), rs6741418 (STAT1, GLS), rs13096142 (CCR1,2,3,5), rs10197319 (ICOS, CTLA4) and rs870875 (CD247).
Table 3. The top epistasis interaction results from the 101 two-locus interaction analysis.
| Snp 1 | Genes | chr | Snp 2 | Genes | chr | N | P02 | P12 | PM2 |
| rs2187668 | HLADQ | 6 | rs4899272 | ACTN1 | 14 | 95 | 4.0E-17 | 1.42E-13 | 4.E-02 |
| rs204034 | SHISA9 | 16 | 94 | 1.3E-14 | 1.09E-12 | 5.E-02 | |||
| rs571879 | APPL1 HESX1 IL17RD. DNHD2. ASB14 | 3 | 94 | 2.3E-15 | 5.21E-11 | 3.E-02 | |||
| rs204999 | HLA | 6 | rs1073933 | COX7C | 5 | 94 | 9.9E-14 | 9.27E-12 | 3.E-02 |
| rs11836636 | ATXN7L3B KCNC2 | 12 | 91 | 1.1E-12 | 8.15E-11 | 4.E-02 | |||
| rs7745052 | FBXL4. C6orf168. USP45. COQ3. POU3F2. SFRS18 | 6 | 92 | 2.3E-05 | 1.79E-05 | 4.E-02 | |||
| rs10749738 | FOXD3 | 1 | rs1373649 | BMPR1B | 4 | 93 | 2.7E-05 | 1.78E-05 | 4.E-02 |
| rs3860295 | RASSF5 IKBKE | 1 | rs13096142 | CCR5 CCR3 LTF CCR2 CCR1 | 3 | 95 | 1.1E-05 | 6.48E-06 | 1.E-02 |
| rs9396802 | KIF13A NUP153 FAM8A1 | 6 | rs2194633 | NETO1 | 18 | 95 | 3.8E-06 | 6.82E-06 | 2.E-02 |
| rs9296204 | MTCH1 PI16 | 6 | rs4385459 | LY96 JPH1 GDAP1 TMEM70 TCEB1 | 8 | 95 | 2.8E-05 | 9.91E-06 | 3.E-02 |
| rs9397928 | ARID1B* | 6 | rs2415836 | FSCB* | 14 | 93 | 2.8E-05 | 1.75E-05 | 3.E-03 |
| rs1145212 | APOA5 ZNF259 BUD13 | 11 | rs10083673 | MYO5A | 15 | 95 | 6.6E-05 | 1.77E-05 | 2.E-03 |
| rs7756191 | DNAH8 | 6 | rs1108001 | NAV2 HTATIP2 DBX1 PRMT3 | 11 | 95 | 3.5E-05 | 2.60E-05 | 3.E-03 |
| rs10197319 | ICOS CTLA4 | 2 | rs882820 | SRL TFAP4 | 16 | 94 | 1.4E-05 | 3.03E-05 | 3.E-05 |
| rs4899272 | ACTN1 | 14 | rs17703807 | C15orf41 | 15 | 83 | 2.9E-05 | 8.68E-05 | 1.E-02 |
All SNP pairs which reached an interaction p-value of P12<1.0×10⁻⁴, in addition to PM2<0.05.
closest known gene. located >500 kb from associated SNP.
P02– p-value for the test statistic comparing the models M0 (no association) and the general model MG.
P12– p-value for the test test comparing the models MR (heterogeneity) and the general model MG.
PM2– p-value for the test comparing the models MM (multiplicative) and the general model MG.
Table 4. The top heterogeneity results from the 101 two-locus interaction analysis.
| SNP1 | Genes | chr | SNP2 | Genes | chr | N | P02 | P12 | PM2 |
| rs4899272 | ACTN1 | 14 | rs4820682 | SRRD HPS4 TFIP11 ASPHD2 MIR548JTPST2 CRYBB1 CRYBA4 | 22 | 95 | 7.1E-06 | 6.97E-02 | 2.E-02 |
| rs4426448 | DOK6 | 18 | 94 | 9.5E-06 | 6.80E-01 | 1.E-02 | |||
| rs870875 | CD247 | 1 | 94 | 9.4E-05 | 7.19E-02 | 3.E-02 | |||
| rs4842007 | PAEP | 9 | 95 | 8.6E-06 | 5.66E-01 | 4.E-02 | |||
| rs571879 | APPL1 HESX1 IL17RDDNHD2 ASB14 | 3 | rs4385459 | LY96 JPH1 GDAP1 TMEM70 TCEB1 | 8 | 94 | 4.1E-05 | 5.81E-01 | 5.E-02 |
| rs7590305 | FABP1 THNSL2 | 2 | rs390495 | MICAL3 | 22 | 93 | 7.0E-05 | 9.09E-01 | 3.E-03 |
| rs7745052 | FBXL4 C6orf168 USP45COQ3 POU3F2 SFRS18 | 6 | rs4930144 | IGF2AS TH MRPL23 TNNT3 SYT8 ASCL2TNNI2 LSP1 IGF2 INS-IGF2 INS H19 | 11 | 50 | 1.9E-05 | 5.30E-01 | 3.E-02 |
| rs10749738 | FOXD3 | 1 | rs10498982 | EPHA7* | 6 | 93 | 2.0E-05 | 1.95E-01 | 4.E-02 |
| rs2605393 | STAC | 3 | 63 | 7.3E-05 | 4.37E-01 | 4.E-02 | |||
| rs2187668 | HLADQ | 6 | rs11013804 | KIAA1217 | 10 | 94 | 3.5E-14 | 8.40E-02 | 2.E-02 |
| rs1676235 | ESRRB ANGEL1 VASH1 | 14 | 43 | 2.0E-07 | 8.55E-02 | 3.E-02 | |||
| rs958802 | KANK4 L1TD1 INADL | 1 | rs2194633 | NETO1 | 18 | 95 | 1.9E-05 | 5.55E-01 | 3.E-02 |
| rs2345981 | KHDRBS2 | 6 | rs6495130 | RYR3 | 15 | 94 | 6.1E-05 | 1.58E-01 | 3.E-02 |
| rs11940562 | PCDH7* | 4 | rs4905043 | ITPK1 CHGA | 14 | 44 | 4.6E-05 | 2.77E-01 | 2.E-02 |
| rs4656538 | POU2F1 | 1 | rs2187668 | HLADQ | 6 | 94 | 3.0E-13 | 1.19E-01 | 5.E-02 |
| rs3860295 | RASSF5 IKBKE | 1 | rs7046385 | SMC2 | 9 | 94 | 5.3E-05 | 1.07E-01 | 2.E-02 |
| rs6741418 | STAT1 GLS STAT4 | 2 | rs10798004 | C1orf25 C1orf26 IVNS1ABP RNF2 | 1 | 87 | 7.2E-05 | 7.68E-02 | 4.E-02 |
| rs1571812 | VLDLR | 9 | 86 | 3.0E-05 | 9.19E-02 | 4.E-02 | |||
| rs882820 | SRL TFAP4 | 16 | 87 | 4.2E-05 | 3.52E-01 | 6.E-03 | |||
| rs1470379 | VIM | 10 | 82 | 1.0E-05 | 3.70E-01 | 8.E-03 | |||
| rs10946659 | DCDC2 NRSN1 | 6 | 87 | 1.9E-06 | 6.64E-01 | 9.E-03 | |||
| rs10482751 | TGFB2 | 1 | rs1571812 | VLDLR | 9 | 92 | 5.2E-05 | 1.86E-01 | 1.E-02 |
All SNP pairs which reached an interaction p-value of P12>0.05, in addition to PM2<0.05.
closest known gene located >500 kb from associated SNP.
P02– p-value for the test statistic comparing the models M0 (no association) and the general model MG.
P12– p-value for the test test comparing the models MR (heterogeneity) and the general model MG.
PM2– p-value for the test comparing the models MM (multiplicative) and the general model MG.
Pathway analysis
Biological functions clustered by Ingenuity Pathway Analysis (IPA) and Genetrail [13] are shown in Table 5, 6 and 7. Several clusters were significant after correction for multiple comparisons. The most significant network implicated by IPA included DUSP10 (Fig. 3 and Table 8). The second top network included the MHC complex (HLA) and the third top network included LPP, which is located within the most significantly non-HLA associated region identified in CD so far [3].
Table 5. Biological functions of genes surrounding the 603 top associated SNPs. Results from IPA.
| FunctionAnnotation | p-value(Raw) | B-H p-value* | Molecules | Molecules |
| non-insulin-dependent diabetes mellitus | 0.0000057 | 0.025 | ABCC8. ADRA1B. ADRA1D. AGT. APOA5. ATP10A. BCL2L11. CCR5. CD38. CNTNAP2. FOXP1. FTO. HFE. HFE2. INS. INSR. KCNJ11. KIRREL3. KLF10. mir-154. mir-448. MTTP. PBX3. PIEZO2. PPARA. PPP3CA. PRDM10. RGS5. VEGFA. ZMYM2 | 30 |
| quantity of metal | 0.0000082 | 0.025 | ABCC8. ADRA1B. AGT. APLP2. ATP2B3. BCL2. BMP2. BTK. CAMLG. CCR5. CD247. CD38. CHGA. CX3CR1. CXCL13. DARC. DCN. DVL1. EGF (includes EG:13645). FBXL5. FCER1A. GNA14. GNB1. HFE. HFE2. IGF2. INS. INSR. KCNJ11. LTF. NTS. NUCB2. POMC. PRL. PRNP. PTGDR2. RGS1. RYR3. SELL. SOD1. TRPM8. TXNIP. VAV3. VEGFA | 44 |
| incorporation of thymidine | 0.000010 | 0.025 | AGT. AKAP13. BMP2. CD40. EGF (includes EG:13645). IGF2. INS. INSR. PRL. THBS2. TNFSF13B. VEGFA. WT1 | 13 |
| quantity of Ca2+ | 0.000018 | 0.033 | ABCC8. ADRA1B. AGT. ATP2B3. BCL2. BTK. CAMLG. CCR5. CD247. CD38. CHGA. CX3CR1. CXCL13. DARC. DCN. DVL1. EGF (includes EG:13645). FCER1A. GNA14. GNB1. IGF2. INS. INSR. KCNJ11. NTS. NUCB2. POMC. PRL. PRNP. PTGDR2. RGS1. RYR3. SELL. SOD1. TRPM8. VAV3. VEGFA | 37 |
| eye development | 0.000022 | 0.033 | BID. BMPR1B. CD247. CHD7. CRYBB2. CX3CR1. DLX1. DNMT3A. EBF3. EGF (includes EG:13645). FJX1. FTO. GJA3. H19. HESX1. IFT88. IGF2. IRX3. ITGA6. LUM. MITF. OGN. PAX5. PROM1. PRRX2. PYGO1. SEMA5A. SOD1. STAT1. TGFB2. TH. THBS2. THRB. TUB. USH2A. VEGFA. WT1 | 37 |
| diabetes mellitus | 0.000027 | 0.034 | ABCC8. ABCG1. ABT1. ADRA1B. ADRA1D. AGT. APOA5. ATP10A. BCL2. BCL2L11. BTC. BTN2A1. BTN3A2. CBLB. CCR5. CD200. CD38. CD40. CNTNAP2. CYBA. E2F3. ENAH. FOXP1. FTO. GABRD. HFE. HFE2. HIST1H3A (includes others). HTR2C. ICOS. IGF2-AS1. INS. INSR. KCNJ11. KIRREL3. KLF10. mir-154. mir-448. MTTP. PBX3. PDE8A. PGM1. PIEZO2. PPARA. PPP3CA. PRDM10. PRSS16. PRUNE2. PXDNL. RGS1. RGS5. SELL. SOD1. TH. THRB. TSPO. VEGFA. ZMYM2 | 58 |
| angiogenesis of bone | 0.000032 | 0.034 | BMP2. NOG. TGFB2. VEGFA | 4 |
| quantity of metal ion | 0.000071 | 0.043 | ABCC8. ADRA1B. AGT. ATP2B3. BCL2. BTK. CAMLG. CCR5. CD247. CD38. CHGA. CX3CR1. CXCL13. DARC. DCN. DVL1. EGF (includes EG:13645). FCER1A. GNA14. GNB1. IGF2. INS. INSR. KCNJ11. NTS. NUCB2. POMC. PRL. PRNP. PTGDR2. RGS1. RYR3. SELL. SOD1. TRPM8. TXNIP. VAV3. VEGFA | 38 |
| development of head | 0.000069 | 0.043 | BCL2. BCL2L11. BID. BMP2. BMPR1B. CD247. CHD7. CRYBB2. CX3CR1. DLX1. DNMT3A. EBF3. EGF (includes EG:13645). FJX1. FTO. GJA3. H19. HESX1. IFT88. IGF2. IRX3. ITGA6. LUM. MITF. MYO5A. NOG. OGN. PAX5. PROM1. PRRX2. PYGO1. SEMA5A. SOD1. STAT1. TGFB2. TH. THBS2. THRB. TUB. USH2A. VEGFA. WT1 | 42 |
| migration of cells | 0.000057 | 0.043 | ADI1 (includes EG:104923). AGT. APLP2. APPL1. ARHGAP5. B3GAT1. BCL2. BGN. BID. BMP2. BTC. BTK. CBLB. CCR5. CD200. CD247. CD36. CD38. CD40. CD99. CHGA. CMA1. CNTNAP2. CSF2RA. CTBP2. CTNNA2. CTSG. CX3CR1. CXCL13. DARC. DCDC2. DCN. DISC1. DLX1. DYX1C1. E2F3. EBF3. EGF (includes EG:13645). ELMO2. FCER1A. FH. FHL2. GFRA1. GNA12. GRIA2. GZMB. HTATIP2. ICOS. IGF2. INS. INSR. ITGA6. KIAA0319. LAMA2. LPP. LSP1 (includes EG:16985). LTF. LUM. LY96 (includes EG:17087). MAPK1. MNX1. MTAP. MYO10. MYO1F. NAV1. NOG. NPTX2. NTS. NUCB2. PAEP. PDPN (includes EG:10630). PEX11B. PEX13. POMC. POU3F2. PPARA. PPM1F. PRKCQ. PRKCZ. PRL. PRNP. PROK2. PTGDR2. PTGES. PTK2 (includes EG:14083). PVR. RASSF5. RGS1. SATB2. SELL. SEMA5A. SOD1. STAT1. TDP2. TGFB2. THBS2. TIAM1. TNFAIP8. TNFRSF18. TNFRSF4. TNFSF13B. TSPO. UNC5C. VASH1. VAV3. VEGFA. VIM. WWOX | 108 |
| cell movement | 0.000073 | 0.043 | ADCY10. ADI1 (includes EG:104923). AGT. APLP2. APPL1. ARHGAP5. B3GAT1. BCL2. BGN. BID. BMP2. BTC. BTK. CATSPER3. CBLB. CCR5. CD200. CD247. CD36. CD38. CD40. CD99. CHGA. CMA1. CNTNAP2. CSF2RA. CTBP2. CTNNA2. CTSG. CX3CR1. CXCL13. DARC. DCDC2. DCN. DISC1. DLX1. DYX1C1. E2F3. EBF3. EGF (includes EG:13645). ELMO2. ENAH. FCER1A. FH. FHL2. GFRA1. GNA12. GNB1. GRIA2. GZMB. HTATIP2. ICOS. IFT88. IGF2. INS. INSR. ITGA6. KIAA0319. LAMA2. LPP. LSP1 (includes EG:16985). LTF. LUM. LY96 (includes EG:17087). MAPK1. MNX1. MTAP. MYO10. MYO1F. NAV1. NCK2. NOG. NPTX2. NTS. NUCB2. PAEP. PDPN (includes EG:10630). PEX11B. PEX13. POMC. POU3F2. PPARA. PPM1F. PRKCQ. PRKCZ. PRL. PRNP. PROK2. PTGDR2. PTGES. PTK2 (includes EG:14083). PVR. RASSF5. RGS1. RGS10. SATB2. SELL. SEMA5A. SOD1. SPAG16. STAT1. TAS1R3. TDP2. TGFB2. THBS2. THRB. TIAM1. TNFAIP8. TNFRSF18. TNFRSF4. TNFSF13B. TSPO. UNC5C. VASH1. VAV3. VEGFA. VIM. WWOX | 118 |
| apoptosis | 0.000069 | 0.043 | ABCG1. ADCY10. ADI1 (includes EG:104923). ADRA1B. ADRA1D. AGPAT2. AGT. APPL1. ATXN1. BCL2. BCL2L11. BCL2L13. BGN. BID. BIK. BMP2. BMPR1B. BTC. BTK. CACNA1A. CBLB. CCDC86. CCNI. CCNL2. CCR5. CD200. CD247. CD36. CD38. CD40. CD5L. CD99. CDK11A/CDK11B. CSF2RA. CTBP2. CTSG. CX3CR1. CYBA. DACH1. DCN. DLX1. DNMT3A. DUSP10. DVL1. E2F3. EGF (includes EG:13645). EPHA7. EPHX1. EPM2A. FABP1. FANCC. FBXL5. FCER1A. FHL2. FOXP1. FSTL3. GFRA1. GNA12. GRIA2. GZMB. HFE. HSF2. HTATIP2. ICOS. IFNE. IGF2. IKBKE. IL17RD. INS. INSR. IPPK. ITGA6. ITGB3BP. ITPK1. IVNS1ABP. KIFAP3. KLF10. LAMA2. LIG4. LSP1 (includes EG:16985). LTF. LUM. MAGED1. MAGEH1. MAPK1. mir-154. mir-506. MITF. MLLT3. MNAT1. MTCH1. NELL1. NOG. NPTX2. NTS. PAEP. PAWR. PAX5. PDCD6IP. PEX11B. PKN2. POLH. POMC. PPARA. PPM1F. PPP2R4. PPP3CA. PRAME. PRKCH. PRKCQ. PRKCZ. PRL. PRNP. PRPF19. PRUNE2. PTGES. PTK2 (includes EG:14083). PUS10. RASSF5. RGS5. RNASEH1. SELL. SGCG. SLC25A6. SMARCA2. SMOX. SOD1. SPAG16. ST14. STAT1. TFAP4. TGFB2. THBS2. TIAM1. TMEM109. TMEM132A. TNFAIP8. TNFRSF18. TNFRSF4. TNFSF13B. TREX2. TRPS1. TSPO. TUB. TXNIP. UNC5C. VEGFA. VIM. VPS13A. WT1. WWOX. XPO1. ZMYM2 | 153 |
| quantity of leukocytes | 0.000076 | 0.043 | AGT. BCL2. BCL2L11. BID. BIK. BST1 (includes EG:12182). BTK. CARD11. CBLB. CCR5. CD200. CD247. CD36. CD38. CD40. CD5L. CRLF2. CX3CR1. CXCL13. DCN. DMD. DUSP10. FABP1. FANCC. FCER1A. FOXP1. GNA12. HESX1. ICOS. IGF2. INS. ITGA6. KDM5A. KIFAP3. KLF10. LAMA2. LIG4. LSP1 (includes EG:16985). LUM. NOG. PAWR. PAX5. PRKCQ. PRL. PRNP. PROK2. PTGDR2. PTGES. PTK2 (includes EG:14083). RASSF5. RGS1. RGS10. SELL. SOD1. ST14. STAM. STAT1. TNFRSF4. TNFSF13B. TOX. TXNIP. VAV3. VEGFA. VPREB1. WWOX | 65 |
A total of 823 genes surrounding the 603 top associated SNPs were put into the IPA software.
Surrounding genes were defined by either Grail (www.broadinstitute.org/mpg/grail/) or the Genome Browser (http://genome.ucsc.edu/). Gene families located in the same region were manually curated so that only one gene in each family remained in each region, based on a similar official gene symbol.
Hochberg Y, Benjamini Y. Statistics in medicine 1990; 9∶811–8.
Table 6. Biological functions of genes surrounding the 603 top associated SNPs. Results from GeneTrail.
| Category | rank | Subcategory | expected | observed | p-value (raw) | Genes |
| KEGG | 1 | Type II diabetes mellitus | 1.91 | 7 | 0.0026 | ABCC8 CACNA1A INS INSR KCNJ11 MAPK1 PRKCZ |
| KEGG | 2 | Salivary secretion | 3.62 | 9 | 0.003 | ADRA1B ADRA1D AMY1B ATP2B3 BST1 CALML6 CD38 CST2 RYR3 |
| KEGG | 3 | Pathways in cancer | 13.35 | 23 | 0.007 | APPL1 BCL2 BID BMP2 CBLB CSF2RA CTBP2 CTNNA2 DVL1 E2F3 EGF FGF22 FH ITGA6 LAMA2 MAPK1 MITF PTK2 RASSF5 STAT1 TCEB1 TGFB2 VEGFA |
| KEGG | 4 | T cell receptor signaling pathway | 4.40 | 10 | 0.012 | CARD11 CBLB CD247 ICOS MAPK1 NCK2 PDK1 PPP3CA PRKCQ VAV3 |
| KEGG | 5 | TGF-beta signaling pathway | 3.46 | 8 | 0.022 | BMP2 BMPR1B DCN ID4 MAPK1 NOG TGFB2 THBS2 |
| KEGG | 6 | Cytokine-cytokine receptor interaction | 10.79 | 18 | 0.022 | BMP2 BMPR1B CCR5 CD40 CRLF2 CSF2RA CX3CR1 CXCL13 EGF IFNA6 IFNE IL3RA PRL TGFB2 TNFRSF18 TNFRSF4 TNFSF13B VEGFA |
| KEGG | 7 | Arrhythmogenic right ventricular cardiomyopathy | 3.09 | 7 | 0.034 | ACTN1 CTNNA2 DMD ITGA10 ITGA6 LAMA2 SGCG |
| Gene Ontology | 1 | negative regulation of phosphatase activity | 0.21 | 3 | 0.0006 | PPP2R4 TGFB2 TIPRL |
| Gene Ontology | 2 | positive regulation of apoptosis | 13.93 | 27 | 0.0008 | AGT AKAP13 ARHGEF18 BCL2 BCL2L11 BCL2L13 BID BIK BMP2 BTK CD38 HTATIP2 IKBKE ITGB3BP MAGED1 MAPK1 MTCH1 PAWR PPP2R4 PRUNE2 PVR SOD1 TFAP4 TGFB2 TIAM1 VAV3 WT1 |
| Gene Ontology | 3 | regulation of phosphatase activity | 0.53 | 4 | 0.0015 | BMP2 PPP2R4 TGFB2 TIPRL |
| Gene Ontology | 5 | glomerular epithelium development | 0.08 | 2 | 0.0017 | BASP1 WT1 |
| Gene Ontology | 6 | vesicle | 12.50 | 24 | 0.0017 | APPL1 BGN CD36 CTSG CUZD1 CXXC4 CYBA DVL1 EGF GRIA2 HFE HPS4 LTF NRSN1 PALM RASSF9 SEC24A SOD1 SYT1 SYT2 TGFB2 TH THBS2 VEGFA |
| Gene Ontology | 7 | cellular defense response | 2.38 | 8 | 0.0024 | CCR5 CD300C CD5L CX3CR1 DCDC2 LSP1 LY96 NCR2 |
| Gene Ontology | 8 | cytoplasmic vesicle | 12.17 | 23 | 0.0026 | BGN CD36 CTSG CUZD1 CXXC4 CYBA DVL1 EGF GRIA2 HFE HPS4 LTF NRSN1 PALM RASSF9 SEC24A SOD1 SYT1 SYT2 TGFB2 TH THBS2 VEGFA |
| Gene Ontology | 9 | phosphoinositide 3-kinase cascade | 0.33 | 3 | 0.0033 | AGT INS TGFB2 |
| Gene Ontology | 10 | hindbrain development | 0.37 | 3 | 0.0048 | CTNNA2 MYO16 SDF4 |
| Gene Ontology | 11 | regulation of neuronal synaptic plasticity | 0.37 | 3 | 0.0048 | NETO1 SHISA9 SYNGR1 |
| Gene Ontology | 12 | neuron projection membrane | 0.12 | 2 | 0.0049 | CNTNAP2 SHISA9 |
| Gene Ontology | 13 | dopamine biosynthetic process | 0.12 | 2 | 0.0049 | TGFB2 TH |
| Gene Ontology | 14 | hydrogen peroxide biosynthetic process | 0.12 | 2 | 0.0049 | CYBA SOD1 |
| Gene Ontology | 15 | positive regulation of respiratory burst | 0.12 | 2 | 0.0049 | INS INSR |
| Gene Ontology | 16 | cardiac epithelial to mesenchymal transition | 0.12 | 2 | 0.0049 | BMP2 TGFB2 |
| Gene Ontology | 17 | enzyme activator activity | 7.11 | 15 | 0.0051 | AGT APOA5 ARHGAP5 BCL2L13 BMP2 EGF MMP17 OPHN1 PITRM1 PPP1R12B PPP2R4 RGS1 RGS5 TBC1D15 VAV3 |
| Gene Ontology | 18 | epidermal growth factor receptor signaling | 0.74 | 4 | 0.0054 | AGT EGF NCK2 SNX6 |
| Gene Ontology | 19 | extracellular matrix | 7.23 | 15 | 0.0060 | ASPN BGN CMA1 CPXM2 CTSG DCN ECM2 LAMA2 LUM MMP23B OGN SOD1 TGFB2 USH2A VEGFA |
| NIA human disease | 1 | Diabetes Mellitus. Type 2 | 10.49 | 22 | 0.0003* | ABCC8 AGT AKAP10 APOA5 BTC CCR5 CD36 CMA1 CYBA FABP1 FTO INS INSR KCNJ11 MTTP PPARA PRKCZ SELL TH THBS2 TXNIP VEGFA |
| NIA human disease | 2 | Hyperlipoproteinemias | 0.26 | 3 | 0.0012 | APOA5 FABP1 PPARA |
| NIA human disease | 3 | Diabetic Angiopathies | 1.94 | 7 | 0.0024 | CD40 CYBA INS KCNJ11 PPARA TXNIP VEGFA |
| NIA human disease | 4 | Postmortem Changes | 0.10 | 2 | 0.0026 | DAOA TPH2 |
| NIA human disease | 5 | Disease Progression | 7.77 | 16 | 0.0030 | AGT BCL2 CCR5 CD40 CMA1 CX3CR1 DCN EGF HFE KCNJ11 PPARA PRNP SELL SOD1 VEGFA WT1 |
| NIA human disease | 6 | Birth Weight | 1.69 | 6 | 0.0054 | EGF EPHX1 FTO H19 INS TH |
| NIA human disease | 7 | Pathological Conditions. Signs and Symptoms | 23.66 | 34 | 0.0073 | AGT APOA5 BCL2 CCR5 CD40 CMA1 CX3CR1 CYBA DAOA DCN DISC1 DMD EGF EPHX1 FCER1A FTO H19 HFE HTR2C INS INSR KCNJ11 LTF MTTP PLXNA2 POMC PPARA PRNP SELL SOD1 TH TPH2 VEGFA WT1 |
| NIA human disease | 8 | Bronchiolitis. Viral | 0.15 | 2 | 0.0075 | CCR5 CX3CR1 |
| NIA human disease | 9 | Kidney Failure. Acute | 0.15 | 2 | 0.0075 | CYBA WT1 |
| NIA human disease | 10 | Diseases in Twins | 0.46 | 3 | 0.0086 | DISC1 HFE PLXNA2 |
| NIA human disease | 11 | Coronary Artery Disease | 4.55 | 10 | 0.0127 | AGT APOA5 CD36 CD40 CMA1 CX3CR1 CYBA PPARA THBS2 VEGFA |
| NIA human disease | 12 | Dyslexia | 0.26 | 2 | 0.0233 | DYX1C1 KIAA0319 |
| NIA human disease | 13 | Myocardial Infarction | 6.64 | 12 | 0.0282 | AGT AKAP10 APOA5 CCR5 CTSG CX3CR1 HFE INSR MTTP THBS2 TNFRSF4 VEGFA |
| NIA human disease | 14 | Nutritional and Metabolic Diseases | 18.45 | 26 | 0.0295 | ABCC8 AGT AKAP10 APOA5 BTC CBLB CCR5 CD36 CMA1 CYBA DCN FABP1 FTO HTR2C INS INSR KCNJ11 MTTP POMC PPARA PRKCZ SELL TH THBS2 TXNIP VEGFA |
| NIA human disease | 15 | Overweight | 0.31 | 2 | 0.0338 | APOA5 FTO |
A total of 823 genes surrounding the 603 top associated SNPs were put into the GeneTrail software. Surrounding genes were defined by either Grail (http://www.broadinstitute.org/mpg/grail/) or the Genome Browser (http://genome.ucsc.edu/). Gene families located in the same region were manually curated so that only one gene in each family remained in each region, based on a similar official gene symbol.
Significant after multiple testing correction using FDR adjustment. (pcorr-value=0.032) Size of test set: 823 (768 known). Number of known ref. IDs: 44829 Kegg: Number of annotated genes in test set was 220. Number of annotated genes in ref set was 5405. Gene Ontology: Number of annotated genes in test set was 476. Number of annotated genes in ref set was 11580.
NIA human genes sets: Number of annotated genes in test set was 76. Number of annotated genes in ref set was 1487
Table 7. Biological functions of genes surrounding SNPs from the two-locus interaction. Results from GeneTrail.
| Category | rank | Subcategory | expected | observed | p-value(raw) | enrichment | Genes |
| KEGG | 1 | Amoebiasis | 1.01 | 4 | 0.0178 | up | ACTN1 CTSG GNA14 TGFB2 |
| KEGG | 2 | T cell receptor signalling | 1.04 | 4 | 0.0196 | up | CBLB CD247 ICOS VAV3 |
| KEGG | 3 | PPAR signaling pathway | 0.66 | 3 | 0.0282 | up | APOA5 CD36 FABP1 |
| KEGG | 5 | Ubiquitin mediated proteolysis | 1.34 | 4 | 0.0438 | up | CBLB KLHL9 TCEB1 UBR5 |
| KEGG | 6 | Primary immunodefciency | 0.34 | 2 | 0.0441 | up | BTK ICOS |
| KEGG | 7 | Basal transcription factors | 0.35 | 2 | 0.0465 | up | GTF2B TAF7L |
| NIA humandiseasegene sets | 1 | Hyperlipoproteinemias | 0.07 | 2 | 0.0017 | up | APOA5 FABP1 |
| NIA humandiseasegene sets | 2 | Diabetes Mellitus Type 2 | 2.80 | 6 | 0.0493 | up | APOA5 CCR5 CD36 CMA1 FABP1 TH |
A total of 187 genes from the interaction analysis were put into the GeneTrail software.
Surrounding genes were defined by either Grail (www.broadinstitute.org/mpg/grail/) or the Genome Browser (http://genome.ucsc.edu/). Gene families located in the same region were manually curated so that only one gene in each family remained in each region, based on a similar official gene symbol.
Size of test set: 186 (173 known). Number of known ref. IDs: 44829.
KEGG: number of annotated genes in test set: 52. Genes in reference set: 5405.
NIA human disease gene sets: number of annotated genes in test set: 20. Genes in reference set: 1487.
Figure 3. Ingenuity network 1.

The top network identified by the Ingenuity IPA software using genes surrounding all 603 most associated SNPs from the TDT analysis. Molecules in gray were present among the genes from our TDT analysis and molecules in white were added by the IPA software. The DUSP10 gene is marked in yellow.
Table 8. The top four networks generated by the Ingenuity IPA software (allowing only direct connections between proteins/genes).
| 1: Cell Morphology, Cellular Assembly and Organization, Hair and Skin Development and Function. Ingenuity Score: 155, 109 focus molecules. | ABT1,ACAP3,Ant,APLP2,APOA5,ARID1B,ASB6,ASPN,ATXN1,BASP1,BGN,BICD2,BIK,C1q,Cbp/p300,CCDC50,CCNL2,CD200,CD5L,CDK11A/CDK11B,CEP55,CHGA,COL22A1, collagen, Collagen type I,Collagen type,IV,Creb,CSF2RA,CXCL13,CYBA,CyclinA,CyclinE,DACH1,DCAF6,DCN,DDB1,DPP6,DUSP10,E2F3,E2f,EAPP,EFCAB7,ELOVL6, EPB41L2, FABP1,FCER1A,Fibrinogen,FOXD3,GGA1 (includesEG:106039),GLS,GLTPD1,GRIA2,GSPT2,GSTT2/GSTT2B,GTF2B,HESX1,HIST1H3A (includes others),Histone h3,Histone h4,HMG20B,HoloRNApolymeraseII,HTATIP2,IGF2,Immunoglobulin,INS,Insulin,ITGA6,ITGA10,ITGB3BP,IVNS1ABP,KDM5A,KLF12,LAMA2,Lamin b, Laminin1,Laminin,LBR (includes EG:368360),LIG4,LSAMP,LUM,MMP17,Mmp,MMP23B,MNAT1,MTTP,MVD,N-cor,NAP1L3,NBPF11, (includes others),NCOA5,NFkB(complex),NFRKB,NTS,PAX5,PBX3,PCBD2, PKIB,POU2F1, POU3F2,PPARA,PPM1F,PRL,PRMT3,PRMT8,PRNP,PTGES,PVR,pyruvate kinase, Rb,RBM8A,RGS1,RNA polymeraseII,RNF126,SLC25A6,SMC2,SRSF7,SYT8,TAF7L,TCEB1,TEAD4, Tgf beta,TGFB2,TGFBRAP1,THBS2,thymidine, kinase,thyroid hormonereceptor,TNFRSF4,TRHDE,TSPO,TXNIP,Ubiquitin,UBR5,Vegf,VEGFA,VIM,VPREB1,VPS37C,WT1,ZRANB1 |
| 2: Cell Signaling, Molecular Transport, Vitamin and Mineral Metabolism. Ingenuity score: 97, 86 focus molecules. | 14-3-3,Actin,ADRA1B,ADRA1D,ADRBK2,AGT,AKAP13,Akt,alcohol group acceptor phosphotransferase, ACTN1, Alpha tubulin,Angiotensin IIreceptor type 1,Ap1, ARHGAP5, ARHGEF18,BCL2,BCL2L11,BTK,Calmodulin,CaMKII,CARD11,caspase,CBLB,CCR5 ,CD3,CD6,CD36,CD38,CD40,CD247 ,chemokine,CTSG,CX3CR1,DARC, DISC1,DMD,DVL1,Dynamin, Dynein,dystroglycan,EGF (includesEG:13645),EPB41L3,EPHA7,ERK,ERK1/2,estrogen receptor,F Actin,FCRL4,FHL2,Focal adhesion kinase,Gprotein,Gap,GLRX3,GNA12,GNB1,Gpcr, GPR20,GPR27,GPR33,GPR45,GPR111,GPR115,GPR149,GPR161,growthfactor receptor,GZMB,Hsp70,Hsp90,HTR2C, ICOS,Iga,INADL,INSR,JAK,Jnk,KLF10,LIN7A,LPHN2,LTF,MAPK1,Mapk,MHC Class I (complex), MHC Class II (complex),MITF,Mlc,MRC1 (includes EG:100286774), MYT1L,NADK,NCK2,Nfat(family),NMDAReceptor,O3FAR1,OR51E2, P38 MAPK, p85 (pik3r), Pak,PAWR,PDCD6IP,PDK1,PDPN (includes EG:10630),PI3K(complex),PI3K p85,Pkc(s),PKN2,PLC gamma,POMC,PP2A,PPP3CA,PRKCH,PRKCQ,PRKCZ,PTGDR2,PTK2(includes EG:14083),Rac,Ras,RASSF5,Rxr,SGCG, SMARCA2,SOD1,Spectrin,STAM,STAT1 ,STAT,STAT5a/b,TAB1,TAS1R3,TCR,TH,THRB,TIAM1,TIMM8A,TNNT3,Troponin t, TUB,Tubulin, UTRN,VAV3,VAV,VN1R5 |
| 3: Cellular Assembly and Organization, Cellular Function and Maintenance, Developmental Disorder. Ingenuity score: 77, 69 focus molecules. | ABCG1,ABTB2,ACAD9,ACAD10,ACADSB,ADI1 (includesEG:104923),AGPAT2,AGPAT3,AGPAT4,AGPAT5,AGPAT6,ALDH18A1,ARL6,ATL2,B9D1,BAIAP2L1,BCL2L13, BRP44,C10orf35,C10orf88,CAMLG,CC2D2A,CCBL2,CCNI,CDH18,CDK5RAP2,CHIC2,CNTNAP2,CPSF3L,CRYL1,CTNNA2,DDX46,DMXL1,DOCK4,DSE,EBNA1BP2,ELMO2,ELMO3,ERGIC1,ERGIC2,ERGIC3,FAM125A,FAM125B,FAM175B,FBXO8,GEMIN6,GEMIN8,GLA,GNL1,HAUS2,HAUS3,HAUS5,HAUS7,HAUS8,HCN1,HCN2,HERC3,HERC4,HERC6,HFE,HNRNPH2,HNRPLL,IFT20,IFT52,IFT57,IFT88,IL13RA1,IL13RA2,INTS2,INTS9,LPP ,LSG1,MAD2L1BP,MAGEH1,MAOA,MCAT,MICAL3,MKS1 (includes EG:287612),MOAP1,MRPL23,MRPL20 (includes EG:39477),MRPL3 (includes EG:11222),MRPL40(includesEG:18100),MRPS21,MTAP,MYLIP,MYO1F,NDUFAB1, OSTF1,OXA1L, PALM,PCMTD1,PHKA1,PHRF1, PIGQ,PIGY,PPAP2B,PRAME,PTPN14,PYGB,REEP5,RIC3,RNF122,RNF166,RTN3,SARS2,SCYL3,SEC24A,SEC24B, SEMA5A, SERINC1, SGSH,SHPRH,SIL1(includesEG:100334837),SIPA1L2,SIPA1L3,SLC17A2, SLC23A2,SMEK2,SMOX,SSU72,STK19,TBC1D15,TCTN2,TFAP4,TFR2,TGM3,THAP5, TIPRL, TOP3B,TRIM17,TRIM44,TUBG2,UBC,USP44,VEZT,VPS37A,ZDHHC8,ZMIZ1,ZNF259 |
| 4: Post-Translational Modification, Carbohydrate Metabolism, Lipid Metabolism. Ingenuity score: 74, 67 focus molecules. | AGXT2L1,AHCYL2,ANGEL1,ANKRD17,ANKRD34A,ARMC9,ASXL1,ASXL2,AURKAIP1,B3GALT6,BAP1,BTN3A2,C15orf41,C1orf112,C1orf198,C2CD2,C9orf106,CCDC86,CCNDBP1,CCPG1,CENPP,COX20 (includesEG:116228),CTU2,CXXC4,DAK,DENND3,DHRS3,DLST,EFR3B,ELF2,ENDOV,FBXL4,FIS1 (includes EG:288584), FTO,GDAP1,HAT1,HSPA2,IER3IP1,IFIH1,IMP3,INPP5A,INPP5B,INPP5E,INPP5K,IPO4,IPPK,KANK4,KCNK10,KDM1B,KHNYN,LMBR1,MB21D2,MCF2L,MED20,METTL10,MRPL15 (includes EG:27395),MRPS18A,MRPS9 (includesEG:301371),MTCH1,MTMR8,MTMR9,PABPC5,PAN2,PITRM1,PMPCA,POLR3GL,PPM1G,PRDM10,PRPSAP2,PRUNE2, PSMB10, PSTK,PUSL1,PXDNL,RCN3,RPL28,SAR1B,SCAF4,SCNN1D,SDR39U1,SEC13,SEC16A,SEC16B,SEC23A,SIRT6,SLC35C2,SLC39A10,SLC45A4,SLC6A3,SYF2 (includes EG:170933),SYNGR1,SYNJ2,TAPT1,TMEM70, TMEM132A,TPTE/TPTE2,TRMT5,TSPAN9,TTYH2,TTYH3,TXNDC15,UBC,UBE2O,UCHL1,UCHL3,USP2,USP3,USP5,USP6,USP10,USP13,USP16,USP18,USP21,USP24,USP25,USP28,USP30,USP32,USP33,USP34,USP35,USP36,USP37,USP38,USP40,USP42,USP44,USP45,USP47,USP48,USP53,USP54,USP27X,USP9Y,XXYLT1,ZC3H13,ZNF131,ZNF334,ZNF608 |
The results of the network analysis included our genome-wide significant finding (DUSP10) within the top scoring network. P38 MAPK which interacts with DUSP10 is included in the second top network. Also the MHC class II complex is part of the second network. Genes within ours (P38 MAPK and DUSP10) and previously identified genome-wide significant regions are marked in italic, bold text. Only bold text show genes involved in amoebiasis. Underlined genes showed differences in our gene expression analysis (Table 9).
Rank; Top functions; Ingenuity score; Number of focus molecules; Molecules in Network.
Gene Expression
Out of the 34 selected target genes, three were from the top associated SNPs (DUSP10, SVIL and PPP1R12B) and the remaining were genes identified from the two-locus and pathway analysis. Eight genes showed significant up- or down-regulation after correction for multiple testing using Bonferroni correction (Fig. 4). For the top associated genes, several transcript variants were tested (Table 9). For the PPP1R12B gene, Isoform c and d (transcript variants NM032103.2 and NM032104.2) also known as the small subunit (sm-M20) of myosin light chain phosphatase, show significant up-regulation in patients with CD autoimmunity compared to control patients. An additional ten genes showed nominally significant differences in expression (Table 9).
Figure 4. Gene expression results.

Fold change on the y-axis is plotted for each individual in the two groups, 46 CD cases and 52 control patients. Each circle in the graph represents an individual. The mean expression value of the control group is set to 1.
Table 9. Results from gene expression analysis of 34 candidate genes.
| Gene symbol | Assay id | Gene | Fold Change | p-value | p-value corr.b | Selection criteria | |
| ADCY9a | Hs00181599_m1 | adenylate cyclase 9 | 1.58 | DOWN | 7.55E-06 | 2.87E-04 | two-locus |
| APPL2a | Hs00216855_m1 | adaptor protein, phosphotyrosine interaction, PH domain and leucine zipper cont. 2 | 1.51 | DOWN | 2.15E-05 | 8.19E-04 | two-locus |
| GLS | Hs00248163_m1 | glutaminase | 1.48 | DOWN | 2.20E-05 | 8.38E-04 | two-locus/IPA/top previous |
| PRR5L | Hs01029928_m1 | proline rich 5 like | 1.46 | UP | 4.99E-05 | 1.90E-03 | upreg TNFa |
| INSR | Hs00961554_m1 | insulin receptor | 1.41 | DOWN | 8.39E-05 | 3.19E-03 | two-locus |
| KIF13A | Hs00223154_m1 | kinesin family member 13A | 1.22 | DOWN | 1.76E-04 | 6.68E-03 | two-locus |
| PPP1R12B | Hs00364073_m1 | protein phosphatase 1, regulatory (inhibitor) subunit 12B | 1.44 | UP | 2.05E-04 | 7.78E-03 | top |
| PPP1R12B | Hs00364078_m1 | protein phosphatase 1, regulatory (inhibitor) subunit 12B | 1.15 | UP | 7.75E-04 | 0.029 | top |
| PDK1 | Hs01561850_m1 | pyruvate dehydrogenase kinase, isozyme 1 | 1.30 | UP | 9.42E-04 | 0.036 | IPA |
| FABP1 | Hs00155026_m1 | fatty acid binding protein 1, liver | 1.38 | DOWN | 1.63E-03 | 0.06 | two-locus |
| RGS2a | Hs01009070_g1 | regulator of G-protein signaling 2 | 1.26 | DOWN | 2.32E-03 | 0.09 | IPA/top previous |
| DPP10 | Hs00397766_m1 | dipeptidyl-peptidase 10 | 1.75 | DOWN | 4.22E-03 | 0.16 | two-locus |
| IKBKE | Hs01063858_m1 | inhibitor of kappa light polypeptide gene enhancer in B-cells, kinase epsilon | 1.18 | UP | 0.014 | 0.52 | two-locus/IPA/genetrail |
| UNC5C | Hs00186620_m1 | unc-5 homolog C (C. elegans) | 1.17 | DOWN | 0.015 | 0.59 | IPA |
| ARID1B | Hs00368175_m1 | AT rich interactive domain 1B | 1.13 | DOWN | 0.017 | 0.63 | two-locus |
| PKN2 | Hs00178944_m1 | protein kinase N2 | 1.14 | DOWN | 0.024 | 0.91 | two-locus |
| ITPK1 | Hs00356546_m1 | inositol 1,3,4-triphosphate 5/6 kinase | 1.13 | DOWN | 0.026 | 0.99 | two-locus |
| RGS1 | Hs00175260_m1 | regulator of G-protein signaling 1 | 1.41 | UP | 0.026 | 1.00 | IPA/top previous |
| SVIL | Hs00931734_m1 | supervillin | 1.34 | DOWN | 0.035 | 1.00 | top |
| PPP1R12B | Hs00981888_m1 | protein phosphatase 1, regulatory (inhibitor) subunit 12B | 1.08 | DOWN | 0.053 | 1.00 | top |
| APPL1 | Hs00989616_m1 | adaptor protein, phosphotyrosine interaction, PH domain and leucine zipper cont. 1 | 1.10 | DOWN | 0.055 | 1.00 | two-locus/IPA/genetrail |
| MTTP | Hs00165177_m1 | microsomal triglyceride transfer protein | 1.21 | DOWN | 0.100 | 1.00 | IPA |
| COQ3 | Hs00213616_m1 | coenzyme Q3 homolog, methyltransferase (S. cerevisiae) | 1.23 | DOWN | 0.196 | 1.00 | two-locus |
| SVIL | Hs00931014_m1 | supervillin | 1.18 | DOWN | 0.221 | 1.00 | top |
| CD200 | Hs01033303_m1 | CD200 molecule | 1.09 | UP | 0.368 | 1.00 | IPA |
| MAGED1 | Hs00986269_m1 | melanoma antigen family D, 1 | 1.04 | DOWN | 0.512 | 1.00 | IPA/genetrail |
| FOXD3 | Hs00255287_s1 | forkhead box D3 | 1.13 | UP | 0.547 | 1.00 | two-locus |
| ITPK1-AS1 | Hs01053867_s1 | inositol 1,3,4-triphosphate 5/6 kinase Associated | 1.10 | DOWN | 0.548 | 1.00 | two-locus |
| LPP | Hs00194400_m1 | Lipoma-preferred partner | 1.07 | DOWN | 0.634 | 1.00 | two-locus/top previous |
| RGS5 | Hs00186212_m1 | regulator of G-protein signaling 5 | 1.04 | DOWN | 0.699 | 1.00 | IPA |
| DUSP10 | Hs00200527_m1 | dual specificity phosphatase 10 | 1.12 | UP | 0.704 | 1.00 | top |
| FSCB | Hs03044256_s1 | fibrous sheath CABYR binding protein | 1.12 | DOWN | 0.735 | 1.00 | two-locus |
| CCR3 | Hs00266213_s1 | chemokine (C-C motif) receptor 3 | 1.05 | UP | 0.737 | 1.00 | two-locus |
| TIPRL | Hs00295580_m1 | TIP41, TOR signaling pathway regulator-like (S. cerevisiae) | 1.01 | DOWN | 0.752 | 1.00 | genetrail |
| KHDRBS2 | Hs01061150_m1 | KH domain containing, RNA binding, signal transduction associated 2 | 1.06 | UP | 0.840 | 1.00 | two-locus |
| GTF2B | Hs00976258_m1 | general transcription factor IIB | 1.03 | UP | 0.888 | 1.00 | IPA/genetrail |
| ACTN1 | Hs00998100_m1 | actinin, alpha 1 | 1.01 | DOWN | 0.914 | 1.00 | two-locus |
| DUSP10 | Hs04189838_m1 | dual specificity phosphatase 10 | No expression detected | top | |||
Expression (e.g. mRNA levels) of these genes was either up- or down-regulated in small intestinal biopsies from CD cases compared with control patients. Effect direction is presented for cases with control group as a reference. The selection column indicates if the gene was selected due to its presence in two-locus or pathway analyses. “Top” indicates top SNP in the present GWAS and “top previous” indicates that it was present in the GWAS by Dubois et al.
All the gene assays (primers and probes) were predesigned and ordered from Life technologies (CA, USA).
Reference genes tested were: ACTB (Hs00357333_g1), B2M (Hs99999907_m1), EPCAM (Hs00158980_m1), GUSB (Hs99999908_m1), HPRT1 (Hs99999909_m1), MUC1 (Hs00159357_m1), PGK1 (Hs99999906_m1). For the results a combined value of ACTB, EPCAM, and PGK1 showed to be optimal when analysed by GeNorm and were selected as reference.
Gene not included in the gene list used for pathway analyses due to recombination between associated SNP and gene promotor: rs10861406.
(APPL2), rs882820 (ADCY9). However, possible regulatory site could be close to associated SNP and influence gene expression.
P-values corrected using Bonferroni correction.
Non-parametric Linkage (NPL)
The strongest linkage outside of HLA was detected in chromosome regions 5q23.2-q33.1, and 1q32.1. In total, thirteen regions with an NPL point wise p-value below 0.01 were detected (Fig. 5 and Table 10). In our previous linkage-scan, using almost the same set of families, we detected only one region (11q23-25) with a point wise p-value below 0.01 [14]. The reason for the improved results is mainly the almost perfect information content achieved by a dense set of highly successful SNP markers compared to a relatively sparse set of less successful microsatellite markers. Also in the NPL analysis, the PPP1R12B gene was located in one of the top regions (1q32.1).
Figure 5. NPL results.

Non-Parametric Linkage score displayed as –log10(p-value) on the y-axis and chromosome 1–22 and X on the x-axis.
Table 10. Non Parametric Linkage (NPL) results.
| chr | from(Mb) | to(Mb) | max NPL | p-value |
| 6a | 12,5 | 52,6 | 5,42 | 3,03E-08 |
| 5 | 124,5 | 149,3 | 3,33 | 4,36E-04 |
| 1 | 200,2 | 231,8 | 3,12 | 9,20E-04 |
| 11 | 122,2 | 130,2 | 2,95 | 1,59E-03 |
| 9 | 30,3 | 34,7 | 2,82 | 2,40E-03 |
| 4 | 96,5 | 111,3 | 2,81 | 2,46E-03 |
| 3 | 104,7 | 108,6 | 2,70 | 3,49E-03 |
| 14 | 85,7 | 86,4 | 2,57 | 5,16E-03 |
| 6 | 160,4 | 161,0 | 2,54 | 5,50E-03 |
| 11 | 77,6 | 78,4 | 2,48 | 6,64E-03 |
| 18 | 55,0 | 55,1 | 2,45 | 7,20E-03 |
| 1 | 29,7 | 29,9 | 2,42 | 7,87E-03 |
| 2 | 127,0 | 127,1 | 2,41 | 8,00E-03 |
| 2 | 106,3 | 106,4 | 2,37 | 8,89E-03 |
Regions showing significant linkage (the HLA region only) and putative linkage (nominal p<0.01. Regions in the table are defined as the Megabase (Mb) interval showing a nominal p<0.01. Neighbouring regions were merged if <15 Mb pairwise distance.
Max NPL – the maximum Z score across the region between the positions ‘from’ and ‘to’.
p-value – the p-value for the max NPL score.
= The HLA region.
Discussion
This study confirmed some previous GWAS findings and in addition, it established a new genome-wide significant region containing the DUSP10 gene. The top markers, rs12144971 and rs4240931 showed a substantial effect size in the HLA low-risk group with a transmitted versus non-transmitted allele ratio of 3.11 (Table 2).
DUSP10, TNF-α and Tissue Transglutaminase (TGM2)
The protein product of DUSP10 preferentially binds to the stress-activated p38 MAPK (mitogen-activated protein kinase) and plays an important role in regulating chemokine induction after infection by various pathogens [15], and in coordinating MAPK activity in response to oxidative stress [16]. In previous studies, both p38 MAPK and DUSP10 have been shown to activate TNF-α [17], [18], of which one also demonstrates that TNF-α up-regulates TGM2 (the gene encoding the main autoantigen in CD [19]) in intestinal mucosa from untreated CD patients [17]. Whether this up-regulation of TGM2 is of importance for the immune response leading to formation of IgA-tTG and IgG-tTG autoantibodies, the serological markers for CD is still unresolved.
Pathway Analyses
In order to discover possible functional connections between DUSP10 and other genes, we analyzed genes surrounding the top 603 markers. A total of 845 genes were used in the analysis. Ingenuity pathway analysis (IPA) included DUSP10 within the most significant network. Also part of this network were GLS and RGS1, two genes previously identified within significant GWAS loci [3], as well as the insulin (INS) gene, and the immune regulatory nuclear factor kappa B (NF-Κb) complex (Fig. 3 and Table 8). The second top network included the MHC complex (HLA) and also several genes within already identified GWAS loci: ACTN1, CD247, CCR5, ICOS and STAT1 [3]. In addition, both IPA and GeneTrail [13] identified T2D genes as the most significantly overrepresented gene cluster after correction for multiple testing (Table 5 and 6). Among this set of genes surrounding the 603 markers, many genes belonged to growth and nutrient signaling pathways, for example, INS, INSR, EGF, POMC, TIPRL and PRR5L. There were also related genes directly involved in energy metabolism; PDK1, COX7C, COQ3 and GLS.
Overlapping Results with Other GWAS Findings
Surprisingly, four out of six top loci identified by a GWAS for anorexia nervosa [20] and two out of three loci involved in plasma glucose levels in type 1 diabetic patients [21] were among our 603 and 35 best SNP markers respectively. One of the genes in anorexia, namely AKAP6, is also associated to fasting insulin-related traits as well as the autoimmune disease Ankylosing spondylitis [22]. Of the 40 identified regions in CD, seven regions overlap with our 603 SNP list (LPP, STAT4/GLS, RGS1, CCR1/CCR3, PUS10, ICOS/CTLA4 and CD247). Out of the 69 regions reported in the GWAS catalog for type 1 diabetes, eight overlap with the regions reported in this study and out of those eight, CTLA4/ICOS also overlap with the previously reported CD associations.
We compared minor allele frequencies between the previous CD GWAS by Dubois et al. and our GWAS. In their top 42 associations, there was no SNP below a minor allele frequency of 0.08. In our top 42 associations, we identified five SNPs with a minor allele frequency below 0.06. This observation could just be a chance finding or perhaps an indication that rare variants are easier to discover using families. We also identified a relatively rare variant in the LPP gene region (rs17283813), with a minor allele frequency of 0.075. This SNP was not at all significant in the GWAS by Dubois et al. (Table S1).
Neither was there an association with the DUSP10 region in the GWAS by Dubois and co-workers. The associated markers in the DUSP10 region in our GWAS have a minor allele frequency around 0.5 and are hence very common in the population. It is difficult to say if this is a population specific effect or if DUSP10 could be detected in an HLA stratified population from another ethnicity. Interestingly, the DUSP10 region has also been identified as a risk factor for colon cancer by a meta-analysis of three GWAS from the UK. This is an indication that colon cancer and CD could share genetic risk factors.
Key Metabolic Regulators as well as the Top Associated gene PPP1R12B were Differently Expressed in CD Cases Compared to Controls
Another important finding was the difference between cases and controls and their gene expression patterns in the small intestine. Eight of the 34 candidate genes selected for quantitative measurements of gene expression, including PPP1R12B, PDK1, GLS, PRR5L and the INSR, showed significant up or down regulation of mRNA levels in cases compared to controls (Fig. 4). This could very well be a consequence of an ongoing inflammation or possibly also indicate an underlying metabolic difference. Glutamine is converted to glutamate by the enzyme glutaminase (GLS). In turn, glutamate can be converted to proline and subsequently catabolized by the enzyme proline dehydrogenase (PRODH) resulting in the production of reactive oxygen species and apoptosis [23]. In the present study, we show that the expression of GLS is down-regulated and PDK1 is up-regulated in cases. Interestingly, a previous study has shown that cell lines with a known familiar mutation for amyotrophic lateral sclerosis (ALS) have the same expression pattern, with up-regulated PDK1 and down-regulated GLS, as compared to the wild-type cell line [24]. PRR5L (also called Protor-2) belong to the TOR signaling pathway. Our results show an up-regulated PRR5L expression in cases (Fig. 4). Like DUSP10, the protein product from PRR5L has been shown to stimulate an increased TNF-α expression [25].
Another gene, connected to the MAPK pathway and which was identified both by our two-locus interaction analysis and in significant biological functions implied by IPA, was the APPL1 gene. APPL1 is a binding partner of the protein kinase Akt2 and a key regulator of insulin signaling [26]. It takes part in adiponectin signaling to stimulate activity of p38 MAPK in muscle cells [27] and is a critical regulator of the crosstalk between adiponectin signaling and insulin signaling pathways [28]. We could detect expression of both APPL1 and APPL2 in small intestinal biopsies and a significantly lower expression of APPL2 was detected in the CD autoimmunity cases as compared to controls (Fig. 4). Lower expression of APPL2 levels lead to enhanced adiponectin stimulated glucose uptake and fatty acid oxidation [29]. A SNP (rs10861406) included in the top 603 list was located upstream of the APPL2 gene, however the promotor of this gene was on the opposite side of a recombination hotspot and therefore not included in the gene list for pathway analyses.
The most significant finding from our non-stratified linkage GWAS analysis was the association with the PPP1R12B gene region. PPP1R12B is involved in smooth muscle contractibility and mediates binding to myosin [30]. Myosin light chain phosphatase from smooth muscle consists of a catalytic subunit (PP1c) and two non-catalytic subunits, M130 and M20. The two non-catalytic subunits are both encoded by the PPP1R12B gene. The M130 transcript was not differentially expressed between CD autoimmunity and control patients while the small subunit “M20” showed a significantly higher expression in patients with CD autoimmunity. (PPP1R12B_22 in Fig. 4) Several other genes located close to top markers such as the PPP3CA, ACTN1, MYO1B, MYO5A, MAPK1, PRKCH, PRKCQ, PRKACB, PRR5L and NTS genes, are connected to smooth muscle when examining their function by using KEGG [31] and Gene Ontology [32].
The second most significant region in the HLA-stratified analysis after DUSP10 contains the SVIL gene. The product of this gene has been suggested to bind LPP [33]. In our two-locus interaction analysis, the LPP locus and a locus containing KIF13A was one of the 101 interaction pairs. KIF13A is a motor protein, which shuttles vesicles containing AP-1 and the mannnose-6-phosphate receptor [34]. KIF13A was significantly down-regulated in intestinal biopsies from CD patients in our gene expression analysis (Fig. 4). SVIL is associated with cell-focal adhesions (substrate contacts), which are important for rapidly moving cells such as for example immune cells but also for motility and polarity of intestinal epithelial cells. SVIL mRNA was down-regulated in our gene expression analysis, however, not significant after correction for multiple testing.
Proline and Glutamine Metabolism - Part of a “Danger Signal”
Amoebiasis was one of the nominally significant pathways in the GeneTrail analysis of genes surrounding the two-locus interaction SNPs (Table 7). Several of these genes were also present together with DUSP10 and the MHC class II genes in the two most significant IPA generated networks (marked in bold text in Table 8). Another gene present in these networks was the gene encoding for the immune molecule CD40 (associated SNP rs6065961, Table S1). CD40 has been shown to regulate immune responses to another parasite, Leishmania Major, by shared signaling through p38 MAPK and ERK1/2 [35]. CD40 also regulates DUSP expression and activity, which in turn contribute to anti-leishmanial functions [35]. It has been suggested that Leishmania Major inhibits CD40-triggered p38 MAPK signaling as part of an immune evasion strategy [36].
Another overrepresented category from GeneTrail was the extracellular matrix (ECM) (Table 6). Also, in the two most significant Ingenuity networks from the 603 marker analyses, ECM molecules and matrix metalloproteinases (MMPs) were included (Table 8). The ECM represents a major barrier to parasites like amoebas and leishmania. Parasites produce a wide variety of proteases to break down the ECM in order to access essential nutrients and invade host tissue [37]. A different situation when the ECM is degraded is during nutrient deprivation. In this way the ECM can provide energy for starving host cells. Just like gluten, the ECM has an unusually high proline content. MMPs are enzymes, which break down ECM making proline readily available as a nutritional source. Pandhare and co-workers have shown that energy or nutrient stress activates MMPs as well as the degradation of proline and furthermore demonstrated that, as the levels of glucose decreased to 1 mM and lower in the medium, intracellular proline increased almost 2-fold [38]. If gluten lingering in the intestine conveys a signal of ECM degradation (due to increased proline levels), several other mechanisms will most likely signal that there is food available at the same time (salivary secretion as one example is shown in Table 6). In this case, the immune system will rule out starvation as a possibility and the only other sensible option would be to search for an invasive intruder breaking down the ECM. The autoantigen in CD, TGM2, counteracts proteolysis and degradation of ECM by crosslinking ECM proteins [39]. If DUSP10 and PRRL5 up-regulate TNF-α and subsequently TGM2 [17], [18], [25], in CD, the purpose may very well be for TGM2 to help prevent an apparent or illusory pathogenic invasion. It has also been shown that down-regulation of SVIL protects against ECM invasion by pathogens [40]. In our gene expression analysis SVIL was nominally significantly down-regulated in cases (Table 9).
When the body “senses” a pathogen disturbing energy balance or breaking down ECM, but there are no pathogenic antigens present, maybe there could be a risk that “self” antigens become our immune systems futile attempt to rid the perceived pathogen. In HLA-DQA1*02/05 and HLA-DQB1*02 carriers, peptides derived from TGM2 could constitute such “self” antigens. It is possible that individuals carrying other HLA molecules still respond to this “phantom pathogen” and that under these circumstances, various other antigens present in the intestine at the time could become triggers of other autoimmune diseases. If the expression or presence of an autoantigen, like TGM2, was stimulated by the disturbed proline/glutamine homeostasis, it can explain why symptoms in CD also disappear by withdrawal of gluten.
Conclusion
At least four major functional components together with gluten, all seem to play a role in forming an individual’s risk for CD:
polarity and epithelial cell functionality, e.g. nutrient/vesicle transport, proliferation and apoptosis, important for cell migration from the crypt to the shedding (apoptosis) at the apical villi.
intestinal smooth muscle, which is important for the movement of the bowel as well as the villi.
growth and energy homeostasis, which includes proline and glutamine metabolism, and finally
the innate and adaptive immune system.
A slight dysfunction combining these categories together with gluten consumption would result in a metabolic imbalance which in turn could convey enough stress or “danger signal”, to trigger the immunological process and tissue destruction. A schematic illustration showing a rough outline of a possible disease model is presented in Figure 6.
Figure 6. Proposed disease model.

Illustrating a possible scenario for disease development. Genetic variation contributing susceptibility to disease can be found in at least four, somewhat overlapping, biological functions. The result is an “overload” or imbalance of proline vs glutamine. Due to the abundance of proline within the extracellular matrix (ECM) as well as in gluten, the proline from gluten is interpreted as degradation of ECM. When the body is not starving, the ECM is normally not degraded, unless there is a pathogen attempting to break through this barrier. The immune system mounts an attack against an invasive “phantom pathogen” which is believed to degrade the ECM. When proline is catabolized, reactive oxygen species (ROS) are released. In order to start re-building and crosslinking ECM molecules, Tissue transglutaminase (TGM2) expression is up-regulated by TNFα which in turn is stimulated by DUSP10 and Protor-2 (PRR5L). This rebuilding of the ECM counteracts the degradation by the imagined pathogen. However, the phantom pathogen remains and the adaptive immunity is brought in. Searching for antigens, it finds an abundance of TGM2 beside the ECM and forms antibodies against its own soldier. Some susceptibility genes can be found in the center of this model and some can be found within the spiral. Genes like HLADQ and other genes from the adaptive immunity are likely to be found in the spiral.
In this study, we identified DUSP10 to be significantly associated with celiac disease. We also identified mechanisms, which we believe influence the risk of developing disease. Our data points towards genes that are involved in cancer as well as metabolic and cardiovascular diseases. Besides understanding how they work in celiac disease, our findings could also have consequences for these other common diseases.
Whole genome analysis allows for discovering completely unknown mechanisms behind disease. Even if the discovered genes and gene variants won’t be able to predict who will develop disease in the future, they can be used to identify the underlying molecular pathways that influence disease. These molecular pathways would then be valuable targets for drug intervention. Our data provides new insights and hypotheses to the research field of CD and autoimmunity. However, the functional variants behind associations as well as mechanisms causing differences in gene expression and if and how these are relevant for disease, remains to be identified.
Materials and Methods
Ethics Statement
The regional ethics board in Gothenburg approved this study and participants in the study gave written informed consent after being fully informed about the aim of the study. For all children in the study, parental written consent was obtained.
Study Population
A total of 106 families with multiple affected individuals, mostly nuclear families with an affected sib pair (ASP) were collected from Sweden and Norway. There were 403 subjects and 97 families with DNA to complete the analysis. A total of 226 of the family members had CD, including 20 parents. The makeup and selection process regarding the families has been described previously in detail [41].
Small-intestinal biopsies, for the gene expression analysis, were collected at four pediatric clinics in Sweden: Skåne University Hospital in Malmö, Sach’s Childrens’ Hospital and Karolinska University Hospital in Stockholm and Sahlgrenska University Hospital in Gothenburg. For gene expression calculations, we decided to use case-control status based on anti-tTG IgA and IgG antibody levels in plasma using the Radio-Binding Assay (RBA) [42], [43]. Patients being both tTG IgA and IgG positive (>4 U/ml) were included as cases (we use the term “CD autoimmunity” for these cases [44]) and all other individuals were included as disease controls. The LPP gene was run in a first set of 42 cases (30 females, 12 males) and 38 control patients (21 females, 17 males). Cases and controls had a mean age of 7.3 and 11.1 years respectively. The remaining genes were run in a second set of 46 cases (25 females, 21 males) and 52 control patients (27 females, 25 males) with a mean age of 7.4 years for cases and 11.8 years for control patients at the time the biopsy was taken.
Gene Expression Analysis
We performed quantitative gene expression analysis using duodenal biopsies from CD autoimmunity patients and control patients. Biopsies were immediately put in RNAlater solution (Life Technologies, CA, USA). Total RNA was extracted using the miRNeasy Mini Kit (QIAGEN, Germany). RNA was converted to cDNA and quantitative PCR was run using TaqMan chemistry and the ABI7900 SDS instrument (Life Technologies, CA, USA). Seven control genes were evaluated using GeNorm [45] (ACTB (Hs00357333_g1), B2M (Hs99999907_m1), EPCAM (Hs00158980_m1), GUSB (Hs99999908_m1), HPRT1 (Hs99999909_m1), MUC1 (Hs00159357_m1), PGK1 (Hs99999906_m1)) and the geometrical mean of ACTB, EPCAM, and PGK1 were selected as reference for the relative quantification analysis (Delta-Delta Ct method). A total of 34 expressed genes located close to some of the most significantly associated SNPs were evaluated (Table 9). The top associated genes from our Linkage GWAS (DUSP10, SVIL, PPP1R12B) were selected as well as several genes from the two-locus interaction analysis and pathway analyses including LPP which is the top associated from the GWAS by Dubois et al. Also the RGS genes (RGS1, 2 and 5) and GLS show genome-wide association in the study by Dubois et al and are also present in our two-locus and pathway analyses.
Genotyping and Imputation
Samples were genotyped using two different SNP arrays, 211 samples with Human Omni Express and 192 samples with Human 660W-Quad (Illumina Inc, CA, USA). A total of 308,246 markers were available on both arrays and were therefore genotyped in the entire material. For the remaining 682,470 and for sporadic missing values we performed genotype imputation using the Impute 2 software [46], with the Hapmap 2 (rel. 24 Build 36) as a reference.
All individuals in the same family were located on the same plate. Quality control was first performed separately for the two arrays. SNP markers with less than 97% call rate in either of the two arrays were excluded.
Mendelian errors were detected by PLINK [47], 125,874 family-wise mendelian inconsistencies were set to missing (in each family the genotypes were set to missing for all subjects if there were any mendelian inconsistencies for a specific SNP).
Statistical Analysis
Linkage
For the linkage analysis only markers from both platforms were considered. From this set of 271,078 common SNP markers a LD pruned set of 105 539 SNPs were selected using PLINK. Parameters were a window size of 50 and R2<0.5. The Decode genetic map as supplied by Illumina was used to run non-parametric linkage using Merlin version 1.1.2 [48] with the NPL all method [49]. Marker allele frequencies were estimated from the founders.
Transmission Disequlibrium Test (TDT)
Spielman et al introduced the Transmission Disequilibrium Test (TDT) in 1993 [50].
The imputation analysis provides us with (posterior) probabilities for each of the possible genotypes at each locus and to utilize all posterior probabilities, we performed an analysis where we use the expected values of the transmission counts. The test statistic will then have the following form,
| (1) |
 has approximately the same distribution as the test statistic T in [50].
Stratified TDT
We implement a stratified TDT analysis where trios are split into a low-risk and a high-risk group based on the HLA genotype of the affected offspring. Children carrying the HLA-DQA1*02/05 risk allele and homozygous for the HLA-DQB1*02 risk allele (i.e. individuals carrying the DR3/DR3 or the DR3/DR7 haplotypes) were put in the “high-risk” group and the remaining children were put in the “low-risk” group. The rationale behind this is explained in the introduction and further information about this stratification can be found in our previous Linkage study [14]. A standard TDT analysis, with the 0.95 cut-off for imputation probabilities, was applied to each of these groups using PLINK [47].
Test for two-locus interaction
To examine possible interactions between marker variants, we used a pairwise test based on the one introduced by Kotti [51]. Consider two biallelic markers without linkage disequilibrium between their alleles. In the general model MG the penetrance matrix has 9 parameters,
 |
Let n be the 3×3 matrix of genotype counts among the cases for the two markers, and let m be the corresponding matrix for the non-transmitted allele combinations. The likelihood for the models is
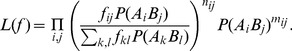 |
(2) |
For this analysis we use one affected subject from each family and markers were chosen based on the expected counts TDT (equation 1) and three different inclusion criteria:
P-value less than 3.0×10⁻⁴.
P-value less than 0.01 in our analysis and with a p-value less than 0.05 in the GWAS by Dubois et al. [3] and if the product of these p-values were less than 5.0×10⁻⁵ and the association were in the same allelic direction.
An allele transmission ratio of <0.2 or >5 combined with a p-value less than 2×10⁻³.
We defined 383 regions using the inclusion criteria above (Fig. 2 and Table S1) a region consisted of a set of markers where the distance between adjacent markers was less than 100 kb. With these regions defined we analyzed all pairwise interactions using a Likelihood Ratio (LR) tests comparing the following four models:
M0: None of the two loci is associated with CD,
MR: Heterogeneity model [52], with penetrance
where αi and βj are the penetrance factors for the genotypes Ai and Bj [53] respectively.
MM: Multiplicative model,
MG: the general model.
The restricted model used in [51] is the multiplicative model. We use the MG-versus-MM test to filter out false positives, based on that if one or both of the SNPs were marginally significant by chance, then the joint distribution (penetrance) of these markers should follow a multiplicative model.
We have the likelihood ratio statistic
 will follow a x
2 distribution under the restricted model if Mj is nested in Mk. The maximum likelihood estimates of the penetrance parameters and allele frequencies do not have a simple explicit expression, so to maximize the likelihoods we use the function optim in the statistical software R.
will follow a x
2 distribution under the restricted model if Mj is nested in Mk. The maximum likelihood estimates of the penetrance parameters and allele frequencies do not have a simple explicit expression, so to maximize the likelihoods we use the function optim in the statistical software R.
Gene Selection
Out of the 603 SNPs selected from the three inclusion criteria (Fig. 2 and Table S1), we were able to identify genes surrounding 444 SNPs using GRAIL [54]. Grail uses known recombination hotspots in order to limit the region of interest surrounding each SNP marker. Genes around the remaining SNPs were identified with the Genome Browser (http://genome.ucsc.edu) and the 5 closest genes within 250 kb from the associated SNPs were included. In cases where there were no genes within this distance we included the closest gene.
Pathway Analysis
We analyzed connections between genes in different regions, using GeneTrail [13] and the Ingenuity Pathway Analysis (IPA) software (Ingenuity Inc. CA, USA). Within each associated region, all but one gene from the same gene family were removed. This was done in order not to amplify the significance of homologous gene clusters, (i.e. chemokine receptor-, interferon- and histone-gene clusters).
URLs
PLINK (http://pngu.mgh.harvard.edu/purcell/plink/)
KEGG (www.genome.jp/kegg/)
Gene Ontology (www.geneontology.org/).
GWAS catalog, http://www.genome.gov/gwastudies/
GRAIL (http://www.broadinstitute.org/mpg/grail/)
SNAP (http://www.broadinstitute.org/mpg/snap/ldplot.php/)
GeneTrail (http://genetrail.bioinf.uni-sb.de/)
Supporting Information
A selection of 603 top associated SNPs and the two top HLA SNPs. Based on three inclusion criteria, 603 SNP markers and 383 regions were identified. Our TDT results, where T and U are the expected transmission counts (based on all the posterior imputation probabilities) and corresponding results from Dubois et al. [3].
(DOCX)
Acknowledgments
We would like to extend our gratitude to David van Heel and coworkers for allowing us to use the result data from their published GWAS study (Dubois et al 2010). We thank the Gothenburg Genomic Core Facility for support and we also thank Gustav Lundén for technical assistance. This study would not be possible without the generous participation of all the families and patients with celiac disease who contributed to the study.
Funding Statement
The principal funding for this study was provided through the regional agreement on medical training and clinical research (ALF) between Gothenburg County Council and Gothenburg University. We also thank Bengt Ihre’s, Claes Groschinsky’s, Magnus Bergvall’s, Nilsson-Ehle’s, Tore Nilson’s and Professor Nanna Svartz Foundations, Kungliga fysiografiska sällskapet in Lund, Frimurare barnhusdirektionen, Ruth and Richard Julin Foundation and the Swedish Society of Medicine. The Swedish Medical Research Council and the Celiac Disease Foundation supported family sample collections. The funders had no role in study design, data collection and analysis, decision to publish, or preparation of the manuscript.
References
- 1. Myleus A, Ivarsson A, Webb C, Danielsson L, Hernell O, et al. (2009) Celiac disease revealed in 3% of Swedish 12-year-olds born during an epidemic. J Pediatr Gastroenterol Nutr 49: 170–176. [DOI] [PubMed] [Google Scholar]
- 2. Sollid LM, Markussen G, Ek J, Gjerde H, Vartdal F, et al. (1989) Evidence for a primary association of celiac disease to a particular HLA-DQ alpha/beta heterodimer. J Exp Med 169: 345–350. [DOI] [PMC free article] [PubMed] [Google Scholar]
- 3. Dubois PC, Trynka G, Franke L, Hunt KA, Romanos J, et al. (2010) Multiple common variants for celiac disease influencing immune gene expression. Nat Genet 42: 295–302. [DOI] [PMC free article] [PubMed] [Google Scholar]
- 4. Festen EA, Goyette P, Green T, Boucher G, Beauchamp C, et al. (2011) A meta-analysis of genome-wide association scans identifies IL18RAP, PTPN2, TAGAP, and PUS10 as shared risk loci for Crohn’s disease and celiac disease. PLoS Genet 7: e1001283. [DOI] [PMC free article] [PubMed] [Google Scholar]
- 5. Hunt KA, Zhernakova A, Turner G, Heap GA, Franke L, et al. (2008) Newly identified genetic risk variants for celiac disease related to the immune response. Nat Genet 40: 395–402. [DOI] [PMC free article] [PubMed] [Google Scholar]
- 6. van Heel DA, Franke L, Hunt KA, Gwilliam R, Zhernakova A, et al. (2007) A genome-wide association study for celiac disease identifies risk variants in the region harboring IL2 and IL21. Nat Genet 39: 827–829. [DOI] [PMC free article] [PubMed] [Google Scholar]
- 7. Zhernakova A, Stahl EA, Trynka G, Raychaudhuri S, Festen EA, et al. (2011) Meta-analysis of genome-wide association studies in celiac disease and rheumatoid arthritis identifies fourteen non-HLA shared loci. PLoS Genet 7: e1002004. [DOI] [PMC free article] [PubMed] [Google Scholar]
- 8. Kumar V, Wijmenga C, Withoff S (2012) From genome-wide association studies to disease mechanisms: celiac disease as a model for autoimmune diseases. Semin Immunopathol 34: 567–580. [DOI] [PMC free article] [PubMed] [Google Scholar]
- 9. Risch N, Teng J (1998) The relative power of family-based and case-control designs for linkage disequilibrium studies of complex human diseases I. DNA pooling. Genome Res 8: 1273–1288. [DOI] [PubMed] [Google Scholar]
- 10. Risch N, Merikangas K (1996) The future of genetic studies of complex human diseases. Science 273: 1516–1517. [DOI] [PubMed] [Google Scholar]
- 11. Naluai AT, Nilsson S, Gudjonsdottir AH, Louka AS, Ascher H, et al. (2001) Genome-wide linkage analysis of Scandinavian affected sib-pairs supports presence of susceptibility loci for celiac disease on chromosomes 5 and 11. European journal of human genetics: EJHG 9: 938. [DOI] [PubMed] [Google Scholar]
- 12. Ploski R, Ascher H, Sollid LM (1996) HLA genotypes and the increased incidence of coeliac disease in Sweden. Scand J Gastroenterol 31: 1092–1097. [DOI] [PubMed] [Google Scholar]
- 13. Backes C, Keller A, Kuentzer J, Kneissl B, Comtesse N, et al. (2007) GeneTrail–advanced gene set enrichment analysis. Nucleic Acids Res 35: W186–192. [DOI] [PMC free article] [PubMed] [Google Scholar]
- 14. Naluai AT, Nilsson S, Gudjonsdottir AH, Louka AS, Ascher H, et al. (2001) Genome-wide linkage analysis of Scandinavian affected sib-pairs supports presence of susceptibility loci for celiac disease on chromosomes 5 and 11. Eur J Hum Genet 9: 938–944. [DOI] [PubMed] [Google Scholar]
- 15. Taxman DJ, Holley-Guthrie EA, Huang MT, Moore CB, Bergstralh DT, et al. (2011) The NLR adaptor ASC/PYCARD regulates DUSP10, mitogen-activated protein kinase (MAPK), and chemokine induction independent of the inflammasome. J Biol Chem 286: 19605–19616. [DOI] [PMC free article] [PubMed] [Google Scholar]
- 16. Teng CH, Huang WN, Meng TC (2007) Several dual specificity phosphatases coordinate to control the magnitude and duration of JNK activation in signaling response to oxidative stress. J Biol Chem 282: 28395–28407. [DOI] [PubMed] [Google Scholar]
- 17. Bayardo M, Punzi F, Bondar C, Chopita N, Chirdo F (2012) Transglutaminase 2 expression is enhanced synergistically by interferon-gamma and tumour necrosis factor-alpha in human small intestine. Clin Exp Immunol 168: 95–104. [DOI] [PMC free article] [PubMed] [Google Scholar]
- 18. Luo LJ, Liu F, Wang XY, Dai TY, Dai YL, et al. (2012) An essential function for MKP5 in the formation of oxidized low density lipid-induced foam cells. Cell Signal 24: 1889–1898. [DOI] [PubMed] [Google Scholar]
- 19. Dieterich W, Ehnis T, Bauer M, Donner P, Volta U, et al. (1997) Identification of tissue transglutaminase as the autoantigen of celiac disease. Nat Med 3: 797–801. [DOI] [PubMed] [Google Scholar]
- 20. Wang K, Zhang H, Bloss CS, Duvvuri V, Kaye W, et al. (2011) A genome-wide association study on common SNPs and rare CNVs in anorexia nervosa. Mol Psychiatry 16: 949–959. [DOI] [PubMed] [Google Scholar]
- 21. Paterson AD, Waggott D, Boright AP, Hosseini SM, Shen E, et al. (2010) A genome-wide association study identifies a novel major locus for glycemic control in type 1 diabetes, as measured by both A1C and glucose. Diabetes 59: 539–549. [DOI] [PMC free article] [PubMed] [Google Scholar]
- 22. Lin Z, Bei JX, Shen M, Li Q, Liao Z, et al. (2012) A genome-wide association study in Han Chinese identifies new susceptibility loci for ankylosing spondylitis. Nat Genet 44: 73–77. [DOI] [PubMed] [Google Scholar]
- 23. Liu W, Le A, Hancock C, Lane AN, Dang CV, et al. (2012) Reprogramming of proline and glutamine metabolism contributes to the proliferative and metabolic responses regulated by oncogenic transcription factor c-MYC. Proc Natl Acad Sci U S A 109: 8983–8988. [DOI] [PMC free article] [PubMed] [Google Scholar]
- 24. D’Alessandro G, Calcagno E, Tartari S, Rizzardini M, Invernizzi RW, et al. (2011) Glutamate and glutathione interplay in a motor neuronal model of amyotrophic lateral sclerosis reveals altered energy metabolism. Neurobiol Dis 43: 346–355. [DOI] [PubMed] [Google Scholar]
- 25. Holmes B, Artinian N, Anderson L, Martin J, Masri J, et al. (2012) Protor-2 interacts with tristetraprolin to regulate mRNA stability during stress. Cell Signal 24: 309–315. [DOI] [PMC free article] [PubMed] [Google Scholar]
- 26. Saito T, Jones CC, Huang S, Czech MP, Pilch PF (2007) The interaction of Akt with APPL1 is required for insulin-stimulated Glut4 translocation. J Biol Chem 282: 32280–32287. [DOI] [PubMed] [Google Scholar]
- 27. Xin X, Zhou L, Reyes CM, Liu F, Dong LQ (2011) APPL1 mediates adiponectin-stimulated p38 MAPK activation by scaffolding the TAK1-MKK3-p38 MAPK pathway. Am J Physiol Endocrinol Metab 300: E103–110. [DOI] [PMC free article] [PubMed] [Google Scholar]
- 28. Mao X, Kikani CK, Riojas RA, Langlais P, Wang L, et al. (2006) APPL1 binds to adiponectin receptors and mediates adiponectin signalling and function. Nat Cell Biol 8: 516–523. [DOI] [PubMed] [Google Scholar]
- 29. Wang C, Xin X, Xiang R, Ramos FJ, Liu M, et al. (2009) Yin-Yang regulation of adiponectin signaling by APPL isoforms in muscle cells. J Biol Chem 284: 31608–31615. [DOI] [PMC free article] [PubMed] [Google Scholar]
- 30. Ito M, Nakano T, Erdodi F, Hartshorne DJ (2004) Myosin phosphatase: structure, regulation and function. Mol Cell Biochem 259: 197–209. [DOI] [PubMed] [Google Scholar]
- 31.Goto S, Bono H, Ogata H, Fujibuchi W, Nishioka T, et al.. (1997) Organizing and computing metabolic pathway data in terms of binary relations. Pac Symp Biocomput: 175–186. [PubMed]
- 32. Ashburner M, Ball CA, Blake JA, Botstein D, Butler H, et al. (2000) Gene ontology: tool for the unification of biology. The Gene Ontology Consortium. Nat Genet 25: 25–29. [DOI] [PMC free article] [PubMed] [Google Scholar]
- 33. Takizawa N, Smith TC, Nebl T, Crowley JL, Palmieri SJ, et al. (2006) Supervillin modulation of focal adhesions involving TRIP6/ZRP-1. J Cell Biol 174: 447–458. [DOI] [PMC free article] [PubMed] [Google Scholar]
- 34. Nakagawa T, Setou M, Seog D, Ogasawara K, Dohmae N, et al. (2000) A novel motor, KIF13A, transports mannose-6-phosphate receptor to plasma membrane through direct interaction with AP-1 complex. Cell 103: 569–581. [DOI] [PubMed] [Google Scholar]
- 35. Srivastava N, Sudan R, Saha B (2011) CD40-modulated dual-specificity phosphatases MAPK phosphatase (MKP)-1 and MKP-3 reciprocally regulate Leishmania major infection. J Immunol 186: 5863–5872. [DOI] [PubMed] [Google Scholar]
- 36. Awasthi A, Mathur R, Khan A, Joshi BN, Jain N, et al. (2003) CD40 signaling is impaired in L. major-infected macrophages and is rescued by a p38MAPK activator establishing a host-protective memory T cell response. J Exp Med 197: 1037–1043. [DOI] [PMC free article] [PubMed] [Google Scholar]
- 37. Pina-Vazquez C, Reyes-Lopez M, Ortiz-Estrada G, de la Garza M, Serrano-Luna J (2012) Host-parasite interaction: parasite-derived and -induced proteases that degrade human extracellular matrix. J Parasitol Res 2012: 748206. [DOI] [PMC free article] [PubMed] [Google Scholar]
- 38. Pandhare J, Donald SP, Cooper SK, Phang JM (2009) Regulation and function of proline oxidase under nutrient stress. J Cell Biochem 107: 759–768. [DOI] [PMC free article] [PubMed] [Google Scholar]
- 39. Mangala LS, Arun B, Sahin AA, Mehta K (2005) Tissue transglutaminase-induced alterations in extracellular matrix inhibit tumor invasion. Mol Cancer 4: 33. [DOI] [PMC free article] [PubMed] [Google Scholar]
- 40. Crowley JL, Smith TC, Fang Z, Takizawa N, Luna EJ (2009) Supervillin reorganizes the actin cytoskeleton and increases invadopodial efficiency. Mol Biol Cell 20: 948–962. [DOI] [PMC free article] [PubMed] [Google Scholar]
- 41. Gudjonsdottir AH, Nilsson S, Ek J, Kristiansson B, Ascher H (2004) The risk of celiac disease in 107 families with at least two affected siblings. J Pediatr Gastroenterol Nutr 38: 338–342. [DOI] [PubMed] [Google Scholar]
- 42. Grubin CE, Daniels T, Toivola B, Landin-Olsson M, Hagopian WA, et al. (1994) A novel radioligand binding assay to determine diagnostic accuracy of isoform-specific glutamic acid decarboxylase antibodies in childhood IDDM. Diabetologia 37: 344–350. [DOI] [PubMed] [Google Scholar]
- 43. Kjelleras J, Vaziri-Sani F, Agardh D (2011) Improved efficacy by using the pTnT-rhtTG plasmid for the detection of celiac disease specific tissue transglutaminase autoantibodies in radioligand binding assays. Scand J Clin Lab Invest 71: 701–704. [DOI] [PubMed] [Google Scholar]
- 44. Norris JM, Barriga K, Hoffenberg EJ, Taki I, Miao D, et al. (2005) Risk of celiac disease autoimmunity and timing of gluten introduction in the diet of infants at increased risk of disease. Jama 293: 2343–2351. [DOI] [PubMed] [Google Scholar]
- 45. Vandesompele J, De Preter K, Pattyn F, Poppe B, Van Roy N, et al. (2002) Accurate normalization of real-time quantitative RT-PCR data by geometric averaging of multiple internal control genes. Genome Biol 3: RESEARCH0034. [DOI] [PMC free article] [PubMed] [Google Scholar]
- 46. Howie BN, Donnelly P, Marchini J (2009) A flexible and accurate genotype imputation method for the next generation of genome-wide association studies. PLoS Genet 5: e1000529. [DOI] [PMC free article] [PubMed] [Google Scholar]
- 47. Purcell S, Neale B, Todd-Brown K, Thomas L, Ferreira MA, et al. (2007) PLINK: a tool set for whole-genome association and population-based linkage analyses. Am J Hum Genet 81: 559–575. [DOI] [PMC free article] [PubMed] [Google Scholar]
- 48. Abecasis GR, Cherny SS, Cookson WO, Cardon LR (2002) Merlin–rapid analysis of dense genetic maps using sparse gene flow trees. Nat Genet 30: 97–101. [DOI] [PubMed] [Google Scholar]
- 49. Whittemore AS, Halpern J (1994) A class of tests for linkage using affected pedigree members. Biometrics 50: 118–127. [PubMed] [Google Scholar]
- 50. Spielman RS, McGinnis RE, Ewens WJ (1993) Transmission test for linkage disequilibrium: the insulin gene region and insulin-dependent diabetes mellitus (IDDM). Am J Hum Genet 52: 506–516. [PMC free article] [PubMed] [Google Scholar]
- 51. Kotti S, Bickeboller H, Clerget-Darpoux F (2007) Strategy for detecting susceptibility genes with weak or no marginal effect. Hum Hered 63: 85–92. [DOI] [PubMed] [Google Scholar]
- 52. Rice JP, Neuman RJ (2005) Two-locus models of disease. Genetic Epidemiology 9: 347–365. [DOI] [PubMed] [Google Scholar]
- 53. Risch N (1990) Linkage strategies for genetically complex traits. I. Multilocus models. Am J Hum Genet 46: 222–228. [PMC free article] [PubMed] [Google Scholar]
- 54.Raychaudhuri S, Plenge RM, Rossin EJ, Ng ACY, Purcell SM, et al.. (2009) Identifying Relationships among Genomic Disease Regions: Predicting Genes at Pathogenic SNP Associations and Rare Deletions. PLoS Genet 5. [DOI] [PMC free article] [PubMed]
Associated Data
This section collects any data citations, data availability statements, or supplementary materials included in this article.
Supplementary Materials
A selection of 603 top associated SNPs and the two top HLA SNPs. Based on three inclusion criteria, 603 SNP markers and 383 regions were identified. Our TDT results, where T and U are the expected transmission counts (based on all the posterior imputation probabilities) and corresponding results from Dubois et al. [3].
(DOCX)