Abstract
Speech intelligibility has been shown to improve with prior exposure to a reverberant room environment [Brandewie and Zahorik (2010). J. Acoust. Soc. Am. 128, 291–299] with a spatially separated noise masker. Here, this speech enhancement effect was examined in multiple room environments using carrier phrases of varying lengths in order to control the amount of exposure. Speech intelligibility enhancement of between 5% and 18% was observed with as little as 850 ms of exposure, although the effect's time course varied considerably with reverberation and signal-to-noise ratio. In agreement with previous work, greater speech enhancement was found for reverberant environments compared to anechoic space.
Introduction
Closed-set speech intelligibility in reverberation with a spatially-separated noise masker has been shown to improve when listeners receive prior exposure to the reverberant listening environment (Brandewie and Zahorik, 2010). The Sentence Carrier (SC) condition of that study provided listeners with two sentences of speech materials prior to a speech target, which resulted in over 5 s of exposure to the listening environment. Intelligibility in this condition was 18 percentage points better, on average, than intelligibility under the same stimulus conditions, but without a carrier phrase: That study's No Carrier (NC) condition. Srinivasan and Zahorik (2012) have demonstrated similar results with open-set speech materials. In their study, noise-masked speech intelligibility within a reverberant environment was greater for blocks in which only a single room environment was presented across trials, compared to blocks in which that room environment was presented intermingled with trials from other room environments with different reverberation characteristics. This speech enhancement effect has been attributed to a form of perceptual adaptation in which acoustical effects of the reverberant sound field are functionally suppressed, given that similar enhancement has not been consistently observed in anechoic space (Brandewie and Zahorik, 2010; Srinivasan and Zahorik, 2012).
There is some evidence concerning the upper limit of exposure time in which speech intelligibility ceases to improve. Brandewie and Zahorik (2010) analyzed performance across listeners in the first, second, and third portions of the trial blocks in the SC condition and demonstrated no additional improvement across the block of trials. Srinivasan and Zahorik (2012) performed a similar analysis by comparing performance across listeners in the first, second, and third sets of six sentences in the blocked condition, finding no differences between the sets. These results suggest that once a person is perceptually acclimated to the listening environment there is little to no long-term benefit to speech intelligibility with additional room exposure. This also suggests that the speech enhancement effect occurs after only a few sentences of exposure to the room environment, but the minimum required exposure time and how the pattern of improvement might differ with varying levels of noise and reverberation are currently unknown. More precise estimates of the time course of the enhancement are important, because they may provide clues as to the underlying mechanisms in the normally-functioning auditory system, which may guide future efforts to improve speech understanding in reverberation for hearing-impaired populations.
The aim of this study was to test, in a more precise fashion, how much exposure time to the reverberant room environment is required to gain the speech enhancement benefit. To accomplish this, closed-set noise-masked speech intelligibility was tested with carrier phrases that varied in duration from zero, identical to the NC condition in Brandewie and Zahorik (2010), to the length of two sentences, identical to the SC condition in that same study.
Methods
Listeners
Sixteen (16) listeners (9 female) ages 19–33 yrs participated in this study. All had normal hearing as verified by audiometric screening at 25 dB hearing level (HL) at octave frequencies between 250 and 8000 Hz. Listeners were paid for their participation.
Stimuli
Room modeling. Virtual acoustic techniques were used to simulate the room environments in this study. The techniques were identical to those described by Zahorik (2009), except that an equalization filter was applied to correct for the loudspeaker response used in the head-related transfer function measurement procedures. This simulation technique has been found to produce binaural room impulse responses that are reasonable physical and perceptual approximations to those measured in a real room (Zahorik 2009).
Four rooms were simulated in this experiment (R0, R1, R2, and R3). The dimensions of the simulated rooms and the positions of the listener, speech source, and noise masker were identical to those used by Brandewie and Zahorik (2010). Each room varied only in the absorption properties of the simulated surfaces. The resulting broadband reverberation times (T60) were as follows: R0 (anechoic): 0.015 s; R1: 0.488 s; R2: 1.216 s; and R3: 2.379 s. Each simulated environment presented a speech target simulated to be 1.4 m directly in front of the listener (0° azimuth angle) and a broadband Gaussian noise masker simulated to be 1.4 m directly opposite the listener's right ear (90° azimuth). The masker preceded the speech by 150 ms, during which the masker's amplitude linearly increased from zero to full-scale. The masker was present throughout the speech and ended (without ramping) with the speech.
Speech corpus. Speech materials for this study were from the coordinate response measure (CRM) corpus (Bolia et al., 2000). All combinations of talkers, call-signs, colors, and numbers were used in this experiment.
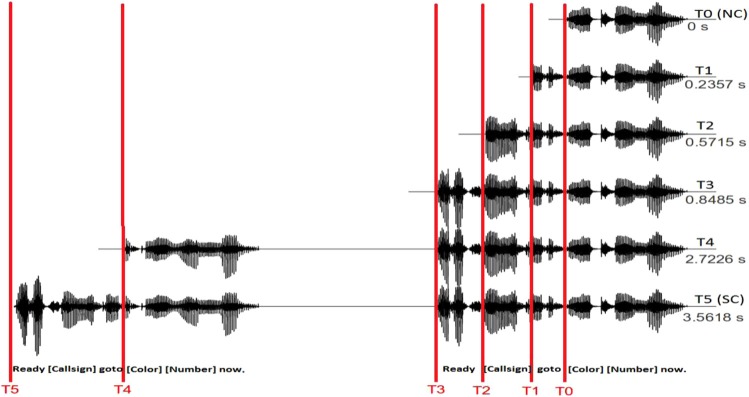
Carrier phrase durations. Six conditions were created that varied in the length of the speech carrier phrase that preceded the target phrase. These durations ranged from no preceding carrier phrase (T0) to a condition containing two full CRM sentences with the target at the end of the second phrase (T5). These durations were based on the median sample where there was a clear break between words across all 2048 CRM sentences. The bottom of Fig. 1 illustrates the points in an example sentence where these breaks were marked. The median point used did not necessarily fall cleanly between words for all the sentences in the corpus. However, due to the very homogeneous nature of the CRM corpus, times when the carrier phrase began during a speech sound were quite rare. This manipulation only affected the preceding carrier phrase and never the speech target. The rationale for this method was to ensure equal carrier phrase durations across sentences. Figure 1 (right-hand side) lists the duration (in seconds) of speech presentation before the start of the target phrase. Example anechoic waveforms for each duration condition are also illustrated in Fig. 1.
Figure 1.

(Color online) Example waveforms are presented for each carrier phrase duration condition (T0, T1, etc.) in the R0 (anechoic) environment (left-ear only). The carrier phrase duration (in seconds) is listed along the right-hand side next to each waveform. On the bottom, a prototypical CRM sentence illustrates the semantic content of each duration condition.
Design and procedure
Listeners were tested at two signal-to-noise ratios (SNRs) between the speech and the noise masker: −13 and −18 dB. These values were chosen in order to avoid ceiling performance in all conditions tested. The SNR was manipulated by adjusting the gain of the speech target relative to a fixed masker level prior to the spatialization and sound field simulation techniques. The room environment was selected at random for each trial with the exception that the same room could not appear in two consecutive trials. The SNR alternated between −13 and −18 dB on each trial. The target color, number, and talker were selected at random for each trial. The listeners were tested in 25 blocks of 96 trials that included two repetitions of 6 durations, 4 rooms, and 2 SNRs. The order of the trials was randomized for each block. Testing occurred in three to four 2-h sessions. Additionally, listeners were tested in two blocks of 50 trials each that contained only room R2 and the T5 duration. The purpose of this condition was to emulate the SC condition of Brandewie and Zahorik (2010) and serve as an estimate of maximal speech enhancement. It will be further referenced as the TB (blocked) condition.
All stimuli were presented (using matlab® software) over equalized headphones (Beyerdynamic DT-990 Pro) at a moderate level [70 dB sound pressure level (SPL) peak at the entrance to the ipsilateral ear] within a double-walled sound-attenuating chamber (Acoustic Systems, Austin, TX). The listener's task was to select the appropriate color and number combination. Feedback was provided.
Results and discussion
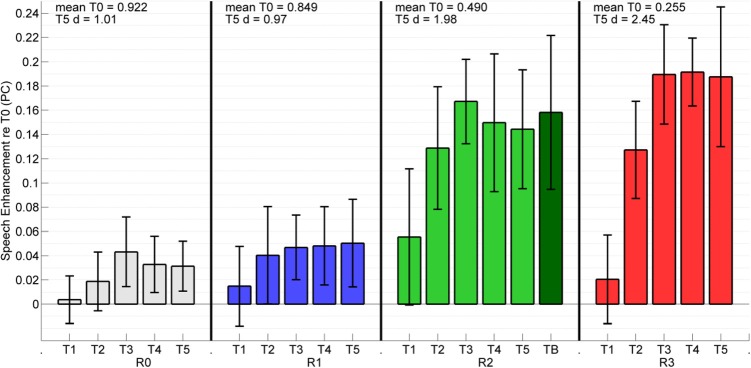
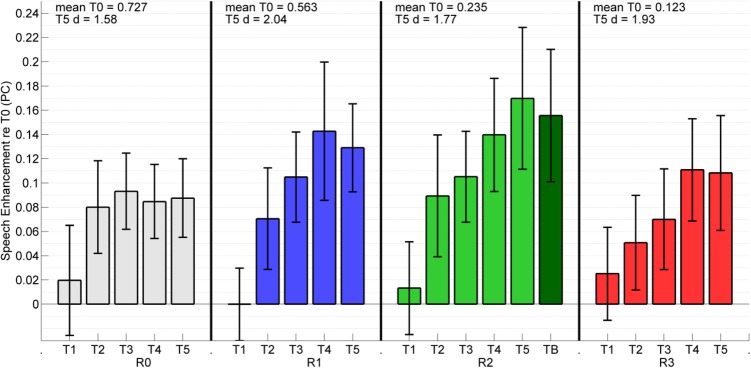
Speech intelligibility scores (proportion correct) were transformed to rationalized arcsine units (RAUs) (Studebaker, 1985) in order to address the non-uniformity of variance near ceiling and floor performance. All data analyses were conducted in RAUs. Speech enhancement was measured as the difference in performance between a given carrier phrase duration condition (T1, T2, etc.) and performance in T0 for each room environment for each listener. The average speech enhancement effects (transformed back to change in proportion correct) across subjects for each room environment are presented in Figs. 23 for the −13 and −18 SNRs, respectively. Error bars represent the 95% confidence intervals for the means. It is evident from a visual observation of these data that enhancement increased with the length of the preceding carrier phrase in every combination of room environment and SNR. This can be observed in Figs. 23 where the 95% confidence limits about the mean enhancement are all above zero. A measure of effect size (Cohen's d) was computed for T5 relative to zero enhancement in each room condition. Results of this analysis are displayed (T5 d) above each section in Figs. 23. In agreement with some preliminary work (Zahorik and Brandewie, 2009) the size of the speech enhancement effect is shown to generally increase with greater reverberation in the environment.
Figure 2.

(Color online) Mean (n = 16) enhancement in speech intelligibility as a function of room/carrier phrase exposure duration for anechoic (R0) and three reverberant room (R1, R2, and R3) listening environments. Enhancement scores represent the difference in intelligibility (in RAUs) between a given exposure duration (T1–T5) and the performance in the no exposure condition (T0). All numerical computations were conducted in RAUs, and then transformed back to proportion correct (PC) for display purposes (see text for details). Data are shown for the −13 SNR condition. Error bars represent the 95% confidence intervals of the mean. Mean intelligibility scores (in proportion correct) are also displayed for each room in the NC condition (mean T0) along with a measure of effect size (Cohen's d) for T5 (T5 d). The blocked R2 T5 condition (TB), an estimate of the enhancement effect's upper bound, is shown as a darker bar in the series.
Figure 3.

(Color online) Identical to Fig. 2, except data are shown for the −18 SNR.
A visual observation of Figs. 23 reveals that at −13 SNR, performance asymptotes with shorter carrier phrase durations compared to −18 SNR, where there is evidence of continuous improvement. At −13 SNR enhancement in the reverberant rooms appear to asymptote at T2 or T3 while at −18 SNR enhancement generally asymptotes at T4. At both SNRs, performance in the R2 T5 case is nearly identical to the R2 TB condition. The combination of these observations indicate that maximal speech enhancement had been attained with 850 ms exposure at −13 SNR, but at −18 SNR the underlying process required additional time but eventually achieved this maximal value after about 2.7 s of room exposure. This suggests that additional exposure time may be required in the presence of higher noise levels.
It seems unlikely that the noise itself contributed information about the reverberant environment to the speech target. Brandewie and Zahorik (2010) provided 1 s of noise prior to the start of the NC target phrase (compared to 150 ms in this study), which the data presented here suggests would have been long enough to elicit some enhancement. However, the enhancement effect sizes in that study were similar to those shown here, suggesting that little enhancement was provided by the masker.
Speech enhancement in the R3 room at −18 SNR is lower than what might be expected based on enhancement at −13 SNR. Above each section in Figs. 23, the mean performance (proportion correct) for the NC condition (mean T0) is displayed. The mean performance in R3 at −18 SNR ranged from 0.12 (T0) to 0.23 (T5) proportion correct as shown. Previous work (Brandewie and Zahorik, 2010) suggests that the underlying psychometric functions of the T0 and T5 conditions would eventually converge at these low performance levels, resulting in smaller speech enhancement effects. Such reasoning can also account for the apparent increase in speech enhancement between −13 and −18 SNR in the R0 and R1 environments where the underlying psychometric functions would be approaching ceiling.
Finally, the data presented here does demonstrate some evidence of speech enhancement effects in the anechoic (R0) environment. The pattern of speech enhancement with increasing carrier phrase duration seems to be somewhat different between the anechoic and the reverberant environments, however. Performance appears to reach an asymptote at short carrier phrase durations in the anechoic environment (T2, 570 ms) compared to the reverberant environments where continual improvement is observed. This effect is especially evident when comparing the data pattern of R0 with R2 at −18 SNR. Additionally, the effect sizes are generally larger for the reverberant environments. Together these observations support the notion that there may be two underlying processes related to this speech enhancement effect: One anechoic process perhaps related to focusing spatial attention on the talker in auditory space (Best et al., 2008), reaching asymptotic performance gain in as little as 570 ms, and another process of perceptual adaptation to the reverberant environment (Watkins and Makin, 2007), that shows an increase in performance with additional exposure time to reverberant sound fields. The difference in the performance patterns between the SNRs in the reverberant environments may indicate that increased noise levels slow the processing of reverberation by the hypothesized speech enhancement mechanism.
Conclusions
The results of this study demonstrate improvements in speech intelligibility of 5 to 18 percentage points with only 850 ms exposure time to a reverberant environment. Performance is shown to generally increase over time as additional exposure to the reverberant environment is provided. The magnitude of the improvement effect varied with room environment (rooms with greater reverberation generally showing larger speech enhancement effects). The time course of the effect also varied with SNR. The −13 SNR data showed asymptotic enhancement around 850 ms and the −18 SNR data showed asymptotic enhancement at 2.7 s of room exposure. An improvement in intelligibility was observed in anechoic space as well, however the effect size was smaller and the pattern of the effect differed from the reverberant environments. Asymptotic performance was reached in as little as 570 ms in anechoic space and this observation did not change with the SNR. Additional studies of these effects may have important implications for how information about the acoustic environment is processed by the auditory system.
Acknowledgments
The authors wish to thank Noah Jacobs for their assistance in data collection. This research was supported by NIH-NIDCD (Grant No. R01DC008168).
References and links
- Best, V., Ozmeral, E. J., Kopco, N., and Shinn-Cunningham, B. G. (2008). “ Object continuity enhances selective auditory attention,” Proc. Natl. Acad. Sci. U.S.A. 105, 13174–13178. 10.1073/pnas.0803718105 [DOI] [PMC free article] [PubMed] [Google Scholar]
- Bolia, R. S., Nelson, W. T., Ericson, M. A., and Simpson, B. D. (2000). “ A speech corpus for multi-talker communications research,” J. Acoust. Soc. Am. 107, 1065–1066. 10.1121/1.428288 [DOI] [PubMed] [Google Scholar]
- Brandewie, E., and Zahorik, P. (2010). “ Prior listening in rooms improves speech intelligibility,” J. Acoust. Soc. Am. 128, 291–299. 10.1121/1.3436565 [DOI] [PMC free article] [PubMed] [Google Scholar]
- Srinivasan, N., and Zahorik, P. (2012). “ Prior listening exposure to a reverberant room improves open-set intelligibility of high-variability sentences,” J. Acoust. Soc. Am. 133(1 ), EL33–EL39. [DOI] [PMC free article] [PubMed] [Google Scholar]
- Studebaker, G. A. (1985). “ A rationalized arcsine transform,” J. Speech Hear. Res. 28(3 ), 455–462. [DOI] [PubMed] [Google Scholar]
- Watkins, A. J., and Makin, S. J. (2007). “ Steady-spectrum contexts and perceptual compensation for reverberation in speech identification,” J. Acoust. Soc. Am. 121(1 ), 257–266. 10.1121/1.2387134 [DOI] [PubMed] [Google Scholar]
- Zahorik, P. (2009). “ Perceptually relevant parameters for virtual listening simulation of small room acoustics,” J. Acoust. Soc. Am. 126, 776–791. 10.1121/1.3167842 [DOI] [PMC free article] [PubMed] [Google Scholar]
- Zahorik, P., and Brandewie, E. (2009). “ Room adaptation effects on speech intelligibility as a function of room reverberation time,” Assoc. Res. Otolaryngol. Abstr. 32, 145. [Google Scholar]


