

Abstract
Objective
We determined the effects of fructose and glucose consumption on plasma acylation stimulating protein (ASP), adiponectin, and leptin concentrations relative to energy intake, body weight, adiposity, circulating triglycerides, and insulin sensitivity.
Design and Methods
32 overweight/obese adults consumed glucose- or fructose-sweetened beverages (25% energy requirement) with their ad libitum diets for 8 weeks, followed by sweetened beverage consumption for 2 weeks with a standardized, energy-balanced diet. Plasma variables were measured at baseline, 2, 8 and 10 weeks, and body adiposity and insulin sensitivity at baseline and 10 weeks.
Results
Fasting and postprandial ASP concentrations increased at 2 and/or 8 weeks. ASP increases correlated with changes in late-evening triglyceride concentrations. At 10 weeks, fasting adiponectin levels decreased in both groups, and decreases were inversely associated with baseline intra-abdominal fat volume. Sugar consumption increased fasting leptin concentrations; increases were associated with body weight changes. 24-h leptin profiles increased during glucose consumption and decreased during fructose consumption. These changes correlated with changes of 24-h insulin levels.
Conclusions
The consumption of fructose and glucose beverages induced changes in plasma concentrations of ASP, adiponectin and leptin. Further study is required to determine if these changes contribute to the metabolic dysfunction observed during fructose consumption.
Keywords: fructose, glucose, obesity, acylation stimulating protein, leptin, adiponectin
Introduction
Consumption of fructose at 25% of energy requirement for 10 weeks increased de novo lipogenesis (DNL), increased visceral adipose deposition, promoted lipid dysregulation, and decreased insulin sensitivity in older, overweight/obese men and women (1). These adverse effects were not observed in subjects consuming glucose, even though they gained the same amount of weight as the subjects consuming fructose (~1.4 kg) (1). These results are important because they illustrate that the major dietary sugars, fructose and glucose, have markedly different metabolic effects in humans, and that the differences are independent of weight gain.
It is well known that the circulating concentrations of acylation stimulating hormone (ASP), leptin and adiponectin; adipocyte hormones which are regulators of lipid metabolism and/or insulin sensitivity; are affected by changes in body weight and by body fat mass and distribution (2,3). Less is known about their modulation in response to the macronutrient content of the diet, and sugars in particular. The primary objective of this study was to determine the effects of fructose and glucose consumption on circulating ASP, adiponectin, and leptin levels in the same subjects who consumed 25% of energy requirement as fructose- or glucose-sweetened beverages for 10 weeks (1). As a secondary objective, we also investigated how the effects of fructose and glucose on these hormones related to the previously reported (1) changes in energy balance, body adiposity, circulating lipids, and insulin sensitivity in these subjects.
ASP is identical to the immune complement pathway cleavage product C3a-des-Arg, and is produced through interaction of three proteins of the alternate complement system; C3, factor B, and adipsin (factor D); all of which are synthesized and secreted by adipocytes (3). ASP increases triglyceride (TG) synthesis in adipose tissue through (i) increasing glucose transport via translocation of glucose transporters Glut 1, 2, and 3 (4); (ii) stimulating fatty acid uptake and esterification (3); (iii) increasing the activity of enzymes related to fat storage, such as diacylglycerol-acyltransferase (5), (iv) inhibiting hormone sensitive lipase (6) and thereby (v) enhancing the efficiency of lipoprotein lipase (LPL) (7,8) by reducing fatty acid inhibition. Adiposity is an important determinant of circulating ASP levels, which are elevated in obese subjects (9) and decrease with weight loss (10). However, this is not the only determinant as patients with metabolic dysfunction, such as type 2 diabetes, cardiovascular disease or polycystic ovary disease, have increased ASP even in the absence of obesity (11,12,13). We hypothesize that, because subjects consuming fructose exhibited both increased weight gain and increased metabolic dysfunction, consumption of fructose will increase levels of ASP more than consumption of glucose. As there is little information available regarding the responses to of ASP to macronutrients, both fasting and postprandial states were evaluated.
Adiponectin has insulin-sensitizing properties that appear to be mediated in part by its effects to activate AMP kinase, increase fatty acid oxidation and decrease ectopic fat accumulation (14). Adiponectin has also been described as having anti-atherogenic and anti-inflammatory properties (15). It prevents obesity-induced endothelial dysfunction by promoting nitric oxide production, suppresses activation and promotes repair of endothelial cells, and inhibits reactive oxygen species and apoptosis (16). Unlike ASP, circulating adiponectin concentrations are lowered in obese animals and humans, and are inversely correlated with visceral adipose tissue, but change little over the course of a day (17,14). We hypothesize that, because consumption of fructose increased accumulation of visceral adipose, subjects consuming fructose will have greater decreases of adiponectin than subjects consuming glucose.
Leptin is a key regulator of energy homeostasis (18,19) that, along with insulin, acts in the hypothalamus and other areas of the brain to reduce energy intake and increase energy expenditure. Leptin can affect insulin sensitivity and this may be mediated by its effects to stimulate fatty acid oxidation, thus attenuating lipid accumulation in peripheral tissue (2). Like ASP, circulating leptin concentrations are positively associated with increased body adiposity (18). However, in vitro studies in isolated adipocytes (20) and in vivo studies in humans (21,22) have demonstrated that production of the adipocyte hormone leptin is strongly regulated by insulin-mediated glucose metabolism. Consumption of fructose compared to glucose results in lowered postprandial glucose and insulin excursions, therefore in short term studies, the 24-hour leptin area under the curve (AUC) was reduced by 25–30% when normal weight women (23) and overweight men and women (24) consumed meals accompanied with fructose-compared with glucose-sweetened beverages. Thus, we hypothesize that sustained fructose consumption will lower 24-h circulating leptin profiles compared with sustained glucose consumption. However, because both groups of subjects gained comparable amounts of body fat, we expect that they will have comparably increased fasting leptin concentrations.
Methods and Procedures
Study design
The study design and methodology have been previously described (1) and are detailed on the online supplement. Briefly, during the baseline phase of the study, subjects resided in the UCD Clinical and Translational Science Center's Clinical Research Center (CCRC) for 2 weeks and consumed an energy-balanced diet which provided their calculated daily energy requirement as 55% of energy (E) as complex carbohydrate, 30%E as fat, 15%E as protein. Procedures conducted during the baseline CCRC visit included DXA scans for quantification of total body fat, abdominal computerized tomography scans for quantification of total, extra- and intra- abdominal fat area, oral glucose tolerance tests with deuterated glucose disposal for assessment of insulin sensitivity, and 24-h serial blood collections. Subjects then began the 10-week intervention while residing at their homes and consuming either fructose- (n=17) or glucose-sweetened (n=15) beverages at 25% of energy requirements with self-selected ad libitum diets. The subjects returned to the CCRC after 2 outpatient weeks for a 2-day inpatient stay and after 8 outpatient weeks for a 2-week inpatient stay. During these inpatient stays, the glucose- or fructose-sweetened beverages were consumed as part of an energy-balanced diet which provided 25%E as sugar, 30%E as complex carbohydrate, 30%E as fat, 15%E as protein. 24-h serial blood collections were conducted during baseline (0wk) and after 2, 8 and 10 weeks (2wk, 8wk, 10wk) of dietary intervention and a detailed description of the procedure is available on the online supplement. All other experimental procedures conducted during baseline were repeated during the final 2 weeks of inpatient intervention.
Subjects
The subjects were men and postmenopausal women, 40 to 72 years of age with BMIs of 25–35 kg/m2. The race/ethnicity of the 32 subjects were: 29 White (5 Hispanic, 24 not Hispanic); 3 African American. Details concerning recruitment and inclusion/exclusion criteria have been previously reported (1) and are available on the online supplement. The subjects provided informed written consent and the study protocol was approved the Institutional Review Board of the University of California, Davis.
Plasma Assays
Plasma concentrations of fasting ASP, adiponectin, and leptin were measured in plasma samples collected or pooled from the 8:00, 8:30, 9:00-h timepoints of the 24-h serial blood collections. Postprandial concentrations of ASP were measured in samples pooled from the 22:00, 23:00, 23:30-h timepoints. Leptin concentrations were measured in samples collected from all 33 postprandial timepoints and the incremental 24-h AUC over the morning nadir was calculated by the trapezoidal method (23). Plasma ASP was measured as described in supplementary methods with details provided as published previously (25,26). Leptin, adiponectin, and insulin were measured by radioimmunoassay (Millipore Inc., St. Charles, MO). TG concentrations were determined with a Polychem Chemistry Analyzer (PolyMedCo, Inc., Cortdland, NY).
Statistical analysis
The absolute change (Δ at 2wk, 8wk, 10wk when the diet contained 25%E as fructose or glucose and 30%E as complex carbohydrate compared with 0wk when the diet contained 55%E as complex carbohydrate) for each outcome was analyzed with SAS 9.3 (SAS, Cary, NC) in a mixed procedures (PROC MIXED), repeated measures (RM) model with time, sugar, gender and metabolic syndrome risk factors (MSRF) as factors. MSRF were those defined by the American Heart Association/National Heart Lung and Blood Institute (27), with subjects grouped into 2 levels of MSRF (0 and 1 MSRF vs 2 and 3 MSRF). All models included adjustment for outcome concentration at 0wk (baseline). Insignificant 3-way and 4-way interactions were removed if they decreased the precision of the model (F statistic < 1). Outcomes that were significantly affected by glucose or fructose consumption were identified as least squares means (LS means) of the change significantly different than zero. All outcomes were tested with the following continuous covariables: baseline value of outcome, the change (10wk – 0 wk) of %body fat, total, extra-, and intra-abdominal fat, and insulin sensitivity index. The following time-level covariables were also tested: absolute change (Δ at 2wk, 8wk, and 10wk compared with 0wk) of body weight (ΔBW), previous day's energy intake, late-evening TG concentrations, and 24-h insulin AUC. Outcomes with significant interactions were further analyzed in sugar- or gender-specific RM models. Values are reported as mean ± standard error (SEM). A P<0.05 was considered statistically significant for all analyses.
Results
Baseline characteristics of the subjects have been previously reported and are available on the online supplement (Table S1). The absolute values of outcomes and covariables at all measured timepoints are provided in Table 1. There were no significant differences between the 2 experimental groups in any of the measured anthropomorphic characteristics or metabolic parameters at baseline. The P-values of the associations of anthropometric and metabolic parameter with sugar-induced changes (Δ) in adipocyte hormone concentrations are shown on the online supplement (Table S2).
Table 1.
Outcome and covariable concentrations before and after consumption of glucose- or fructose-sweetened beverages
| Variable | Sugar (n) | Complex Carb 0 wk | Sugar 2 wk | Sugar 8 wk | Sugar 10 wk | Factors/interactions/covariable | P value |
|---|---|---|---|---|---|---|---|
| Preceding diet | Energy balance | Ad libitum | Ad libitum | Energy balance | |||
| Fasting ASPA | Glucose (n=15) | 9.8 ± 1.4 | 11.3 ± 1.3 | 12.0 ± 1.3B | 9.7 ± 1.3 | Sugar | 0.16 |
| (nmol/l) | Fructose (n=17) | 7.0 ± 0.8 | 12.7 ± 1.3C | 12.6 ± 1.1C | 9.0 ± 0.9 | Gender | 0.47 |
| MSRF | 0.12 | ||||||
| OutcomesB | <0.0001 | ||||||
| Postprandial ASPA | Glucose (n=14)G | 9.7 ± 1.2 | 11.6 ± 1.4 | 13.6 ± 1.7B | 10.7 ± 1.4 | Sugar | 0.29 |
| (nmol/l) | Fructose (n=17) | 9.2 ± 1.3 | 14.4 ± 1.8D | 14.0± 1.6D | 8.9 ± 1.1 | Gender | 0.058 |
| MSRF | 0.019 | ||||||
| Sugar×Gender×t | 0.045 | ||||||
| OutcomeB | 0.0007 | ||||||
| Fasting AdiponectinA | Glucose (n=14)G | 7.7 ± 1.1 | 8.6 ± 1.2B | 8.1 ± 1.2 | 7.0 ± 1.1B | Sugar | 0.1000 |
| (ug/ml) | Fructose (n=17) | 8.1 ± 1.2 | 8.2 ± 1.0 | 7.9 ± 1.1 | 6.9± 1.0C | Gender | 0.087 |
| MSRF | 0.37 | ||||||
| Sugar×Gender×t | 0.039 | ||||||
| OutcomeB | 0.0014 | ||||||
| Fasting LeptinA | Glucose (n=15) | 18.3 ± 3.5 | 19.6 ± 3.2 | 20.2 ± 3.4B | 19.7 ± 3.4B | Sugar | 0.84 |
| (ng/ml) | Fructose (n=17) | 17.3 ± 3.5 | 18.7 ± 3.1 | 19.3 ± 3.7B | 18.2 ± 3.5B | Gender | 0.46 |
| MSRF | 0.84 | ||||||
| OutcomeB | 0.072 | ||||||
| 24-h Leptin AUCA | Glucose (n=14) | 71.2 ± 10.6 | 83.1 ± 21.3 | 81.0 ± 13.6 | 84.8 ± 15.9 | Sugar | 0.026 |
| (ng/ml × 24-h) | Fructose (n=17) | 78.9 ± 11.3 | 51.8 ± 11.3B | 58.1 ± 15.6 | 64.3 ± 11.6 | Gender | 0.24 |
| MSRF | 0.56 | ||||||
| OutcomeB | 0.24 | ||||||
| Body WeightA | Glucose (n=15) | 86.0 ± 2.8 | 86.8 ± 2.8D | 87.5 ± 2.9D | 87.5 ± 3.0D | Sugar | 0.39 |
| (kg) | Fructose (n=17) | 85.5 ± 2.6 | 86.1 ± 2.7C | 86.9 ± 2.6E | 86.8 ± 2.6D | Gender | 0.11 |
| MSRF | 0.32 | ||||||
| OutcomeB | 0.1 | ||||||
| Prior day's energy intakeA | Glucose (n=15) | 2,376 ± 72 | 2,895 ± 197C | 2,803 ± 147D | 2,376 ± 72 | Sugar | 0.61 |
| (kcal) | Fructose (n=17) | 2,469 ± 92 | 3,232 ± 155E | 2,845 ± 170C | 2,469 ± 92 | Gender | 0.0072 |
| MSRF | 0.25 | ||||||
| Late-evening TG peaksA | Glucose (n=15) | 202 ± 25 | 235 ± 22 | 227 ± 21 | 214 ± 20 | Sugar | 0.0069 |
| (mg/dl) | Fructose (n=17) | 211 ± 28 | 296 ± 37C | 283 ± 35C | 275 ± 31D | Gender | 0.071 |
| MSRF | 0.49 | ||||||
| OutcomeB | 0.018 | ||||||
| 24-h Insulin AUCF | Glucose (n=14) | 596.1 ± 118.7 | 699.6 ± 112.0 | 693.0 ± 112.9 | 757.5± 129.6C | Sugar | <0.0001 |
| (ng/ml × 24-h) | Fructose (n=17) | 681.4 ± 112.6 | 426.1 ± 66.6E | 489.1 ± 85.8D | 480.4 ± 72.9D | Gender | 0.56 |
| MSRF | 0.64 | ||||||
| OutcomeB | <0.0001 | ||||||
| Body FatG | Glucose (n=15) | 35.6 ± 2.1 | 36.1 ± 2.0H 33.9 ± 2.2 |
Sugar | 0.84 | ||
| (%) | Fructose (n=17) | 33.6 ± 2.3 | Gender | 0.33 | |||
| MSRF | 0.86 | ||||||
| Total Abdominal FatG | Glucose (n=14) | 765 ± 57 | 794 ± 53 | Sugar | 0.36 | ||
| (cc) | Fructose (n=17) | 683 ± 55 | 731 ± 51 H | Gender | 0.11 | ||
| MSRF | 0.61 | ||||||
| Extra-Abdominal FatG | Glucose (n=14) | 522 ± 59 | 544± 61H | Sugar | 0.64 | ||
| (cc) | Fructose (n=17) | 476 ± 43 | 495 ± 38 | Gender | 0.82 | ||
| MSRF | 0.40 | ||||||
| Intra-Abdominal FatG | Glucose (n=14)G | 243 ± 21 | 250 ± 23 | Sugar | 0.059 | ||
| (cc) | Fructose (n=17) | 207 ± 21 | 235 ± 25H | Gender | 0.049 | ||
| MSRF | 0.21 | ||||||
| Insulin SensitivityG | Glucose (n=14) | 0.236 ± 0.036 | 0.210 ± 0.021 | Sugar | 0.030E | ||
| (mmoles 2H20/4-h Insulin AUC) | Fructose (n=17) | 0.254 ± 0.049 | 0.208 ± 0.040I | Gender | 0.033E | ||
| MSRF | 0.19E | ||||||
PROC MIXED 4-factor (sugar, time, gender, MSRF) repeated measures (RM) model on change from 0wk with outcome at 0wk (OutcomeB) as continuous covariable.
P < 0.05,
P < 0.01,
P < 0.001,
P < 0.0001 Least squares mean of the change from 0 wk different from zero.
PROC MIXED 4-factor (sugar, time, gender, MSRF) repeated measures (RM) model on change from 0wk with outcome at 0wk (OutcomeB) as continuous covariable on previously reported data (Stanhope, AJCN, 2011).
General Linear Model (GLM) 3-factor ANOVA on 10 wk vs 0 wk difference as previously reported (Stanhope, JCI, 2009).
p < 0.05,
P < 0.01, Paired t test, 10wk vs 0wk
t: time
Mean ± SEM
Both fasting (Figure 1A) and postprandial (Figure 1B) ASP concentrations were increased during consumption of fructose at 2wk (Fasting: P=0.0006; Postprandial: P=0.0015) and 8wk (Fasting: P=0.0007; Postprandial: P=0.0007), but not at 10wk. Fasting (P=0.031) and postprandial (P=0.020) ASP concentrations were increased during consumption of glucose at 8wk only. The trend for ASP levels to be higher at 2wk and 8wk was significant in the postprandial state (P=0.0029, effect of time), and nearly so in the fasting state (P=0.054). The Δfasting and postprandial ASP were not significantly affected by sugar (Fasting: P=0.16; Postprandial: P=0.29).
Figure 1. Effects of glucose or fructose consumption on fasting and postprandial plasma ASP concentrations.
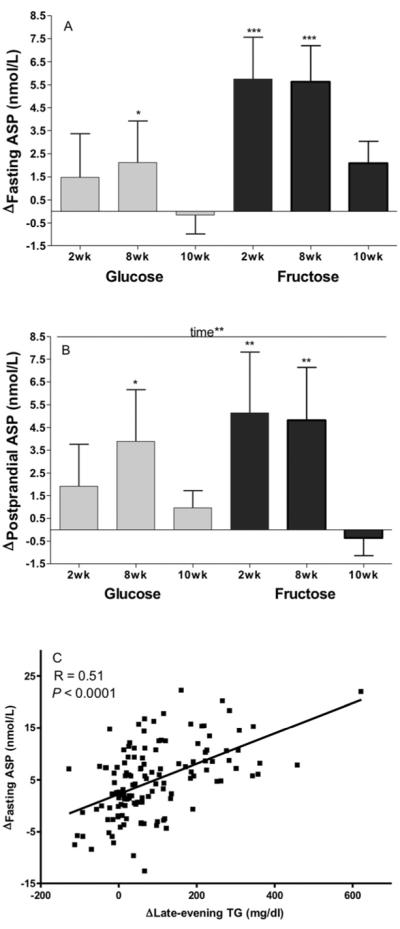
Changes (Δ) at 2wk, 8wk and 10wk compared to baseline (0wk) in the fasting (A) and postprandial (B) ASP levels of subjects who consumed 25% of energy requirement as either glucose (n=15) or fructose-sweetened beverages (n=17). Effect of: Time** p<0.01 in PROC MIXED 4-factor (sugar, time, gender, MSRF) repeated measures (RM) model with outcome at 0wk (OutcomeB) as continuous covariable. *P<0.05, **P<0.01, ***P<0.001, Least squares mean of the change different from zero. Results are presented as mean ± SEM. (C) Correlation between change (Δ) in fasting ASP and change (Δ) in late-evening (postprandial) triglyceride (TG) at 2wk, 8wk and 10wk .
The effects of gender (P=0.47) and MSRF (P=0.12) on Rfasting ASP were not significant, however the effect of plasma ASP concentrations at baseline was highly significant (P<0.0001). When subjects were divided into 2 equal groups based on baseline ASP concentrations, subjects with low ASP concentrations (<7.0 nmol/mL) had markedly higher increases of fasting ASP at 2wk (+9.1±1.3 vs −1.6±1.5 nmol/mL, P<0.0001) and 8wk (+8.5±1.1 vs −0.5±1.5 nmol/mL, P<0.0001) than subjects with high baseline ASP concentrations.
Subjects with 0–1 metabolic syndrome risk factors (MSRF) had greater increases of postprandial ASP levels at all three intervention time-points than subjects with 2–3 MSRF (P=0.019). The effect of MSRF was independent of the effect of baseline postprandial ASP concentrations, which, as with fasting ASP, were inversely associated with Δpostprandial ASP (P=0.0007). In the postprandial state, the effect of gender (P=0.058) was nearly significant, and there was a significant sugar × gender × time effect (P=0.045), due to the women consuming fructose having larger increases of ASP than the men consuming fructose.
The sugar-specific models demonstrate that the significant effects of time and MSRF on Δpostprandial ASP in the 2-sugar model were mainly mediated by consumption of fructose. In the glucose-specific model the effects of time (P=0.24), MSRF (P=0.98), and MSRF × time (P=0.88) were not significant (Figure 2A), nor were the effects of gender (P=0.83) and gender × time (P=0.79) (Figure 2C). In the fructose-specific model the effects of time (P=0.0003), MSRF (P=0.0087), and MSRF × time (P=0.0005) were all statistically significant (Figure 2B), as were the effects of gender (P=0.045) and gender × time (P=0.0004) (Figure 2D).
Figure 2. Effects of metabolic syndrome risk factors (MSRF) and gender on the changes in postprandial plasma ASP concentrations in subjects consuming glucose or fructose.

Changes at 2wk, 8wk and 10wk compared to baseline (0wk) in postprandial ASP levels of subjects grouped by number of MSRF during consumption of glucose (A) (n=15) or fructose-sweetened beverages (B) (n=17). Changes at 2wk, 8wk and 10wk compared to baseline (0wk) in postprandial ASP levels of subjects grouped by gender during consumption of glucose (C) (n=15) or fructose-sweetened beverages (D) (n=17). Effect of: Time*** p<0.001, MSRF* p<0.05, MSRF × time*** p<0.001, gender* p<0.05, gender × time*** p<0.001 in sugar-specific PROC MIXED 3-factor (time, gender, MSRF) RM model with outcome at 0wk as continuous covariable. **P<0.01, ***P<0.001, ****P<0.0001, Least squares mean of the change different from zero.
In pursuing our secondary objective, three time-level covariates were tested, and Δfasting ASP was significantly associated with Δlate-evening TG concentrations (P=0.0051), but not with Δbody weight or previous day's energy intake (Table S2). Simple regression analysis shows (Figure 1C) that the subjects with larger increases of the late evening TG peaks had greater increases of fasting ASP concentrations (r=0.510, P<0.0001). The Δlate-evening TG concentrations (P=0.046) was also a significant contributor to the variations in postprandial ASP. None of the continuous covariates tested in the model (the Δ%body fat, total, extra-, intra-abdominal fat, insulin sensitivity index (10wk – 0 wk)) were associated with Δfasting or postprandial ASP (Table S2).
The Δfasting plasma adiponectin concentrations (Figure 3A) was not significantly affected by sugar (P=0.10), MSRF (P=0.37) or gender (P=0.087), but was affected by time (P<0.001). Compared to baseline (0wk) levels, adiponectin concentrations in subjects consuming glucose were increased at 2wk (P=0.023), and decreased at 10wk (P=0.028). Circulating adiponectin concentrations were unchanged at 2wk (P=0.77) and decreased at 10wk (P=0.0011) in subjects consuming fructose. There was a significant effect of sugar × gender × time (P=0.039). Gender-specific models showed a significant effect of sugar × time in women (Figure 3B; P=0.0011), but not in men (Figure 3C; P=0.57), with women consuming glucose having larger increases of plasma adiponectin concentrations at 2wk and 8wk than at 10wk. (P=0.0014).
Figure 3. Effects of glucose or fructose consumption on fasting plasma adiponectin concentrations in overweight and obese subjects.

Changes (Δ) at 2wk, 8wk and 10wk compared to baseline (0wk) in the fasting (A) adiponectin levels of subjects who consumed 25% of energy requirement as either glucose (n=15) or fructose-sweetened beverages (n=17). Effect of: Time**** P<0.0001 in PROC MIXED 4-factor (sugar, time, gender, MSRF) RM model with outcome at 0wk as continuous covariable. *P<0.05, **P<0.01, Least squares mean of the change different from zero. Changes at 2wk, 8wk and 10wk compared to baseline (0wk) in fasting adiponectin levels of women (B) and men (C) during consumption of glucose (n=15) or fructose-sweetened beverages (B). Effect of: Time** P<0.05, Time**** P<0.0001, Sugar × time*** P<0.001 in gender-specific PROC MIXED 3-factor (time, sugar, MSRF) RM model with outcome at 0wk as continuous covariable. *P<0.05, Least squares mean of the change different from zero. Results are presented as mean ± SEM. (D) Correlation between the 10wk changes (Δ) in fasting adiponectin and baseline intra-abdominal fat volume.
The Δfasting plasma adiponectin concentration was also significantly affected by fasting adiponectin concentrations at baseline (P=0.0014). Subjects with high baseline levels of adiponectin (>7 ug/ml) exhibited greater decreases (−1.5±0.4 ug/ml) of circulating adiponectin at 10wk than subjects with low baseline levels (−0.5±0.2 ug/ml, P=0.018).
The Δfasting adiponectin concentrations was influenced by total (P=0.024) and intra-abdominal (P=0.036) fat volume at baseline (Table S2). The subjects with lower baseline levels of total and intra-abdominal fat exhibited the greater decreases in adiponectin. These adiposity associations with adiponectin were independent of baseline adiponectin concentration, which remained a significant covariate in both models (Total fat: P<0.0001; Intra-abdominal fat: P=0.0015). Simple regression showed that the relationship between baseline intra-abdominal fat and the Δadiponectin was especially strong at 10wk (P=0.0004, r=0.59, Figure 3D).
Both subjects consuming fructose (8wk: P=0.0081; 10wk: P=0.027) or glucose (8wk: P=0.023; 10wk: P=0.032) had significantly increased fasting leptin concentrations at 8wk and 10wk (Figure 4), and this change was not significantly affected by sugar (P=0.84), time (P=0.36), MSRF (P=0.84), or gender (P=0.44). The Δfasting leptin was significantly affected by the Δbody weight (P=0.014); subjects gaining the most weight had the largest increases of leptin. The Δ%body fat from 0wk to 10wk was a marginally significant contributor to the Δfasting leptin (P=0.055), while the changes and baseline levels of total, extra-, and intra-abdominal fat were not (Table S2).
Figure 4. Effects of glucose or fructose consumption on fasting leptin concentrations.

Changes (Δ) at 2wk, 8wk and 10wk compared to baseline (0wk) in the fasting leptin levels of subjects who consumed 25% of energy requirement as either glucose (n=15) or fructose-sweetened beverages (n=17). PROC MIXED 4-factor (sugar, time, gender, MSRF) RM model with outcome at 0wk as continuous covariable. *P<0.05, Least squares mean of the change different from zero.
The Δpostprandial leptin was significantly affected by sugar (P=0.026) with subjects consuming glucose tending to have increased and subjects consuming fructose tending to have decreased 24-h leptin AUCs compared to when they consumed the baseline complex carbohydrate diet (Figure 5). The Δleptin AUC was not affected by time (P=0.51), MSRF (P=0.56), or gender (P=0.24) (Table 1). The Δ%body fat (P=0.031) contributed significantly to the Δleptin AUC, and simple regression showed there was a strong positive relationship at 10wk (r=0.39; P=0.0015). The Δ24-h insulin AUC significantly affected the Δ24-h leptin AUC (P=0.0035), while completely negating the significant effect of sugar (P=0.70) and lessening the effect of Δ%body fat (P=0.093). Simple regression, including all 3 intervention timepoints (Figure 5D), showed the expected positive relationship between the Δleptin and insulin AUCs (P<0.0001, r=0.40).
Figure 5. Effects of glucose or fructose consumption on 24-h leptin profiles.

24-h circulating TG concentrations in subjects before and after 2, 8, and 10 weeks of consuming glucose-sweetened beverages (A) (n=14) or fructose-sweetened beverages (B) (n=17). (C) Changes (Δ) at 2wk, 8wk and 10wk compared to baseline (0wk) in the 24-h leptin AUCs of the subjects who consumed glucose or fructose-sweetened beverages. Effect of: Sugar* P < 0.05 in PROC MIXED 4-factor (sugar, time, gender, MSRF) RM model. Mean ± SEM. (D) Correlation between changes (Δ) in 24-h leptin AUC and 24-h insulin AUC at 2wk, 8wk and 10wk.
DISCUSSION
In this study we examined circulating concentrations of the adipocyte hormones; ASP, leptin, and adiponectin; in relationship with dietary effects and metabolic consequences of 10-week fructose and glucose consumption in overweight and obese men and women. We had hypothesized that, because subjects consuming fructose exhibited both increased weight gain and metabolic dysfunction, including marked increases of postprandial TG, consumption of fructose would increase levels of ASP more than consumption of glucose. We found that plasma ASP levels were markedly increased during consumption of fructose at 2wk and 8wk, but not at 10wk. Consumption of glucose also resulted in significant, although less marked, increases in ASP at 8wk.
Our further investigation of how the effects of fructose and glucose on ASP related to the previously reported (1) changes in energy balance, body adiposity, circulating lipids, and insulin sensitivity in these subjects revealed that the changes in both fasting and postprandial ASP were associated with the changes of late-evening TG concentrations. Along with LPL and insulin, ASP has an important role in TG clearance from the blood for storage in adipose tissue. Principally, ASP stimulates reesterification of fatty acids for synthesis of TG within the adipocyte. The positive association between the changes in ASP and postprandial TG levels suggest that postprandial TG may be involved in the regulation of ASP production, and this is supported by evidence from in vitro studies which demonstrates that chylomicrons increase ASP production while VLDLs have minimal effect (28). We have suggested several mechanisms for the increased levels of postprandial TG in subjects consuming fructose including (1).1. Increased DNL from fructose, which increases hepatic lipid and VLDL production and secretion. 2. Decreased LPL activity due to lowered post-meal insulin responses. 3. Competition between very low density lipoprotein (VLDL) and chylomicron for LPL binding sites. We also suggested that positive energy balance contributed to the increases in postprandial TG at 2 and 8wk (1). It is not known which, if any, of these mechanisms explain the association between the changes of ASP and postprandial TG. Little is known about the regulation of ASP by circulating lipids/lipoproteins in vivo. The significant increases of postprandial ASP at 2 and 8wk in subjects consuming fructose, and the lack of increase at 10wk when they were consuming the energy-balanced diet, suggest that positive energy balance may augment the effects of postprandial TG to increase ASP.
The very few studies that have investigated acute or chronic effects of macronutrients on human ASP concentration suggest ASP-mediated non-esterified fatty acids (NEFA) trapping (and re-esterification) could be an important determinant of a healthy lipoprotein phenotype (29). In hypercholesterolemic women, a diet high in trans fatty acids decreased fasting ASP levels compared with a diet high in polyunsaturated fatty acids and the decrease was associated with reduced clearance of fatty acids and higher levels of apolipoprotein B (30). In 141 healthy men and women, the acute ASP response to a high fat/high-energy meal significantly predicted postprandial TG and NEFA clearance, and both ASP response and lipid clearance were inversely related to fasting plasma ASP levels (31). Thus, the subjects with low plasma ASP concentrations had increased ASP response to an oral fat challenge compared with subjects with high ASP levels. The present data are in accord with these acute effects, in that the subjects with low fasting ASP levels had significantly higher increases of ASP after 2 and 8 weeks exposure to fructose-induced postprandial hypertriglyceridemia than the subjects with high fasting ASP levels. Interestingly, the present data also show that subjects consuming fructose with 0–1 metabolic syndrome risk factors (MSRF) had higher postprandial ASP responses than those with 2–3 MSRF, and the effect of MSRF was independent of the effect of baseline postprandial ASP concentrations. These results support the suggestion that ASP-mediated NEFA trapping could be associated with a healthy lipoprotein phenotype. Also supportive is a recent report that the adipose gene expression of factors related to lipid uptake and processing; such as ASP, LPL, low density lipoprotein receptor protein 1, and fatty acid binding protein 4; were lower in morbidly obese patients than in lean healthy persons (32). Thus, although obesity results in high levels of circulating ASP, high ASP responses to diets that increase levels of TG may be an adaptation that helps maintain metabolic equilibrium.
Circulating adiponectin concentrations are known to be inversely correlated with visceral adipose tissue (14), therefore we had hypothesized that, because subjects consuming fructose had increased accumulation of visceral adipose, they would have greater decreases of adiponectin than subjects consuming glucose. We found that fasting adiponectin concentrations were significantly decreased at 10wk in both groups of subjects, although there was a small, but significant increase of adiponectin at 2wk in subjects consuming glucose. As reviewed (14), there is evidence to suggest that adiponectin production by adipocytes may be regulated by insulin-stimulated glucose utilization. In 3T3-L1 cells, adiponectin production increased following insulin and high glucose treatment (33), and adiponectin mRNA increased with augmented insulin-stimulated glucose uptake (34). Thus, the regulation of adiponectin production by insulin-stimulated glucose utilization may possibly explain the significant increase of adiponectin levels during consumption of glucose, but not fructose, at 2wk. The reversal of this effect, and the significant decrease in adiponectin measured in both groups of subjects at 10wk could be attributed to their comparable weight gain as it is well documented that adiponectin levels are inversely related to adiposity. However, weight gain does not always result in reduced adiponectin levels. Young, healthy subjects, who gained approximately 6 kg in 4 weeks by increasing fast food consumption and decreasing exercise, had increased levels of fasting insulin, leptin and C reactive protein, but plasma adiponectin levels were unchanged (35).
Our further investigation of how the effects of fructose and glucose on circulating adiponectin related to the previously reported (1) changes in energy balance, body adiposity, circulating lipids, and insulin sensitivity in these subjects revealed that the changes of visceral fat did not correlate with the changes of adiponectin. Instead, baseline levels of abdominal and visceral adiposity were significant contributors, with higher levels of abdominal and visceral adiposity being more protective against decreases of adiponectin than lower levels. Similarly, low baseline adiponectin concentrations were associated with smaller decreases of adiponectin. A potential explanation for these surprising, independent relationships is visceral adipocyte size. As reviewed by Swarbrick and Havel (14), there is evidence to suggest that visceral adipocytes, which have been shown to produce more adiponectin than subcutaneous adipocytes, become less insulin-sensitive and secrete less adiponectin as they enlarge. It is possible that the healthier subjects in this study, with higher baseline concentrations of adiponectin and lower amounts of visceral adipose, had small, insulin-sensitive visceral adipocytes that had capacity for further enlargement as body weight and fat increased. With enlargement these visceral adipocytes became less insulin-sensitive and produced less adiponectin. In contrast, the subjects with lower baseline adiponectin concentrations and higher levels of visceral adipose had larger, more insulin resistant visceral adipocytes. These larger adipocytes may have been less responsive to weight and fat gain because they had limited capacity for further enlargement and adiponectin production was already at a low level.
Recently it was reported that higher circulating adiponectin levels predicted weight gain in the participants in the Nurses' Health Study (36). The authors suggested that high adiponectin production by adipocytes might be a sign of “healthy” adipose tissue with further capacity to store fat. However, in two other studies, higher baseline adiponectin concentrations were predictive of greater loss of weight and body fat in morbidly obese subjects after Roux-en-Y gastric bypass surgery (37,38). Clearly, more research is needed to understand the role of adiponectin concentrations in predisposition to weight loss and weight gain under dynamic conditions.
Circulating leptin concentrations are well known to be positively associated with increased body adiposity. Therefore, we had hypothesized, that because the two groups of subjects gained comparable amounts of total body fat, that they would exhibit comparable increases of fasting leptin concentrations. The results supported this hypothesis; leptin concentrations increased in both groups of subjects. Our further investigation of how the effects of fructose and glucose on fasting leptin concentrations related to the previously reported (1) changes in anthropometrics showed that the increases of fasting leptin concentrations were significantly and positively associated with the changes of body weight. Of the 2-timepoint covariates, the change in total body fat (10wk – 0wk) showed a marginally significant and much stronger relationship to the changes of fasting leptin than the changes in total, intra- and extra-abdominal adipose. This is expected as it has been previously reported that leptin secretion (39) is higher in subcutaneous adipose samples compared to visceral samples from the same subjects.
We hypothesized that sustained fructose consumption would lower 24-h circulating leptin profiles compared with sustained glucose consumption and the results supported this hypothesis. The 24-h circulating leptin profiles were significantly affected by the 2 sugars, in that consumption of glucose tended to increase and consumption of fructose tended to decrease 24-h leptin AUC. We have previously shown this differential effect of glucose and fructose consumption on 24-hour circulating leptin profiles in normal-weight women (23) and in overweight men and women (24) who consumed glucose- or fructose-sweetened beverages with meals for one day. To our knowledge this is the first study to document that the differential effects of fructose and glucose on 24-hour circulating leptin concentrations are sustained during longer term (10 weeks) consumption of the 2 sugars.
When designing this study, we had hypothesized that lowered 24-h leptin concentrations would lead to increased energy intake and/or decreased energy expenditure and weight gain in subjects consuming fructose compared to those consuming glucose. To test this hypothesis, we included in the study protocol the 8-week outpatient period during which subjects consumed their usual diets ad libitum along with the glucose- or fructose-sweetened beverages. It is interesting that 24-h circulating leptin levels were lowered in subjects consuming fructose compared with those consuming glucose, yet there were no differences in reported energy intake or weight gain between the 2 groups.
Because we have reported that insulin-stimulated glucose utilization mediates leptin production and secretion by adipocytes (20), we further investigated how the effects of fructose and glucose on 24-h leptin AUC related to the changes of 24-h glucose and insulin AUC, and the amplitude of the post-meal glucose and insulin peaks. We have previously reported that these parameters were increased in the subjects consuming glucose and decreased in the subjects consuming fructose (40). These results showed that 24-h insulin AUC was positively associated with 24-h leptin AUC, and that the differential effects of fructose and glucose on circulating leptin profiles were dependent on their differential effects on 24-h circulating insulin profiles (AUCs).
In this study, long-term sugar consumption with ad libitum feeding led to changes in circulating levels of three different adipocyte hormones, ASP, adiponectin, and fasting and postprandial leptin. The changes of each of these hormones were associated with specific and distinct metabolic parameters. Fasting and postprandial ASP were associated with postprandial TG, adiponectin with baseline abdominal and visceral fat, fasting leptin with body weight, and 24-h leptin profiles with 24-h circulating insulin concentrations. More research is needed to determine if the observed changes of these adipocyte hormones contribute to multiple metabolic derangements induced by consumption of fructose.
Supplementary Material
ACKNOWLEDGMENTS
This research was supported with funding from NIH grant R01 HL-075675 and by CIHR (to KC). K. Cianflone holds a Canada Research Chair in Adipose Tissue. The project also received support from Grant Number UL1 RR024146 from the National Center for Research Resources (NCRR), a component of the National Institutes of Health (NIH), and NIH Roadmap for Medical Research. Dr. Keim's research is supported by intramural USDA-ARS CRIS 5306-51530-016-00D. Dr. Havel has since received funding for further research on the metabolic effects of sugar consumption from NIH grants RO1 HL HL091333 and RO1 HL HL HL107256. Dr. Stanhope is supported by a Building Interdisciplinary Research Careers in Women's Health award (K12 HD051958) funded by the National Institute of Child Health and Human Development (NICHD), Office of Research on Women's Health (ORWH), Office of Dietary Supplements (ODS), and the National Institute of Aging (NIA).
The authors thank Marinelle Nuñez, James Graham, and Elaine Souza for their excellent technical support, and Nicole Mullen and the nursing staff at CCRC for their dedicated nursing support. We also thank Janet Peerson for expert advice on the statistical analysis of the data, and Melanie Cianflone for manuscript preparation.
Abbreviations
- ASP
Acylation stimulating protein
- ApoB
apolipoprotein B
- BMI
Body mass index
- AUC
Area under the curve
- DNL
de novo lipogenesis
- LPL
lipoprotein lipase
- MSRF
Metabolic syndrome risk factors
- NEFA
non-esterified fatty acid
- TC
Total cholesterol
- TG
Triglyceride
- VLDL
Very low density lipoprotein
Footnotes
Disclosure: Dr. Havel and Dr. Stanhope have received travel funds and honoraria for presentations on the topic of the metabolic effects of sugar consumption at scientific conferences. They have also received honoraria for writing reviews on the topic of the metabolic effects of sugar consumption. Dr. Berglund receives consulting income from Danone Institute. The other authors have no disclosures or conflicts of interest to declare.
REFERENCES
- 1.Stanhope KL, Schwarz JM, Keim NL, et al. Consuming fructose-sweetened, not glucose-sweetened, beverages increases visceral adiposity and lipids and decreases insulin sensitivity in overweight/obese humans. J Clin Invest. 2009;119:1322–1334. doi: 10.1172/JCI37385. [DOI] [PMC free article] [PubMed] [Google Scholar]
- 2.Havel PJ. Update on adipocyte hormones; regulation of energy balance and carbohydrate/lipid metabolism. Diabetes. 2004;53:S143–S151. doi: 10.2337/diabetes.53.2007.s143. [DOI] [PubMed] [Google Scholar]
- 3.Cianflone K, Xia Z, Chen LY. Critical review of acylation-stimulating protein physiology in humans and rodents. Biochimica et Biophysica Acta. 2003;1609:127–143. doi: 10.1016/s0005-2736(02)00686-7. [DOI] [PubMed] [Google Scholar]
- 4.Germinario R, Sniderman AD, Manuel S, Pratt Lefebvre S, Baldo A, Cianflone K. Coordinate regulation of triacylglycerol synthesis and glucose transport by acylation-stimulating protein. Metabolism. 1993;42:574–580. doi: 10.1016/0026-0495(93)90215-a. [DOI] [PubMed] [Google Scholar]
- 5.Yarsuel Z, Cianflone K, Sniderman AD, Rosenbloom M, Walsh M, Rodrigez MA. Effect of acylation stimulating protein on the triacylglycerol synthetic pathway of human adipose tissue. Lipids. 1991;16:495–499. doi: 10.1007/BF02536592. [DOI] [PubMed] [Google Scholar]
- 6.Van Harmelen V, Reynisdottir S, Cianflone K, et al. Mechanisms involved in the regulation of free fatty acid release from isolated human fat cells by acylation stimulating protein and insulin. J Biol Chem. 1999;274:18243–18251. doi: 10.1074/jbc.274.26.18243. [DOI] [PubMed] [Google Scholar]
- 7.Faraj M, Sniderman AD, Cianflone K. ASP enhances in situ lipoprotein lipase activity by increasing fatty acid trapping in adipocytes. J Lipid Res. 2004;4:657–666. doi: 10.1194/jlr.M300299-JLR200. [DOI] [PubMed] [Google Scholar]
- 8.Paglialunage S, Julien P, Tahiri Y, et al. Lipoprotein lipase deficiency is associated with elevated acylation stimulating protein plasma levels. J Lipid Res. 2009;50:1109–1119. doi: 10.1194/jlr.M800430-JLR200. [DOI] [PMC free article] [PubMed] [Google Scholar]
- 9.Sniderman AD, Maslowska M, Cianflone K. Of mice and men (and women) and the acylation-stimulating protein pathway. CurrOpin Lipidol. 2000;11:291–296. doi: 10.1097/00041433-200006000-00010. [DOI] [PubMed] [Google Scholar]
- 10.Faraj M, Jones P, Sniderman AD, Cianflone K. Enhanced dietary fat clearance in postobese women. J Lipid Res. 2001;42:571–580. [PubMed] [Google Scholar]
- 11.Yang Y, Lu HL, Zhang J, et al. Relationships among acylation stimulating protein, adiponectin and complement C3 in lean vs obese type 2 diabetes. Int J Obes. 30:439–446. doi: 10.1038/sj.ijo.0803173. 20106. [DOI] [PubMed] [Google Scholar]
- 12.Cianflone K, Zhang XJ, Genest J, Sniderman AD. Plasma acylation stimulating protein in coronary artery disease. Arterioscler Tromb Vasc Biol. 1997;17:1239–1244. [PubMed] [Google Scholar]
- 13.Wu Y, Zhang J, Wen Y, Wang H, Zhang M, Cianflone K. Increased acylation stimulating protein, C-reactive protein, and lipid levels in young women with polycystic ovary syndrome. Fertil Steril. 2009;91:213–219. doi: 10.1016/j.fertnstert.2007.11.031. [DOI] [PubMed] [Google Scholar]
- 14.Swarbrick MM, Havel PJ. Physiological, pharmacological, and nutritional regulation of circulating adiponectin concentrations in humans. Metab Syndr RelatDisord. 2008;6:87–102. doi: 10.1089/met.2007.0029. [DOI] [PMC free article] [PubMed] [Google Scholar]
- 15.Cui J, Panse S, Falkner B. The role of adiponectin in metabolic and vascular disease: a review. Clin Nephrol. 2011;75:26–33. [PubMed] [Google Scholar]
- 16.Hui X, Lam KS, Vanhoutte PM, Xu A. Adiponectin and Cardiovascular Health: an Update. Br J Pharmacol. 2011 doi: 10.1111/j.1476-5381.2011.01395.x. Epub ahead of print: [DOI] [PMC free article] [PubMed] [Google Scholar]
- 17.Gavrila A, Peng CK, Chan JL, Mietus JE, Goldberger AL, Mantzoros CS. Diurnal and ultradian dynamics of serum adiponectin in healthy men: comparison with leptin, circulating soluble leptin receptor, and cortisol patterns. J Clin Endocrinol Metab. 2003;88:2838–2843. doi: 10.1210/jc.2002-021721. [DOI] [PubMed] [Google Scholar]
- 18.Havel PJ. Peripheral signals conveying metabolic information to the brain: short-term and long-term regulation of food intake and energy homeostasis. Biol Med (Maywood) 2001;226:963–977. doi: 10.1177/153537020122601102. [DOI] [PubMed] [Google Scholar]
- 19.Farooqi IS, O'Rahilly S. Leptin: a pivotal regulator of human energy homeostasis. Am J Clin Nutr. 2009;89:980S–984S. doi: 10.3945/ajcn.2008.26788C. [DOI] [PubMed] [Google Scholar]
- 20.Mueller WM, Gregoire FM, Stanhope KL, et al. Evidence that glucose metabolism regulates leptin secretion from cultured rat adipocytes. Endocrinology. 1998;139:551–558. doi: 10.1210/endo.139.2.5716. [DOI] [PubMed] [Google Scholar]
- 21.Wellhoener P, Fruehwald-Schultes B, Kern W, et al. Glucose metabolism rather than insulin is a main determinant of leptin secretion in humans. J Clin Endocrinol Metab. 2000;85:1267–1271. doi: 10.1210/jcem.85.3.6483. [DOI] [PubMed] [Google Scholar]
- 22.Griffen SC, Oostema K, Stanhope KL, et al. Administration of Lispro insulin with meals improves glycemic control, increases circulating leptin, and suppresses ghrelin, compared with regular/NPH insulin in female patients with type 1 diabetes. J ClinEndocrinol Metab. 2006;91:485–491. doi: 10.1210/jc.2005-1338. [DOI] [PubMed] [Google Scholar]
- 23.Teff KL, Elliott SS, Tschöp M, et al. Dietary fructose reduces circulating insulin and leptin, attenuates postprandial suppression of ghrelin, and increases triglycerides in women. J Clin Endocrinol Metab. 2004;89:2963–2972. doi: 10.1210/jc.2003-031855. [DOI] [PubMed] [Google Scholar]
- 24.Teff KL, Grudziak J, Townsend RR, et al. Endocrine and metabolic effects of consuming fructose- and glucose-sweetened beverages with meals in obese men and women: influence of insulin resistance on plasma triglyceride responses. J Clin Endocrinol Metab. 2009;94:1562–1569. doi: 10.1210/jc.2008-2192. [DOI] [PMC free article] [PubMed] [Google Scholar]
- 25.Saleh J, Summers LK, Cianflone K, Fielding BA, Sniderman AD, Frayn KN. Coordinated release of acylation stimulating protein (ASP) and triacylglycerol clearance by human adipose tissue in vivo in the postprandial period. J Lipid Res. 1998;39:884–891. [PubMed] [Google Scholar]
- 26.Maslowska M, Vu H, Phelis S, et al. Plasma acylation stimulating protein, adipsin and lipids in non-obese and obese populations. Eur J Clin Invest. 1999;29:679–686. doi: 10.1046/j.1365-2362.1999.00514.x. [DOI] [PubMed] [Google Scholar]
- 27.Al-Daghri NM, Al-Attas OS, Al-Rubeaan K, Sallam R. Adipocytokine profile of type 2 diabetics in metabolic syndrome as defined by various criteria. Diabetes Metab Res Rev. 2008;24:52–58. doi: 10.1002/dmrr.763. [DOI] [PubMed] [Google Scholar]
- 28.Maslowska M, Scantlebury T, Germinario R, Cianflone K. Acute in vitro production of acylation stimulating protein in differentiated human adipocytes. J Lipid Res. 1997;38:1–11. [PubMed] [Google Scholar]
- 29.Van Oostrom AJ, van Dijk H, Verseyden C, et al. Addition of glucose to an oral fat load reduces postprandial free fatty acids and prevents the postprandial increase in complement component 3. Am J Clin Nutr. 2004;79:510–515. doi: 10.1093/ajcn/79.3.510. [DOI] [PubMed] [Google Scholar]
- 30.Matthan NR, Cianflone K, Lichtenstein AH, Ausman LM, Jauhiainen M, Jones PJ. Hydrogenated fat consumption affects acylation-stimulating protein levels and cholesterol esterification rates in moderately hypercholesterolemic women. J Lipid Res. 42:1841–1848. 200. [PubMed] [Google Scholar]
- 31.Cianflone K, Zakarian R, Couillard C, Delplanque B, Despres JP, Sniderman A. Fasting acylation-stimulating protein is predictive of postprandial triglyceride clearance. J Lipid Res. 2004;45:124–131. doi: 10.1194/jlr.M300214-JLR200. [DOI] [PubMed] [Google Scholar]
- 32.Clemente-Postigo M, Queipo-Ortuño MI, Fernandez-Garcia D, Gomez-Huelgas R, Tinahones FJ, Cardona F. Adipose tissue gene expression of factors related to lipid processing in obesity. PLoS One. 2011;6:e24783. doi: 10.1371/journal.pone.0024783. [DOI] [PMC free article] [PubMed] [Google Scholar]
- 33.Carvalho CR, Bueno AA, Mattos AM, et al. Fructose alters adiponectin, haptoglobin and angiotensinogen gene expression in 3T3-L1 adipocytes. Nutr Res. 2010;30:644–649. doi: 10.1016/j.nutres.2010.06.012. [DOI] [PubMed] [Google Scholar]
- 34.Zhu S, Sun F, Li W, et al. Apelin stimulates glucose uptake through the PI3K/Akt pathway and improves insulin resistance in 3T3-L1 adipocytes. Mol Cell Biochem. 2011;353:305–313. doi: 10.1007/s11010-011-0799-0. [DOI] [PubMed] [Google Scholar]
- 35.Astrand O, Carlsson M, Nilsson I, Lindström T, Borga M, Nystrom FH. Fast Food Study Group. Weight gain by hyperalimentation elevates C-reactive protein levels but does not affect circulating levels of adiponectin or resistin in healthy subjects. Eur J Endocrinol. 2010;163:879–885. doi: 10.1530/EJE-10-0763. [DOI] [PubMed] [Google Scholar]
- 36.Hivert MF, Sun Q, Shrader P, Mantzoros CS, Meigs JB, Hu FB. Higher adiponectin levels predict greater weight gain in healthy women in the Nurses' Health Study. Obesity (Silver Spring) 2011;19:409–415. doi: 10.1038/oby.2010.189. [DOI] [PMC free article] [PubMed] [Google Scholar]
- 37.Faraj M, Havel PJ, Phélis S, Blank D, Sniderman AD, Cianflone K. Plasma acylation-stimulating protein, adiponectin, leptin, and ghrelin before and after weight loss induced by gastric bypass surgery in morbidly obese subjects. J Clin Endocrinol Metab. 2003;88:1594–1602. doi: 10.1210/jc.2002-021309. [DOI] [PubMed] [Google Scholar]
- 38.Swarbrick MM, Stanhope KL, Austrheim-Smith IT, et al. Longitudinal changes in pancreatic and adipocyte hormones following Roux-en-Y gastric bypass surgery. Diabetologia. 2008;51:1901–1911. doi: 10.1007/s00125-008-1118-5. [DOI] [PMC free article] [PubMed] [Google Scholar]
- 39.Van Harmelen V, Reynisdottir S, Eriksson P, et al. Leptin secretion from subcutaneous and visceral adipose tissue in women. Diabetes. 1998;47:913–917. doi: 10.2337/diabetes.47.6.913. [DOI] [PubMed] [Google Scholar]
- 40.Stanhope KL, Griffen SC, Bremer AA, et al. Metabolic responses to prolonged consumption of glucose- and fructose-sweetened beverages are not associated with postprandial or 24-h glucose and insulin excursions. Clin Nutr. 2011;94:112–119. doi: 10.3945/ajcn.110.002246. [DOI] [PMC free article] [PubMed] [Google Scholar]
Associated Data
This section collects any data citations, data availability statements, or supplementary materials included in this article.