Abstract
Objective
To evaluate whether a panel of common biomedical markers can be utilized as trajectories to determine survival in pediatric burn patients.
Summary Background Data
Despite major advances in clinical care, of the more than 1 million people burned in the United States each year, more than 4,500 die as a result of their burn injuries. The ability to predict patient outcome or anticipate clinical trajectories using plasma protein expression would allow personalization of clinical care to optimize the potential for patient survival.
Methods
Two-hundred thirty severely burned children with burns exceeding 30% of the total body surface, requiring at least one surgical procedure were enrolled in this prospective cohort study. Demographics, clinical outcomes, as well as inflammatory and acute-phase responses (serum cytokines, hormones, and proteins) were determined at admission and at 11 time points for up to 180 days postburn. Statistical analysis was performed using a one-way ANOVA, Student’s t-test, Chi-square, and Mann-Whitney tests where appropriate.
Results
Survivors and non-survivors exhibited profound differences in critical markers of inflammation and metabolism at each time point. Non-survivors had significantly higher serum levels of IL-6, IL-8, granulocyte colony-stimulating factor, monocyte chemoattractant protein-1, c-reactive protein, glucose, insulin, blood urea nitrogen, creatinine, and bilirubin (p<0.05). Furthermore, non-survivors exhibited a vastly increased hypermetabolic response that was associated with increases in organ dysfunction and sepsis when compared with survivors (p<0.05).
Conclusions
Non-survivors have different trajectories in inflammatory, metabolic, and acute phase responses allowing differentiation of non-survivors from survivors and now possibly allowing novel predictive models to improve and personalize burn outcomes.
Keywords: burn size, hypermetabolism, inflammation, pediatric, critical care, mortality, survival
INTRODUCTION
Treatment of severely burned patients has dramatically changed over the last decades leading to improved outcomes, so that survival from a severe burn is no longer the exception, but rather the rule even for victims at the extremes of age.1–3 Unfortunately, although severely burned patients are more likely to survive, death still occurs. Known primary determinants of mortality from severe burn injury are age, presence of inhalation injury, sepsis, and burn size.1–3 Besides these factors, another major contributor to adverse outcomes population is the profound hypermetabolic metabolic response.2, 4 The magnitude and duration of this metabolic response is related to the severity of the original burn injury.5 This response significantly retards growth and induces devastating muscle and protein catabolism, insulin resistance, and cardiac dysfunction that persist for months after discharge.4–7 Patients have supraphysiologic metabolic rates, develop multiple organ dysfunction, and express increased levels of systemic inflammatory cytokines and acute-phase proteins.4, 5, 7 More recently, trauma-induced hyperglycemia has been linked to poor outcomes such as impaired wound healing, increased skin graft loss, augmented muscle protein catabolism, and a greater incidence of infection and mortality.8, 9
Despite the large impact of the hypermetabolic, inflammatory, and acute phase responses on patient outcome, the clinicians’ ability to predict survival has remained limited. The “gold standard” of age, burn size, and inhalation injury traditionally has been used to predict mortality. We have recently shown, however, that this set of predictors is only accurate for predicting non-survival for 54% of patients who die (Finnerty, unpublished data).10 We and others have used cytokines and other plasma markers to create biomarker profiles in an attempt to predict patient outcome (Finnerty, unpublished data).10–12 However, the challenges faced in these studies whether either single time points, small sample numbers, and not well-defined endpoints such as mortality. Hence, to date, no large study exists that prospectively identifies biomarkers and biomarker trajectories associated with mortality. Identification of potential biomarkers would not only enable identification of patients unlikely to survive burn injury, but also allow for individualized treatment including heightened monitoring of clinical progression and more aggressive treatment, greatly improving outcome. Here, we conducted a prospective cohort study to compare trajectories of common markers of metabolism and inflammation for use as biomarkers of survival in severely burned patients.
MATERIALS AND METHODS
Patients
This study was reviewed and approved by the Institutional Review Board of the University Texas Medical Branch, Galveston, Texas. Prior to the study, each subject, parent, or child’s legal guardian signed a written informed consent form. All thermally injured pediatric patients included in this study had burns covering over 30% of their total body surface area (TBSA) admitted over a 12-year period, required at least one surgical intervention, and consented to an IRB-approved experimental protocol.
Admission data
All patients were treated at the Shriners Hospitals for Children-Galveston pediatric burn intensive care unit according to standardized protocols.4 Patients were resuscitated if needed according to the Galveston formula, with 5,000 cc/m2 TBSA burned + 2,000 cc/m2 TBSA lactated Ringer’s solution being given in increments over the first 24 hours. Within 24 hours of admission, all patients underwent total burn wound excision. The wounds were then covered with available autograft skin, and any remaining open areas were covered with homograft. The donor site healed within 5–10 days after the first operative procedure. At this time, patients returned to the operation theater. The procedure was then repeated until all open wound areas were covered with autologous skin material. The time between operations served as an index of wound healing/re-epithelialization. This time has previously been shown to be indicative of when donor sites are healed and allow for determination of wound healing.
All patients received the same nutritional treatment according to a standardized protocol. Intake was calculated as follows: 1,500 kcal/m2 body surface + 1,500 kcal/m2 area burn. Alternatively, intake was determined by measuring the resting energy expenditure (REE) and multiplying this value by 1.4 with weekly adjustments, as previously described.4
Patient data and clinical characteristics
Upon admission, burn size and severity were assessed and recorded on a standard Lund and Browder chart by the attending burn surgeon. Patient demographics (age, date of burn and admission, gender, burn size, and depth of burn) and concomitant injuries such as inhalation injury, sepsis, morbidity, and mortality were recorded. Sepsis was defined as a positive blood culture or pathologic tissue culture identifying the pathogen during hospitalization or at autopsy, in combination with at least three of the following: leucocytosis or leucopenia (>12,000 or <4,000), hyperthermia or hypothermia (>38.5 or <36.5°C), tachycardia (>150 BPM in children), refractory hypotension (systolic blood pressure <90 mmHg), thrombocytopenia (platelets <50,000/mm3), hyperglycemia (serum glucose >240 mg/dl), and enteral feeding intolerance (residuals >200 cc/h or diarrhea >1 L/day) as previously published.4, 13
Time points
Results obtained during the 180-day period after burn injury were divided into eleven different time blocks: 0–1, 2–7, 8–10, 11–16, 17–22, 23–28, 29–34, 35–40, 41–60, 61–90, and 91–180 days postburn. These time points were chosen according to admission, OR’s, and recovery periods. These time points resulted from many discussions and previous studies. Multiple measurements were collected from each patient; for each assessment, the average value reported at each time point is the average of 20 to 110 measurements; on the heat map, average values may include 1–4 measurements – these cases are indicated by “XXX” within the cell for that time point. This data was included as little information exists for late time points in patients who do not survive the injury. One-hundred seven non-burned children who consented for research studies and required blood and/or 24-hour urine collections served as the normal cohort; these values have been previously reported.4, 6, 7
Serum cytokine, protein, and hormone measurements
Blood was collected from burn patients for serum cytokine and hormone analysis per hospital protocol. Collections were performed at the time of admission, pre-operatively, every Monday and Thursday at 6:00 AM, and during subsequent clinical visits for surgical or rehabilitation services. Blood was drawn in a serum-separator collection tube and centrifuged for 10 minutes at 1,320 rpm. The resulting serum was removed and stored at −70°C until assayed.
Serum hormones were determined using HPLC and ELISA techniques.4 The Bio-Plex Human Cytokine 17-Plex panel was used with the Bio-Plex Suspension Array System (Bio-Rad, Hercules, CA) to profile expression of IL-1β, IL-2, IL-4, IL-5, IL-6, IL-7, IL-8, IL-10, IL-12p70, IL-13, IL-17, granulocyte colony-stimulating factor (G-CSF), granulocyte-macrophage colony-stimulating factor (GM-CSF), interferon-gamma (IFN-γ), monocyte chemoattractant protein-1 (MCP-1), macrophage inflammatory protein-1-beta (MIP-1β), and tumor necrosis factor (TNF).4, 14 The assay was performed according to the manufacturer’s instructions. Levels of acute phase and constitutive proteins were measured using a nephelometric technique (BN II Plasma Protein Analyzer, Dade Behring/Siemens Healthcare, Deerfield, IL) according to manufacturer’s instructions.4, 7
Indirect calorimetry
As part of routine clinical practice, all patients underwent REE measurements weekly during acute hospitalization and during admissions for reconstructive operations performed between discharge and 180 days postburn. REE was measured using a Sensor-Medics Vmax 29 metabolic cart (Yorba Linda, CA, USA) as previously published.4 REE was calculated from the oxygen consumption and carbon dioxide production by equations described before.15 For statistical comparison, measured energy expenditure was expressed as the percentage of the basal metabolic rate predicted compared with predicted norms based upon the Harris-Benedict equation and to body mass index.15
Cardiac function
M-Mode echocardiograms were completed as follows: at the time of the study, none of the patients presented with or previously suffered from other concomitant diseases affecting cardiac function, such as diabetes mellitus, coronary artery disease, long-standing hypertension, or hyperthyroidism. Study variables included: resting cardiac output (CO), cardiac index (CI), stroke volume (SV), resting heart rate and left ventricular ejection fraction. SV and CO were adjusted for body surface area and expressed as indexes. All cardiac ultrasound measurements were made with the Sonosite Titan echocardiogram with a 3.5 MHz transducer. Recordings were performed with the subjects in a supine position and breathing freely. M-Mode tracings were obtained at the level of the tips of the mitral leaflets in the parasternal long axis position and measurements were performed according to the American Society of Echocardiography recommendations. Left ventricular volumes determined at end diastole and end systole were used to calculate EF, SV, CO and CI. Three measurements were performed and averaged for data analysis.4, 16
Ethics and statistics
ANOVA with post-hoc Bonferroni's correction, paired and unpaired Student’s t-tests, Chi-square analysis, and Mann-Whitney tests were used where appropriate. Data are expressed as mean ± SD or SEM, as indicated. Values of p less than 0.05 were accepted as significant. A Kaplan-Meier curve is presented to show mortality.
Role of the funding source
All funding sources had no involvement in data collection, data analysis, data interpretation, and writing of the report. All authors had access to the data, vouch for its accuracy and completeness, and approved the final report before submission for publication.
RESULTS
Patient characteristics
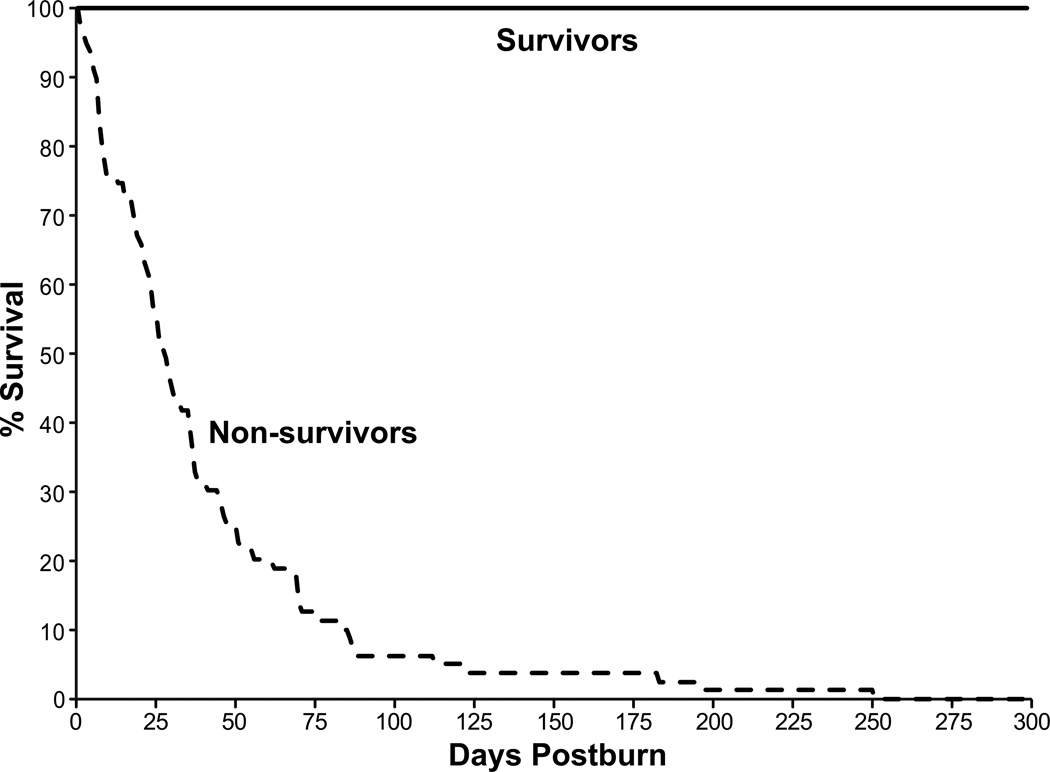
Two-hundred thirty severely burned children were enrolled in this study, 79 died within 300 days of the burn injury (Figure 1). The characteristics of the surviving and non-surviving patients are provided in Table 1. The survivor and non-survivor groups had a similar age, burn size, extent of third-degree burns, and time from burn to admission (p>0.05). Non-survivors had a significantly higher maximal Denver 2 Score (6.7 ± 2.2 vs. 3.4 ± 1.5, p<0.001) as well as higher incidences of multiple organ failure (79% vs. 27%, p<0.001) and septic events (54% vs. 7%, p<0.001). No differences in the number of infections and the incidence of inhalation injury were detected between groups (Table 1).
Fig. 1.
Time-dependent changes in survival after burn.
Table 1.
Patient characteristics.
| Characteristica | Non-survivor n=79 |
Survivor n=151 |
p value |
|---|---|---|---|
| Mortality n (%) | 79 (100) | 0 (0) | <0.001 |
| Gender | |||
| Male | 45 | 85 | |
| Female | 34 | 64 | |
| Age at admission (years) | 8 ± 6 | 7 ± 5 | NS |
| Inhalation injury n (%) | 51 (65) | 65 (43) | |
| Type of burn | |||
| Flame n (%) | 68 (86) | 123 (82) | |
| Scald n (%) | 9 (11) | 23 (15) | |
| Other n (%) | 2 (3) | 5 (3) | |
| TBSAb burned (%) | 74 ± 19 | 70 ± 19 | NS |
| TBSAb with 3rd-degree (%) burns | 65 ± 26 | 60 ± 27 | NS |
| Time from burn to admission (days) (days | 2.9 ± 3.5 | 2.9 ± 6.5 | NS |
| Number of operations | 5.8 ± 4.3 | 5.9 ± 4.3 | NS |
| LOSc ICU (days) | 35 ± 39 | 45 ± 34 | NS |
| LOSc/TBSAb | 0.5 ± 0.4 | 0.6 ± 0.4 | <0.005 |
| Max DENVER2 | 6.7 ± 2.2 | 3.4 ± 1.5 | <0.001 |
| Number with MOFd n (%) | 62 (79) | 40 (27) | <0.001 |
| Number with sepsis n (%) | 43 (54) | 11 (7) | <0.001 |
| Number of infections | 3.4 ± 3.1 | 2.9 ± 2.6 | NS |
Data are presented as mean ± SD;
TBSA, total body surface area;
LOS, length of stay;
MOF, multiple organ failure.
Serum inflammatory and acute phase responses
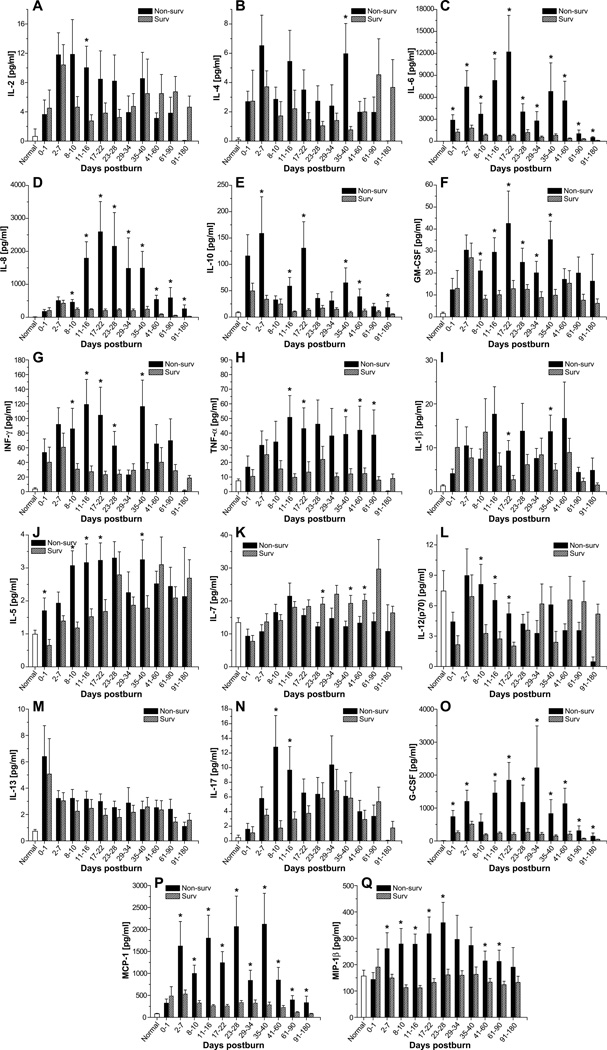
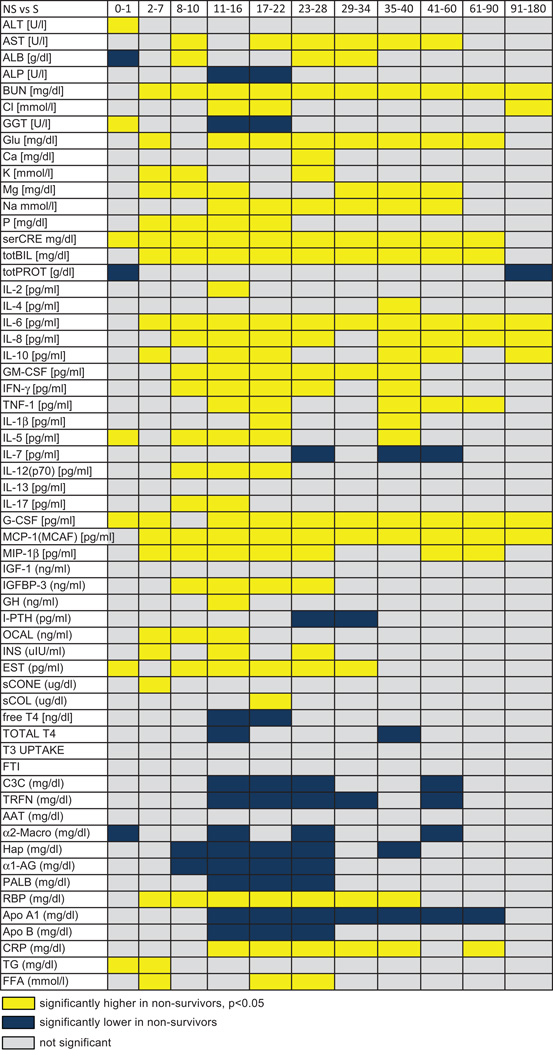
Most of the cytokines measured were significantly altered in response to burn injury which is in agreements with previous studies.4, 7, 14 By comparing severely burned survivors and non-survivors, we found significant differences in serum levels of IL-1β, IL-2, IL-4, IL-5, IL-6, IL-7, IL-8, IL-10, IL-12, IL-17, GM-CSF, INF-γ, TNF-α, G-CSF, MCP-1, and MIP-1β (Figure 2). Dramatic differences were observed in serum levels of IL-6, IL-8, G-CSF and MCP-1, p<0.05 (Figure 2). These cytokines increased by up to 10,000-fold in non-surviving patients and remained significantly elevated throughout the study period when compared to surviving patients. While IL-6, G-CSF, and MCP-1 rapidly increased after burn, IL-8 could not be used to distinguish between survivors and non-survivors until 8–10 days postburn. At this point, survivors began to return to normal while in non-survivors, IL-8 levels increased and remained elevated for the duration of the study, p<0.05. IL-5, IL-10, GM-CSF, INF-γ, TNF-α, and MIP-1β were 2- to 20-fold higher in non-survivors than in survivors at most time points studied. On the other hand, levels of IL-1β, IL-2, IL-4, IL-7, IL-12, and IL-17 were significantly increased at specific time points, with there being no discernable pattern of secretion for these cytokines, p<0.05. Serum levels of IL-13 did not significantly differ between groups.
Fig. 2.
Inflammatory profiles of survivors and non-survivors. Serum levels of IL-2 (A), IL-4 (B), IL-6 (C), IL-8 (D), IL-10 (E), GM-CSF (F), IFN-γ (G), TNF-α (H), IL-1β (I), IL-5 (J), IL-7 (K), IL-12 (p70) (L), IL-13 (M), IL-17 (N), G-CSF (O), MCP-1 (P), and MIP-1β (Q). Data are expressed as the mean ± SEM. *p<0.05 for survivors vs. non-survivors.
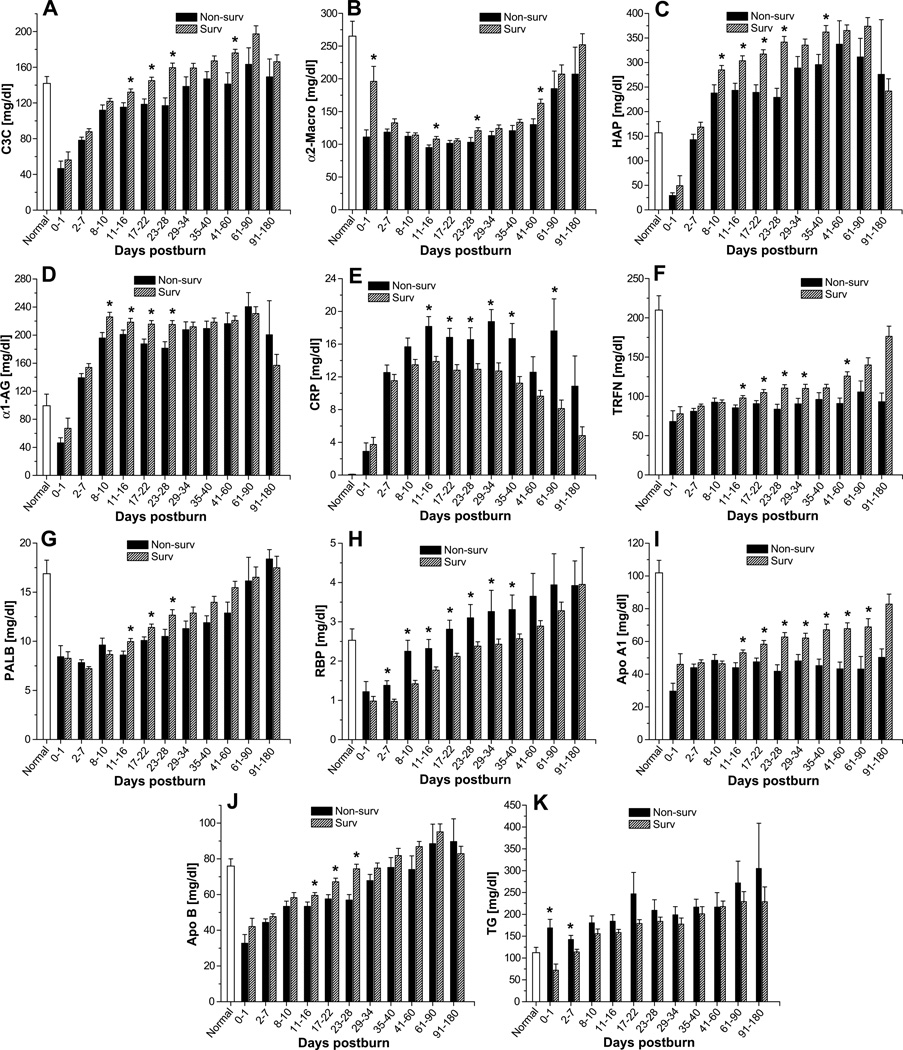
Serum levels of acute-phase proteins were significantly altered upon burn injury, as previously described.4, 7 Complement C3, α2-macroglobulin, haptoglobin, and α1-acid glycoprotein were moderately, albeit significantly, lower in non-survivors than in survivors (Figure 3A–D). In contrast, c-reactive protein levels were significantly higher in the non-survivor group (Figure 3E). Serum levels of the constitutively expressed hepatic protein retinol-binding protein were moderately higher in non-survivors than survivors beginning 2–7 days after injury and continuing until 35–40 days after injury (p<0.05) (Figure 3H). The reverse was true for the other constitutively expressed hepatic proteins, pre-albumin and transferrin. These proteins were moderately lower in non-survivors than in survivors beginning 11–16 days postburn and lasting until 23–28 days (pre-albumin) or 41–60 days (transferrin) after injury (p<0.05) (Figure 3F–G). Both apolipoprotein A1 and apolipoprotein B were also lower in non-survivors than survivors. Apolipoprotein A1 was slightly lower from 11–16 days until 61–90 days after burn injury (p<0.05) (Figure 3I), while apolipoprotein B was lower from 11–16 days to 23–28 days after injury (p<0.05) (Figure 3J). Serum triglycerides gradually increased upon burn injury and demonstrated significantly elevated levels between 17–180 days post trauma (Figure 3K).
Fig. 3.
Hepatic protein levels in survivors and non-survivors. Serum levels of complement C3 (A), α2-macroglobulin (B), haptoglobin (HAP) (C), α1-acidglycoprotein (D), C-reactive protein (E), transferrin (F), pre-albumin (G), retinol-binding protein (H), apolipoprotein A1 (I), apolipoprotein B (J), and triglycerides (K). Data are expressed as the mean ± SEM. *p<0.05 for survivors vs. non-survivors.
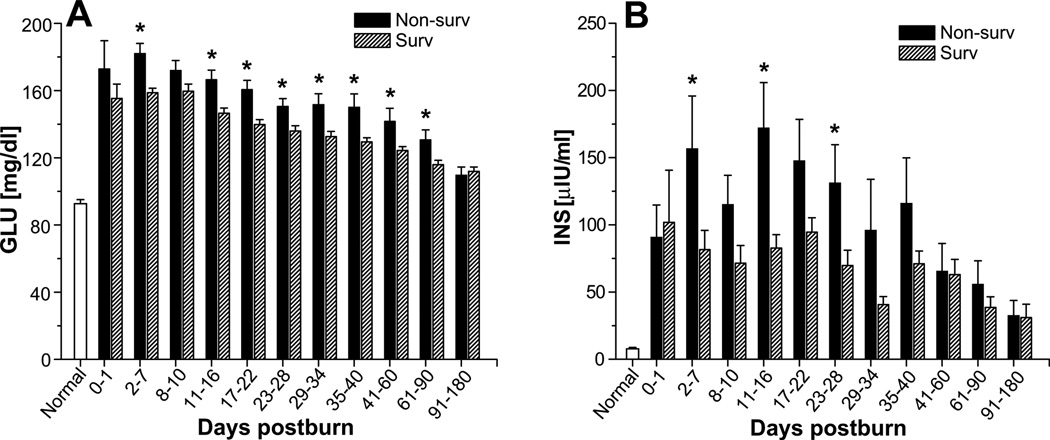
Serum glucose levels were significantly higher in non-survivors than in survivors. This difference was apparent 2–7 days after burn injury and lasted 61–90 days after injury (p<0.05) (Figure 4A). Serum glucose significantly increased immediately upon burn injury to levels of 156 ± 2 mg/dl and remained significantly elevated for a period of 180 days before gradually decreasing to levels within the normal physiologic range, p<0.05. Soon after injury, serum insulin levels were also higher in non-survivors and remained elevated for 23–28 days (p<0.05) (Figure 4B).
Fig. 4.
Glucose and insulin levels in survivors and non-survivors. Serum levels of glucose (A) and insulin (B). Data are expressed as the mean ± SEM. *p<0.05 for survivors vs. non-survivors.
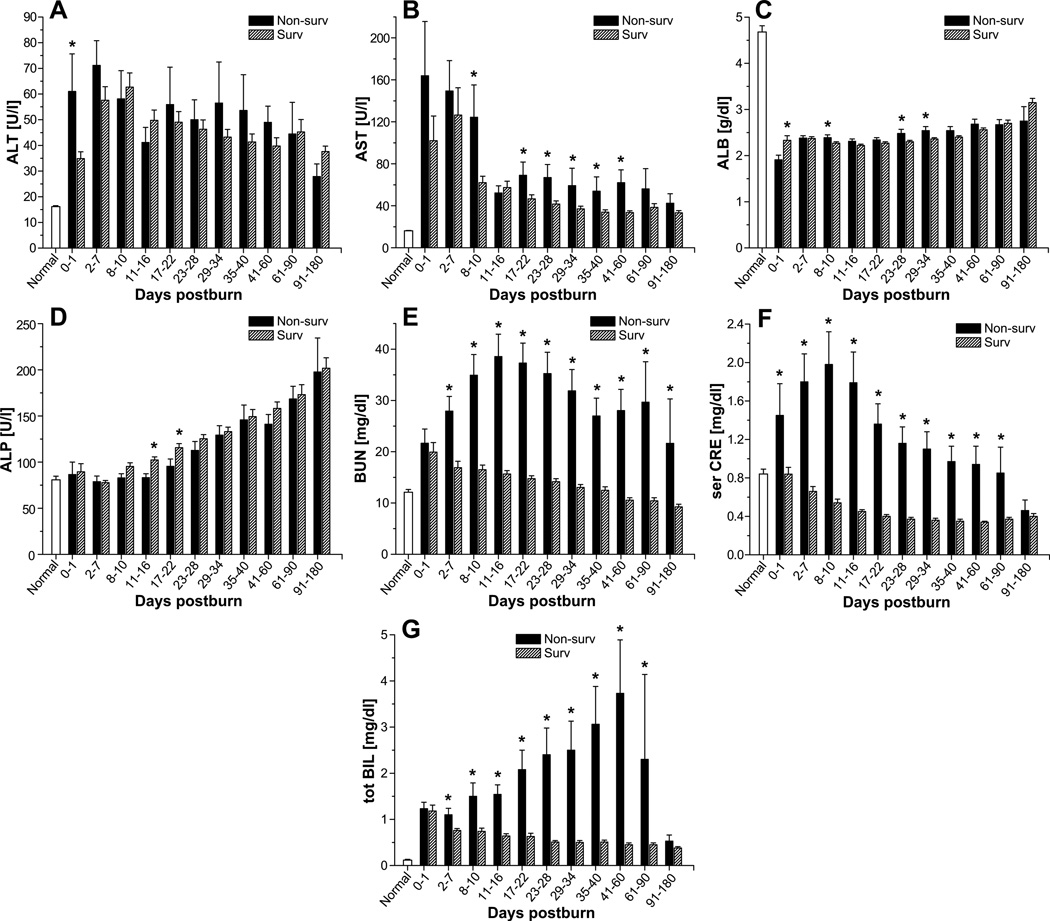
Alanine aminotransferase concentrations revealed were almost 2-fold higher in non-survivors than in survivors at the initial time point (0–1 day postburn) (p<0.05) (Figure 5A). A similar increase in aspartate aminotransferase (AST) was noted in non-survivors at 8–10 days postburn (p<0.05). More moderate increases in AST were also present from 17–22 days to 41–60 days (p<0.05) (Figure 5B). Despite supplementation of albumin, we found that serum albumin levels were significantly lower in non-survivors than those seen in survivors at three time points in the 8- to 34-day period (p<0.05) (Figure 5C). Alkaline phosphatase levels were moderately lower in non-survivors 11–22 days after burn injury (p<0.05) (Figure 5D). Finally, blood urea nitrogen, creatinine, and total bilirubin levels were considerably higher by 2- to 7-fold in non-survivors than in survivors (p<0.05) (Figure 5E–G). These increased levels were present at almost all time points examined.
Fig. 5.
Common markers of organ function in survivors and non-survivors. Serum levels of alanine aminotransferase (A), aspartate aminotransferase (B), albumin (C), alkaline phosphatase (D), blood urea nitrogen (E), creatinine (F), and total bilirubin (G). Data are expressed as the mean ± SEM. *p<0·05 for survivors vs. non-survivors.
Serum hormones
Of the 11 serum hormones measured, 7 differed between non-survivors and survivors (Figure 8). Of these, only parathyroid hormone was found to be lower in non-survivors than in survivors (p<0.05) (Figure 8). As already mentioned, insulin was elevated in non-survivors relative to survivors. Other hormones that were elevated included insulin-like growth factor binding protein-3, human growth hormone, osteocalcin, and estrogen (p<0.05 vs. survivors). These increases occurred within 34 days postburn.
Fig.8.
Comparison of serum profiles for cytokines, hormones, and other factors in survivors and non-survivors.
Hypermetabolism and cardiac function
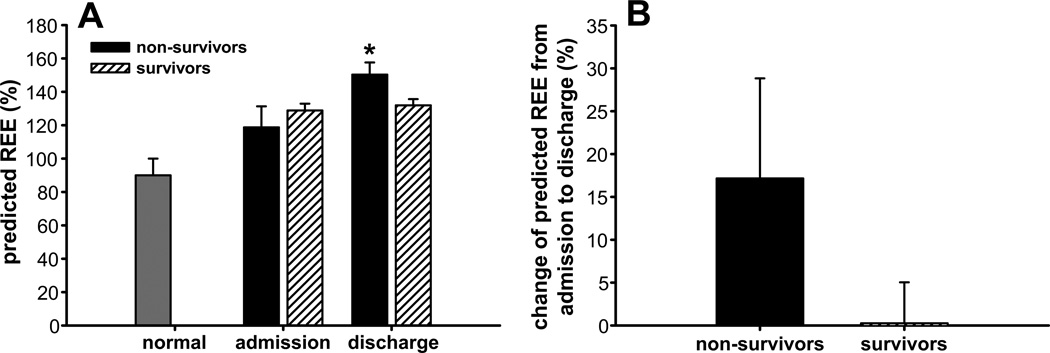
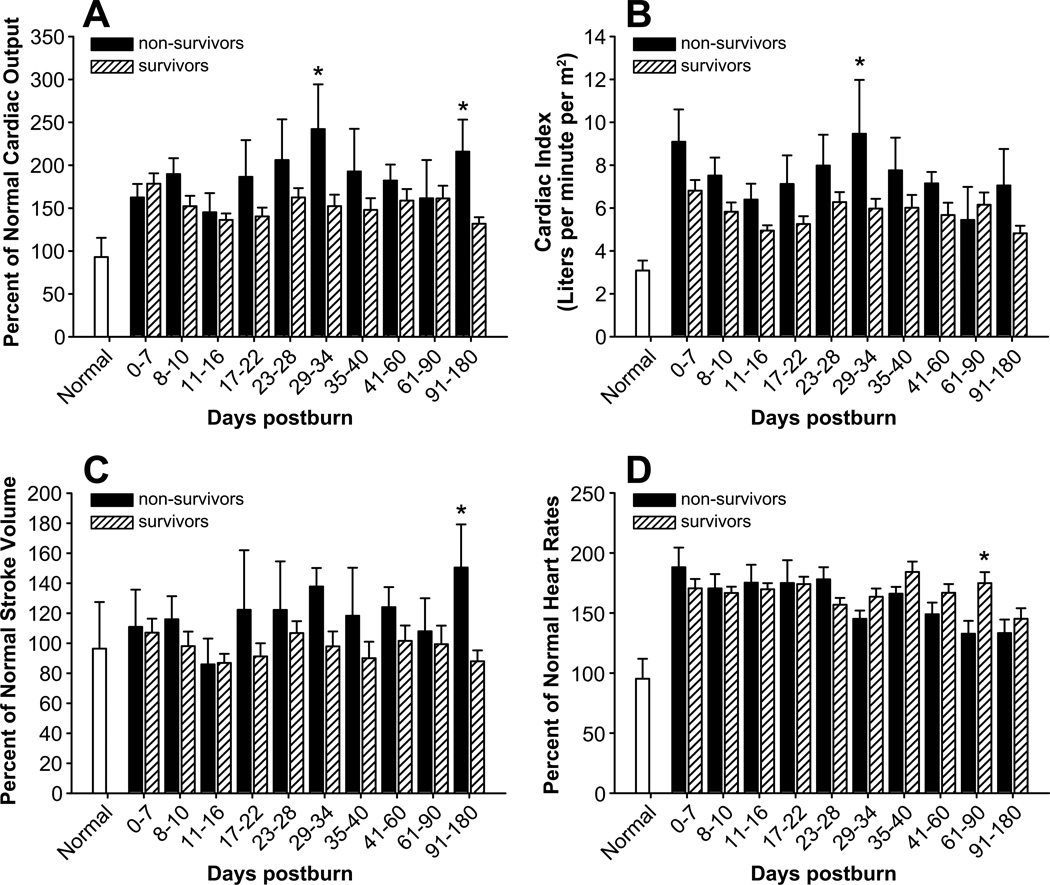
As expected, burn patients exhibited hypermetabolism, as seen by an increase in the predicted REE at admission and an even greater increase at discharge.16, 17 Analysis of the differences between non-survivors and survivors revealed that predicted REE was approximately 10% greater in the former group at discharge (p<0.05) (Figure 6). Since burn-induced hypermetabolism is accompanied by impaired cardiac function, we also compared cardiac function between non-survivors and survivors. We found that non-survivors had a ~40% higher CO at 29–34 days and 91–180 days (p<0.05) (Figure 7A), a ~30% higher CI at 29–34 days (p<0.05) (Figure 7B), and a ~40% higher SV at 91–180 days (p<0.05) (Figure 7C). In contrast, non-survivors had a lower heart rate than survivors at 61–90 days postburn (p<0.05) (Figure 7D).
Fig. 6.
Hypermetabolism in survivors and non-survivors. Predicted REE (A) and change in REE from admission to discharge (B). Data are expressed as the mean ± SEM. *p<0.05 for survivors vs. non-survivors.
Fig.7.
Cardiac function in survivors and non-survivors. Cardiac output (A), cardiac index (B), stroke volume (C), and heart rate (D). Data are expressed as the mean ± SEM. *p<0·05 for survivors vs. non-survivors.
DISCUSSION
Advances in therapeutic strategies, based on improved understanding of resuscitation, enhanced wound coverage, more appropriate infection control, improved treatment of inhalation injury, standardized critical care, and better support of the hypermetabolic response to injury have improved the clinical outcome of severely burned patients in recent years.1–3 However, severe burns remain a devastating injury affecting nearly every organ system and leading to significant morbidity and mortality. In order to obtain information about the patient’s survivability and subsequent personalization of the patients care, we aimed to determine whether we can identify trajectories in patients who survived a burn injury and compare these trajectories to patients who did not survive a similar size burn injury. We found that patients who succumbed to the injury had in fact profound differences in inflammatory, acute phase, and metabolic responses.
Cytokines as part of the inflammatory response are considered to be particularly important mediators of the pathophysiological process postburn, since severe burn trauma is known to induce a distinct systemic inflammatory reaction in patients.14 The postburn release of pro-inflammatory mediators is associated with the induction of the hypermetabolic response as well as with protein wasting and organ dysfunction,4, 7 contributing to increased incidences of infection and sepsis, factors that augment the risk of multiple organ failure and death.14 Early markers of burn-induced inflammation include IL-1β, IL-6, IL-8, IL-10, and TNF-α. In severely burned patients, IL-1 and IL-8 peak at the time of patient’s admission to the hospital and therefore represent key markers to distinguish between survivors and non-survivors.
IL-1 is a critical component of the inflammatory mediator cascade, regulating the host response to infection, injury and inflammation.18 IL-1 is especially critical for the maintenance of a persistent inflammatory state in the lungs of patients with acute respiratory distress syndrome.19 Similarly to IL-8, IL-6 plays a pivotal role in mediating the acute phase response. However, prolonged and excessive elevations of circulating IL-6 and IL-8 levels in patients after trauma, severe burn, and elective surgery have been highly associated with complications and mortality. In our study, we found dramatic changes in serum IL-6, IL-8, G-CSF and MCP-1 in the non-survivor group. While IL-6 and IL-8 have been extensively studied and have been correlated with total burn surface area, severity of skin burn injury and survival, G-CSF and MCP-1 have been less discussed in this context. MCP-1 is a member of the β-chemokines and plays a crucial role in the trafficking and recruitment of effector leukocytes to primary sites of immune responses and inflammation.20, 21 Recent reports demonstrate that MCP-1 induces insulin resistance in adipocytes and skeletal muscle cells.22 Inflammatory cytokines such as TNF, IL-6 and MCP-1 have been also shown to inhibit insulin action through modification of signaling properties of insulin receptor substrates, contributing to liver and skeletal muscle insulin resistance23, 24 as well as hypermetabolism. In fact, we found that non-survivors have persistently higher metabolic rates compared to survivors indicating the importance of the hypermetabolic response and justifying perturbations to decrease postburn hypermetabolism.
Beside the inflammatory response as a contributor to postburn morbidity and mortality is the acute phase response, with the production of acute phase proteins and factors. In the present study, we found various significant differences between the acute phase trajectories in survivors compared to non-survivors but it appears that these differences are later during hospitalization and not early on, decreasing the value of acute phase protein as predictors of mortality. One of the few interesting biomarkers was serum triglycerides. It seems that triglycerides are significantly elevated in non-survivors during the early phase postburn and hence representing a potential effective biomarker confirming a previous study.25
Insulin resistance and hyperglycemia have been associated with poor outcome postburn8, 26–28 and we have recently shown in a RCT in severely burned children that tight glucose control improves postburn outcomes.9 It is not entirely clear by which mechanisms insulin resistance and hyperglycemia cause worsened outcomes, but it appears that both cause protein glycolysation, increase free radicals, impair wound healing, increase skin graft loss, increase muscle protein catabolism, increase incidence of infections and mortality.8, 9, 26, 29 In the present study, we showed that non-survivors have significantly elevated glucose levels as well as insulin levels, indicating significantly increased insulin resistance. Increased insulin resistance was present from the initial phase postburn, and hence can be used as a predictor. However, insulin resistance could be also a marker of augmented and increased hypermetabolism due to an increased illness. We hypothesize that hyperglycemia is associated with poor outcomes and we therefore suggest glucose titration to a beneficial serum glucose target of 130 mg/dl.30
Our previous studies demonstrated that the hormonal, inflammatory, and metabolic profiles vary based on concomitant conditions such as presence of inhalation injury or sepsis.4, 12, 31–35 This study addresses the greater question of what changes occur in non-surviving patients regardless of the cause of death or existence of concurrent injuries (such as inhalation injuries). Further studies within our group have evaluated the use of the biomarkers described here to predict patient outcome. We investigated the effect of combining proteomics variables with clinical covariates on prediction of mortality in burned children. Serum samples were collected from 330 burned children (burns covering >25% of the TBSA) between admission and the time of the first operation for clinical chemistry analyses and proteomic assays of cytokines. Principal component analysis revealed that serum protein abundance and the clinical covariates each provided independent information regarding patient survival. To determine whether combining proteomics with clinical variables improves prediction of patient mortality, we used multivariate adaptive regression splines, because the relationships between analytes and mortality were not linear. Combining these factors increased overall outcome prediction accuracy from 52% to 81% and area under the receiver operating characteristic curve from 0.82 to 0.95. Thus, the predictive accuracy of burns mortality is substantially improved by combining protein abundance information with clinical covariates in a multivariate adaptive regression splines classifier. Despite it weakness of a single time-point model, this study indicates the importance and feasibility to construct models to predict burn outcomes (Finnerty, unpublished data).10
The temporal alterations in concentrations of inflammatory, hormonal, and acute phase response proteins that occur in non-survivors demonstrate the persistence of the immune dysfunction, loss of insulin sensitivity, and hepatic impairment that occur following a severe burn injury. Furthermore, the differences in survivors compared to non-survivors appear to be in the extent and duration of the response. Despite apparent decreases in analyte concentrations in surviving patients, these values are still significantly elevated above concentrations in non-burned patients; the same is true for apparent increases in these biomarkers. That the inflammatory and metabolic responses are magnified is a theme that we also see repeated in alterations within the genomic expression profiles of peripheral blood leukocytes (unpublished observations). Although we can only speculate with respect to the mechanistic implications of the alterations or the extreme nature of the responses in non-survivors, the utility of these analytes as biomarkers for survival is clear. We have identified, for the first time, specific temporally expressed markers that can be used to identify patients with a high likelihood of non-survival at discrete time points. This knowledge can be used to monitor patient progress and to identify, in a prospective manner, patients who may need additional interventions to improve their chances of survival. It is now desirable to confirm these trajectories prospectively in a new population of burn patients as well as to determine whether adults and elderly have also trajectories that differentiate survivors from non-survivors.
ACKNOWLEDGMENTS
We would like to thank the following research staff for their help and assistance: Deb Benjamin, Wes Benjamin, Joanna Huddleston, Lucy Robles, Sylvia Ojeda, Rosa Chapa, Guadalupe Jecker, Mary Kelly, Karen Henderson, Maria Magno, Liz Montemayor, Kristin Rojas, Victor Baras, and Maricela Pantoja. A very special thanks to Eileen Figueroa, Steven Schuenke, and Kasie Cole-Edwards for their assistance in manuscript preparation.
Source of Funding: This study was supported by grants from Shriners Hospitals for Children (71008, 8760, 8740, 8507 and 79135), National Institutes of Health (R01 GM56687, R01 GM087285, T32 GM008256, P50 GM60338, H133 A070026, CIHR 123336), CFI Leader’s Opportunity Fund: Project (25407), and Physicians’ Services Incorporated Foundation - Health Research Grant Program. CCF is an Institute for Translational Sciences Career Development Scholar supported, in part, by NIH (KL2RR029875 and UL1RR029876).
Footnotes
Publisher's Disclaimer: This is a PDF file of an unedited manuscript that has been accepted for publication. As a service to our customers we are providing this early version of the manuscript. The manuscript will undergo copyediting, typesetting, and review of the resulting proof before it is published in its final citable form. Please note that during the production process errors may be discovered which could affect the content, and all legal disclaimers that apply to the journal pertain.
Conflicts of Interest: The authors declare no conflicts of interest.
AUTHOR CONTRIBUTIONS
MGJ did patient care, collected the data, developed study design, and wrote the manuscript. DNH did patient care, developed the study design, collected data, and edited the manuscript. CCF collected data, statistical analysis, and edited manuscript. RK did the statistical analysis and edited manuscript. RPM collected and edited manuscript. GGG did the study design, collected data, statistical analysis, and wrote the manuscript.
REFERENCES
- 1.Herndon DN, Tompkins RG. Support of the metabolic response to burn injury. Lancet. 2004;363:1895–1902. doi: 10.1016/S0140-6736(04)16360-5. [DOI] [PubMed] [Google Scholar]
- 2.Kraft R, Herndon DN, Al-Mousawi AM, et al. Burn size and survival probability in paediatric patients in modern burn care: a prospective observational cohort study. Lancet. 2012;379:1013–1021. doi: 10.1016/S0140-6736(11)61345-7. [DOI] [PMC free article] [PubMed] [Google Scholar]
- 3.Williams FN, Herndon DN, Hawkins HK, et al. The leading causes of death after burn injury in a single pediatric burn center. Crit Care. 2009;13:R183. doi: 10.1186/cc8170. [DOI] [PMC free article] [PubMed] [Google Scholar]
- 4.Jeschke MG, Chinkes DL, Finnerty CC, et al. Pathophysiologic response to severe burn injury. Ann Surg. 2008;248:387–401. doi: 10.1097/SLA.0b013e3181856241. [DOI] [PMC free article] [PubMed] [Google Scholar]
- 5.Reiss E, Pearson E, Artz CP. The metabolic response to burns. J Clin Invest. 1956;35:62–77. doi: 10.1172/JCI103253. [DOI] [PMC free article] [PubMed] [Google Scholar]
- 6.Gauglitz GG, Herndon DN, Kulp GA, et al. Abnormal insulin sensitivity persists up to three years in pediatric patients post-burn. J Clin Endocrinol Metab. 2009;94:1656–1664. doi: 10.1210/jc.2008-1947. [DOI] [PMC free article] [PubMed] [Google Scholar]
- 7.Jeschke MG, Gauglitz GG, Kulp GA, et al. Long-term persistance of the pathophysiologic response to severe burn injury. PLoS One. 2011;6:e21245. doi: 10.1371/journal.pone.0021245. [DOI] [PMC free article] [PubMed] [Google Scholar]
- 8.Gore DC, Chinkes D, Heggers J, et al. Association of hyperglycemia with increased mortality after severe burn injury. J Trauma. 2001;51:540–544. doi: 10.1097/00005373-200109000-00021. [DOI] [PubMed] [Google Scholar]
- 9.Jeschke MG, Kulp GA, Kraft R, et al. Intensive insulin therapy in severely burned pediatric patients: a prospective randomized trial. Am J Respir Crit Care Med. 2010;182:351–359. doi: 10.1164/rccm.201002-0190OC. [DOI] [PMC free article] [PubMed] [Google Scholar]
- 10.Finnerty CC, Ju H, Spratt H, et al. Proteomics improves the prediction of burns mortality: results from regression spline modeling. Clin Transl Sci. 2012;5:243–249. doi: 10.1111/j.1752-8062.2012.00412.x. [DOI] [PMC free article] [PubMed] [Google Scholar]
- 11.Finnerty CC, Herndon DN, Jeschke MG. Inhalation injury in severely burned children does not augment the systemic inflammatory response. Crit Care. 2007;11:R22. doi: 10.1186/cc5698. [DOI] [PMC free article] [PubMed] [Google Scholar]
- 12.Gauglitz GG, Finnerty CC, Herndon DN, et al. Are serum cytokines early predictors for the outcome of burn patients with inhalation injuries who do not survive? Crit Care. 2008;12:R81. doi: 10.1186/cc6932. [DOI] [PMC free article] [PubMed] [Google Scholar]
- 13.Greenhalgh DG, Saffle JR, Holmes JHt, et al. American Burn Association consensus conference to define sepsis and infection in burns. J Burn Care Res. 2007;28:776–790. doi: 10.1097/BCR.0b013e3181599bc9. [DOI] [PubMed] [Google Scholar]
- 14.Finnerty CC, Herndon DN, Przkora R, et al. Cytokine expression profile over time in severely burned pediatric patients. Shock. 2006;26:13–19. doi: 10.1097/01.shk.0000223120.26394.7d. [DOI] [PubMed] [Google Scholar]
- 15.Mlcak RP, Jeschke MG, Barrow RE, Herndon DN. The influence of age and gender on resting energy expenditure in severely burned children. Ann Surg. 2006;244:121–130. doi: 10.1097/01.sla.0000217678.78472.d3. [DOI] [PMC free article] [PubMed] [Google Scholar]
- 16.Jeschke MG, Mlcak RP, Finnerty CC, et al. Burn size determines the inflammatory and hypermetabolic response. Crit Care. 2007;11:R90. doi: 10.1186/cc6102. [DOI] [PMC free article] [PubMed] [Google Scholar]
- 17.Williams FN, Herndon DN, Suman OE, et al. Changes in cardiac physiology after severe burn injury. J Burn Care Res. 2011;32:269–274. doi: 10.1097/BCR.0b013e31820aafcf. [DOI] [PMC free article] [PubMed] [Google Scholar]
- 18.Kaplan E, Dinarello CA, Gelfand JA. Interleukin-1 and the response to injury. Immunol Res. 1989;8:118–129. doi: 10.1007/BF02919074. [DOI] [PubMed] [Google Scholar]
- 19.Goodman RB, Pugin J, Lee JS, Matthay MA. Cytokine-mediated inflammation in acute lung injury. Cytokine Growth Factor Rev. 2003;14:523–535. doi: 10.1016/s1359-6101(03)00059-5. [DOI] [PubMed] [Google Scholar]
- 20.Furukawa K, Kobayashi M, Herndon DN, et al. Appearance of monocyte chemoattractant protein 1 (MCP-1) early after thermal injury: role in the subsequent development of burnassociated type 2 T-cell responses. Ann Surg. 2002;236:112–119. doi: 10.1097/00000658-200207000-00017. [DOI] [PMC free article] [PubMed] [Google Scholar]
- 21.Luster AD. Chemokines--chemotactic cytokines that mediate inflammation. N Engl J Med. 1998;338:436–445. doi: 10.1056/NEJM199802123380706. [DOI] [PubMed] [Google Scholar]
- 22.Sell H, Eckel J. Monocyte chemotactic protein-1 and its role in insulin resistance. Curr Opin Lipidol. 2007;18:258–262. doi: 10.1097/MOL.0b013e3281338546. [DOI] [PubMed] [Google Scholar]
- 23.del Aguila LF, Claffey KP, Kirwan JP. TNF-alpha impairs insulin signaling and insulin stimulation of glucose uptake in C2C12 muscle cells. Am J Physiol. 1999;276:E849–E855. doi: 10.1152/ajpendo.1999.276.5.E849. [DOI] [PubMed] [Google Scholar]
- 24.Fan J, Li YH, Wojnar MM, Lang CH. Endotoxin-induced alterations in insulin-stimulated phosphorylation of insulin receptor, IRS-1, and MAP kinase in skeletal muscle. Shock. 1996;6:164–170. [PubMed] [Google Scholar]
- 25.Kamolz LP, Andel H, Mittlbock M, et al. Serum cholesterol and triglycerides: potential role in mortality prediction. Burns. 2003;29:810–815. doi: 10.1016/s0305-4179(03)00196-7. [DOI] [PubMed] [Google Scholar]
- 26.Gore DC, Chinkes DL, Hart DW, et al. Hyperglycemia exacerbates muscle protein catabolism in burn-injured patients. Crit Care Med. 2002;30:2438–2442. doi: 10.1097/00003246-200211000-00006. [DOI] [PubMed] [Google Scholar]
- 27.Hemmila MR, Taddonio MA, Arbabi S, et al. Intensive insulin therapy is associated with reduced infectious complications in burn patients. Surgery. 2008;144:629–635. doi: 10.1016/j.surg.2008.07.001. discussion 635–637. [DOI] [PMC free article] [PubMed] [Google Scholar]
- 28.Pham TN, Warren AJ, Phan HH, et al. Impact of tight glycemic control in severely burned children. J Trauma. 2005;59:1148–1154. doi: 10.1097/01.ta.0000188933.16637.68. [DOI] [PubMed] [Google Scholar]
- 29.Jeschke MG, Klein D, Herndon DN. Insulin treatment improves the systemic inflammatory reaction to severe trauma. Ann Surg. 2004;239:553–560. doi: 10.1097/01.sla.0000118569.10289.ad. [DOI] [PMC free article] [PubMed] [Google Scholar]
- 30.Jeschke MG, Kraft R, Emdad F, et al. Glucose control in severely thermally injured pediatric patients: what glucose range should be the target? Ann Surg. 2010;252:521–527. doi: 10.1097/SLA.0b013e3181f2774c. discussion 527–528. [DOI] [PMC free article] [PubMed] [Google Scholar]
- 31.Finnerty CC, Herndon DN, Chinkes DL, Jeschke MG. Serum cytokine differences in severely burned children with and without sepsis. Shock. 2007;27:4–9. doi: 10.1097/01.shk.0000235138.20775.36. [DOI] [PubMed] [Google Scholar]
- 32.Gauglitz GG, Toliver-Kinsky TE, Williams FN, et al. Insulin increases resistance to burn wound infection-associated sepsis. Crit Care Med. 2010;38:202–208. doi: 10.1097/CCM.0b013e3181b43236. [DOI] [PMC free article] [PubMed] [Google Scholar]
- 33.Hart DW, Wolf SE, Chinkes DL, et al. Determinants of skeletal muscle catabolism after severe burn. Ann Surg. 2000;232:455–465. doi: 10.1097/00000658-200010000-00001. [DOI] [PMC free article] [PubMed] [Google Scholar]
- 34.Hart DW, Wolf SE, Mlcak R, et al. Persistence of muscle catabolism after severe burn. Surgery. 2000;128:312–319. doi: 10.1067/msy.2000.108059. [DOI] [PubMed] [Google Scholar]
- 35.Jeschke MG, Micak RP, Finnerty CC, Herndon DN. Changes in liver function and size after a severe thermal injury. Shock. 2007;28:172–177. doi: 10.1097/shk.0b013e318047b9e2. [DOI] [PubMed] [Google Scholar]


