

Abstract
Objective
Cortical atrophy has been associated with late life depression (LLD) and recent findings suggest that reduced right hemisphere cortical thickness is associated with familial risk for major depressive disorder but cortical thickness abnormalities in LLD have not been explored. Further, cortical atrophy has been posited as a contributor to poor antidepressant treatment response in LLD but the impact of cortical thickness on psychotherapy response is unknown. This study was conducted to evaluate patterns of cortical thickness in LLD and in relation to psychotherapy treatment outcomes.
Methods
Participants included 22 individuals with LLD and 12 age matched comparison subjects. LLD participants completed 12 weeks of psychotherapy and treatment response was defined as a 50% reduction in depressive symptoms. All participants participated in Magnetic Resonance Imaging (MRI) of the brain and cortical mapping of grey matter tissue thickness was calculated.
Results
LLD individuals demonstrated thinner cortex than controls prominently in the right frontal, parietal, and temporal brain regions. Eleven participants (50%) exhibited positive psychotherapy response after 12 weeks of treatment. Psychotherapy non-responders demonstrated thinner cortex in bilateral posterior cingulate and parahippocampal cortices, left paracentral, precuneus, cuneus, and insular cortices, and the right medial orbito-frontal and lateral occipital cortices relative to treatment responders.
Conclusions
Our findings suggest more distributed right hemisphere cortical abnormalities in LLD than have been previously reported. Additionally, our findings suggest that reduced bilateral cortical thickness may be an important phenotypic marker of individuals at higher risk for poor response to psychotherapy.
INTRODUCTION
Recent studies suggest that up to 15% of adults over the age of 65 suffer from Major Depressive Disorder (1, 2). While the etiology of late life depression (LLD) can be a complex interaction of psychological, medical, disability, and psychosocial factors (3, 4), LLD has also been consistently associated with cortical atrophy in bilateral frontal brain regions, most commonly in the orbitofrontal cortex (5–9), and to a lesser extent in parietal and temporal regions (10, 11). These findings largely support neurobiological conceptualizations of depression as being heavily mediated by extended neural networks comprised of the orbitofrontal cortex, the medial prefrontal cortex, the cingulate, and anatomical connections with the temporal lobe, striatum, thalamus and brain stem (12). While most of these MRI studies focused on measuring brain volume loss, a more recent MRI study reported that children and young adults with a high risk for familial depression exhibited a prominent pattern of cortical thinning of the right hemisphere, involving the lateral aspects of the frontal, temporal, parietal and occipital lobes as well as the cingulate, medial orbitofrontal, and subgenual cortices (13). These findings, while not yet replicated or evaluated in LLD specifically, suggest that neuropathological changes in the cortical laminae of the right hemisphere may be an important contributor to depression in older adults.
An increased understanding of neuropathic features of LLD is particularly salient with regard to improving treatment outcomes in older adults. Both antidepressant medication treatments and psychotherapeutic interventions are commonly utilized to treat LLD and both have been shown to relatively effective (14, 15), however up to 55% of patients do not respond to either type of treatment (14, 16). Structural brain changes associated with LLD have been posited as a significant factor in these poor treatment outcomes and, to date, the impact of structural brain abnormalities on treatment outcomes has focused exclusively on antidepressant medication treatments. Most of these studies have evaluated the impact of cerebrovascular disease on medication outcomes, reporting poor response to antidepressant medications being associated with white matter lesion (WML) volumes in frontal-subcortical regions (17). More recently, however, atrophy in frontal lobes (18) and anterior and posterior cingulate cortex regions known to be affected by Alzheimer’s disease (19) have emerged as additional potential contributors to poor medication response in LLD.
Despite evidence suggesting that structural brain abnormalities may contribute to poor antidepressant response in older adults, very little is known about the impact of these abnormalities on psychotherapy response. Psychotherapeutic interventions are becoming increasingly recognized as an evidence based treatment for LLD (20–24) and these interventions are typically conceptualized as requiring a significant amount of cognitive processing in order to be effective. As such, psychotherapies have been modified to accommodate for cognitive impairments that are common in LLD (14, 22, 23). While these psychotherapies have been shown to be effective in the treatment of LLD, as with medication treatments, a significant portion of individuals receiving treatment do not respond to these interventions (14, 23). Given the cognitive demands of psychotherapy and known associations between cognitive deficits and cortical atrophy in older adults (25, 26), as well as the impact of cortical atrophy on antidepressant treatment response (18, 27), there is compelling evidence to suggest that cortical atrophy may have a deleterious impact on psychotherapy treatment outcomes. Further, given recent findings of prominent reductions in right hemisphere cortical thickness associated with familial risk of depression; indices of cortical thickness may be a particularly sensitive phenotypic marker of psychotherapy treatment response in older adults.
The purpose of this study is: 1) to evaluate patterns of cortical thickness in LLD relative to age matched non-depressed older adults, and 2) to evaluate patterns of cortical thickness differentiating individuals who respond to psychotherapeutic intervention in comparison to individuals who show no significant improvement in mood following treatment. Based on previous studies we hypothesize that when compared to control participants individuals with LLD will exhibit reduced cortical thickness primarily in the orbitofrontal region but also in temporal and parietal regions bilaterally, with a prominence of thinner cortex exhibited in the right hemisphere. We also hypothesize that individuals who do not respond to psychotherapy will exhibit thinner cortex in these regions relative to individuals who demonstrate a positive response to psychotherapy.
METHODS
Study design
This study is a cross sectional design of older adults participating in a psychotherapy outcome study. MRI scans for a subset of these patients were obtained during the 12 weeks of a manualized psychotherapy intervention. Individuals who participated in MRI evaluations did not differ from the larger LLD sample with respect to age, education, or depression severity. All participants provided informed consent to participate in the study and all study procedures were approved by a committee for human research institutional review board.
Participants
Participants included 22 individuals with late life depression (LLD) and 12 normal control participants (NC). For the LLD group, diagnosis of depression was made by licensed psychologists utilizing DSM-IV criteria (28) based on information obtained from the Structured Clinical Interview for DSM Disorders (SCID) (29). Additionally to be eligible for this study all depressed participants were required to have moderate or severe symptoms of depression, i.e. scores of >19 on the 24 item Hamilton Depression Rating Scale (HDRS) (30). All psychiatric diagnoses for participant eligibility were reviewed at a consensus conference comprised of psychologists, social workers, and a neuropsychologist. Participants were recruited through media advertisements and were financially compensated. LLD participants were excluded from participation in the study if they had a prior diagnosis of dementia, neurologic disorders, or had a MMSE score of <25 at the initial screening evaluation (n=2), did not meet criteria for major depressive disorder (n=52), were taking antidepressant medications (n=4), reported psychotic symptoms or had a past diagnosis of psychotic disorder or other Axis I disorder including OCD (n=8), had acute medical illness (n=1), had a history of significant head trauma (n=1), were not fluent in English (n=1), or if they had sensory limitations that precluded participation in neuropsychological testing (n=2). NC participants were depression free at the time of study participation (Geriatric Depression Scale<1) and had no documented history of depression or other psychiatric illness. NC participants were matched to LLD participants on the basis of age, education, handedness, and gender.
2.3 Psychotherapeutic Intervention
Problem Solving Therapy (Arean, Raue, and Julian; unpublished manual, 2003). Problem Solving Therapy (PST) is an evidence based intervention for the treatment of major depression. The intervention consists of 12 weekly 50 minute sessions which focus on learning and applying problem solving skills as a mechanism to improve mood status. The specific skills taught include: problem orientation and definition, goal setting, generating solutions, decision making, action planning, and outcome review. Two PhD-level clinical psychologists and two licensed social workers with at least five years of post-licensure experience served as therapists for this study. “Treatment response” was defined as 50% reduction in depression severity scores from baseline after 12 weeks of treatment (14). Of the 22 participants receiving treatment for depression, 100% completed 12 weeks of psychotherapy.
2.4 MRI Methods
Data Acquisition
All scans were performed on a 4 Tesla (Bruker/Siemens) MRI system with a birdcage transmit and 8 channel receive coil. The scans included T1-weighted (T1w) and T2-weighted (T2w) structural MRI data for cortical thickness measurements. T1w images were obtained with a 3D volumetric magnetization prepared rapid gradient echo (MPRAGE) sequence, TR/TE/TI = 2300/3/950 ms, timing; 7° flip angle; 1.0 × 1.0 × 1.0 mm3 resolution; 157 continuous sagittal slices; acquisition time of 5 min. T2w images were acquired with a variable flip angle turbo spin-echo sequence with TR/TE = 4000/30 ms and with the same resolution matrix and field of view of MPRAGE. In addition, FLAIR (fluid attenuated inversion recovery) images with timing TR/TE/TI = 5000/355/1900 ms were acquired to facilitate the evaluation of white matter signal hyperintensities (WMSH) and the brain-extraction step in postprocessing.
Structural MR Image Processing
The following key processing steps were performed on each brain image volume for estimations of cortical thickness. First, an expectation maximization segmentation (EMS) algorithm including correction for intensity inhomogeneity (31, 32) was applied to the T1w image with supplementary T2w image input, to separate skull, scalp, extracranial tissue, cerebellum, and brain stem (at the level of the diencephalon) from the rest of brain volume. The remaining brain volume was voxel-wise classified into fractions of cerebral white matter (WM), cortical gray matter (GM), and sulcal cerebrospinal fluid (CSF). The resulting probabilistic tissue density images were visually assessed for performance quality of skull-stripping, bias field correction, and segmentation. If needed, the tissue density images were further manually corrected for inaccurate skull-stripping and tissue probabilities were re-calculated. Based on the tissue density images, each individual’s cortical surface was extracted using a cortical reconstruction method using an implicit surface evolution (CRUISE) technique (33), which was shown to yield an accurate and topologically correct representation that lies at the geometric center of the cortical GM tissue (34). Each resulting cortical surface was represented as a triangle mesh comprising of approximately 300,000 mesh nodes. Typical results from the cortical surface reconstruction are shown in Figure 1.
Figure 1.
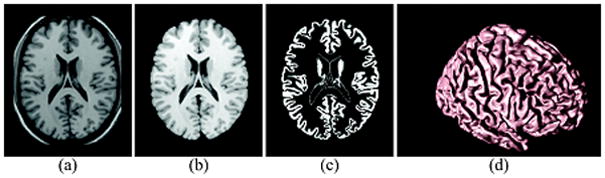
Geometric Modeling of Cerebral Cortex: Axial cross-section of (a) T1w MR image, (b) resulting cerebral volume, (c) resulting GM tissue segmentation, and (d) central cortical surface representation.
Cortical GM Thickness Estimate
Cortical thickness at each point in the cortical GM tissue mantle was defined as the sum of the distances from this point to the GM/WM and GM/CSF tissue boundaries following a flow field, which guarantees a one-to-one, symmetric, and continuous correspondence between the two tissue boundaries. A flow field with these properties was computed that followed the gradient of the solution of the Laplace’s equation with the cortical GM tissue mantle as its domain (34, 35). Cortical thickness was estimated in millimeters at 3-D image voxels on the GM tissue mantle. Estimated cortical thickness values were mapped onto the corresponding central cortical surface using trilinear interpolation at each mesh vertex. Cortical mapping of GM tissue thickness for a representative healthy elderly control is shown in Figure 2.
Figure 2.
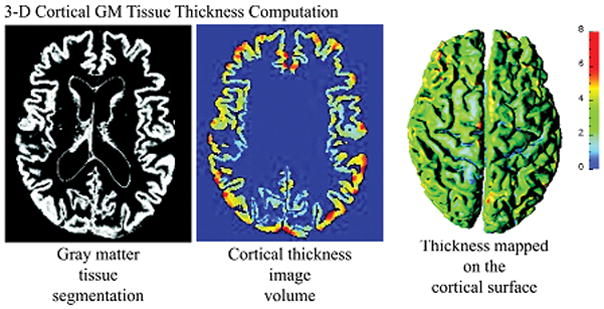
Measures of 3-D Cortical Morphometry: Computation steps for cortical thickness measure
Cortical Spatial Normalization
An image analysis technique known as cortical spatial normalization was used to match anatomically homologous cortical features across subjects before performing cross-subject comparisons. Specifically, the central cortical surface model of each subject was spatially normalized with respect to the geometry of a representative reference brain using an automated surface-based cortical warping method (36). The central cortical surfaces were automatically unfolded to a spherical shape using surface partial flattening and conformal mapping with a minimal area distortion constraint (37). The cortical thickness maps were filtered using a Gaussian smoothing kernel, where the contribution of each neighboring cortical thickness values to the center surface point was weighted by a Gaussian spatial kernel with a filter width of 10 mm FWHM in the reference brain surface. The size of the smoothing kernel matched the size of the effect we sought while accounting for residual errors in the cortical spatial normalization. Based on a published population simulation study that assessed the precision with which cortical thickness analysis could capture structural changes (38) and given the small sample sizes in our study, we expected to capture a 0.8 mm to 1.0 mm change in thickness at the significance level of 0.05 and the power at 0.95.
Data Analysis
To evaluate the clinical characteristics of the sample t-tests were conducted to compare LLD and NC groups on age, education, and MMSE scores. Chi-square analyses were conducted to evaluate the two groups with respect to gender and ethnicity. Subsequently, similar parametric and non-parametric analyses were conducted to compare demographic and characteristics of treatment response (responders vs non-responders). Next, we examined the differences in cortical thickness after removing variance associated with age and gender using pair-wise comparison of: (1) LLD and NC, and (2) LLD treatment responders and LLD non-responders. Cortical thickness was analyzed on a vertex-by-vertex basis, covering the entire cortical surface, by use of nested general linear models (GLMs) constructed with and without the group effect term and compared using maximum likelihood ratio (ML-ratio) tests. The resulting statistical maps were thresholded to control for multiple comparisons using the false discovery rate (FDR) with q = 0.05 (39). All statistical computations were carried out using the statistical package R (http://www.r-project.org/).
RESULTS
Seventeen participants (50%) were male; 82% were Caucasian, 6% were Asian, 6% were African American, 3% were Pacific Islanders, and 3% of were America Indians, and 100% of sample was right handed. The mean age of the sample was 72.2 years (sd = 7.8), the mean level of education was 15.9 years (sd= 2.4), and the mean MMSE score was 28.4 (sd= 1.7). LLD participants did not differ from control participants on the basis of age, MMSE, education, handedness, or gender.
The mean Hamilton Depression Rating Scale (HDRS) score for LLD participants at the time of intake was 22.9 (sd = 3.0). All participants received a MRI scan during the 12 weeks of treatment. At the 12 week assessment the mean HDRS score for the LLD group was 12.2 (sd = 5.9) and half of the sample (n=11) was designated as treatment responders. Following 12 weeks of psychotherapy, treatment responders had significantly lower HDRS scores than non-responders (means= 7.3 vs 17.1), t (1, 20) = 7.39, p < .01, but did not differ from non-responders on the demographic characteristics, timing of MRI scans, or severity of depression prior to treatment (Table 1).
Table 1.
Demographic and Clinical Characteristics of Treatment Responders and Non-Responders (n=22)
| Responders | Non-Responders | Statistical Test | p | |
|---|---|---|---|---|
| Age (years) | 73.5 (7.4) | 72.8 (sd 8.6) | t (1,50)= 0.92 | .36 |
| Education (years) | 16.1 (3.3) | 15.7 (2.1) | t (1,20)= −0.39 | .70 |
| Gender (male) | 6 (55%) | 5 (45%) | χ2 (1) =.182 | .70 |
| Ethnicity (Caucasian) | 9 (82%) | 5 (45%) | χ2 (1) = 1.63 | .20 |
| MMSE score | 27.2 (2.3) | 28.7 (1.1) | t (1,20)= 1.93 | .07 |
| Baseline HDRS score | 22.4 (3.3) | 22.4 (2.8) | t (1,20)= 0.37 | .71 |
| Week 12 HDRS score | 7.3 (3.1) | 17.2 (3.2) | t (1,20)= 7.39 | <.01 |
| Weeks of treatment at time of MRI | 9.7 (4.59) | 7.6 (5.5) | t (1,20)= −0.96 | .34 |
MMSE=Mini Mental State Exam; HDRS= Hamilton Depression Rating Scale; MRI= Magnetic Resonance Imaging
Compared to healthy elderly individuals, participants with LLD demonstrated thinner cortex in the right frontal, parietal, and temporal regions including caudal middle frontal, rostral middle frontal, supramarginal, inferior temporal, and medial superior frontal cortices, and in the left parietal and frontal regions including superior aspects of central sulcus, pars triangularis, and superior parietal cortices as shown in Figure 3. Compared to LLD participants who responded to the therapy, non-responders demonstrated thinner cortex in bilateral posterior cingulate and parahippocampal cortices, the left paracentral, precuneus, cuneus, and insular cortices, and the right medial orbito-frontal, lateral occipital, and superior aspects of post-central cortices as shown in Figure 4.
Figure 3.

Difference in Cortical Thickness between LLP Participants and Normal Controls (n=34)
Figure 4.
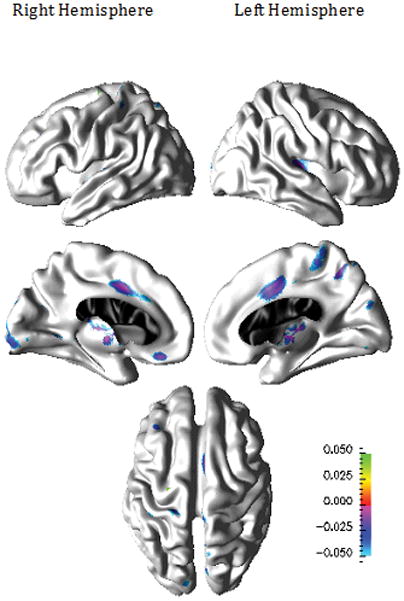
Patterns of Cortical Thinning for Psychotherapy Non-Responders compared to Psychotherapy Responders (n=22)
DISCUSSION
To our knowledge, our study is the first conducted to specifically evaluate patterns of regional variations in cortical thickness in LLD and also the first study to evaluate the patterns of regional cortical thickness in relation to psychotherapy response. Our study has 2 primary findings: 1) As hypothesized, LLD individuals demonstrated a prominent pattern of regional reduction in cortical thickness in frontal, parietal, and temporal regions, however these effects were seen almost exclusively in right hemisphere which was unexpected, and 2) As expected, individuals who did not respond to psychotherapy exhibited reduced cortical thickness relative to treatment responders. Each of these findings will be discussed below.
Our findings of a distributed pattern of regional reduction in cortical thickness in the frontal, temporal and parietal lobes for LLD participants is consistent with extended neural network models of depression (12) and with previous findings in depressed adults utilizing volumetric measures of cortical atrophy (40). The majority of previous studies evaluating cortical volume loss in LLD have reported isolated regions of atrophy in LLD cortex (5–9), which in aggregate support extended neural network models of LLD, however integrating this data across studies is difficult due to methodological differences. Our findings of distributed reduction in cortical thickness in LLD is therefore significant and also largely consistent with the one previous study which has documented more distributed cortical volume loss in LLD (10). However, the degree to which our findings were almost exclusively seen in the right hemisphere was unanticipated and further study is warranted to determine if these findings are due in part to increased sensitivity of measures of cortical thickness over volumetric approaches to identifying cortical alterations in LLD. In the previous study indicating a distributed pattern of cortical volume loss in LLD (10) laterality was not explored, so a direct comparison with our results is not possible. Nonetheless, our findings suggest that distributed reductions in cortical thickness may be a central morphometric abnormality associated with LLD and that cortical thinning in the right hemisphere may be particularly implicated.
To some extent our findings of prominent right hemisphere involvement in LLD appear consistent with a recent report documenting a 28% reduction in right hemisphere cortical thickness among children and young adults with high risk for familial depression (13). As we evaluated older adults with current depression, the prominence of a thinner cortex in the right hemisphere observed in our sample could be viewed as a casual factor for developing depression in late life, more so than either the consequence of neurodegenerative disease or the impact of chronic depression on the brain. However, in the study conducted by Petersen et al. (13), increased cortical thickness in the anterior and posterior cingulate, medial orbitofrontal, and subgenual cortices of the right hemisphere for individuals with high risk for familial depression was also reported, which is contrary to our own findings. Further, severity of current depressive symptoms in this previous study was associated primarily with a thinner cortex in the left hemisphere compatible with studies demonstrating higher incidence of depression among individuals with left prefrontal stroke (41), which was also largely inconsistent with our own findings. Therefore we would not interpret our findings to indicate that the cortical thickness markers of high risk for familial depression in children and young adults are the same primary cortical features of LLD.
Our findings that individuals who did not respond to psychotherapy treatment exhibited reductions in cortical thickness compared to treatment responders is of interest for several reasons. First, these findings offer the first direct evidence to suggest that neuropathic brain changes may be a significant factor in differential responses to psychotherapy in LLD. Delineating the impact of these neuropathic brain abnormalities on psychotherapy outcomes therefore has the potential to significantly improve treatment outcomes for LLD by identifying individuals who are at risk for poor psychotherapy outcomes, guiding treatment selection, and through the development of more effective interventions for these individuals. The degree to which measures of structural brain abnormalities could be utilized to guide treatment selection in LLD, i.e. medication treatment vs psychotherapy, is not yet clear given the limited previous studies with either treatment modality; however this is a significant potential avenue to improve depression outcomes in LLD. Further, given the presumed cognitive demands of psychotherapy, determining the degree to which cortical thinning may moderate psychotherapy response, or instead, mediates treatment response through associated cognitive impairment will be a significant avenue of future research. Lastly, while most existing studies have focused on the impact of cerebrovascular disease on LLD outcomes (17), our findings suggest that structural brain abnormalities commonly seen in Alzheimer’s disease (19), may also be implicated in poor psychotherapy outcomes in older adults.
While our study has several strengths, including a rigorous diagnostic approach to diagnosing Major Depressive Disorder, the use of a protocol based psychotherapy demonstrated to be effective for the treatment of LLD, and the use of measures of cortical thickness derived from MRI, there are several limitations to our study that should be discussed in relation to our findings. First, our sample size was small and it is possible that some participants in the LLD group for this study were in a preclinical phase of neurodegenerative disease which may have also contributed to our findings. Similarly, we did not utilize measures of medical comorbidity, age of depression onset, or chronicity of depression in our analyses and therefore we cannot comment on the degree to which these factors contributed to our findings. Further, our criterion for psychotherapy treatment response was based on mood status following 12 weeks of intervention and we cannot be certain that individuals participating in a longer course of psychotherapy treatment may not have shown significant improvement in mood status. Also, the MRI methods that we utilized did not allow for investigation of the role subcortical structures or white matter lesions to contribute to treatment response or patterns of cortical atrophy between the LLD and NC groups. Given previous studies demonstrating a relationship between WML and cortical atrophy in older adults (42), future investigations would benefit from utilizing multi-modal MRI analyses to identify structural brain abnormalities in LLD and the impact of these abnormalities on psychotherapy treatment response. Lastly and more technically, since the algorithm for spatially normalizing the brain surface maps did not enforce a left/right hemispheric symmetry, we cannot exclude the possibility of lateral bias in some of the findings of left-right variations.
Conclusions
Our findings suggest more diffuse right hemisphere cortical abnormalities in LLD than have been previously reported. While these results will need to be replicated, our findings represent the first study of regional reduction in cortical thickness in late life depression and suggest that neuropathological changes in the cortical laminae in the right hemisphere may be an important contributor to depression in older adults. Similarly, our findings of bilateral reduced cortical thickness abnormalities in older adults who do not respond to psychotherapy provide preliminary evidence that psychotherapy response is impacted by neuropathic brain changes.
Acknowledgments
The authors wish to acknowledge the contributions of Erin Gillung, Katie Flach, and Shiva Fekri for their roles in participant recruitment, data collection, and database management. We also would like to acknowledge Jeffery Kasten, Jamie Lutat, Jennifer Hlavin, and Joseph Brewer for their contributions to the MRI component of this study. Additionally, we thank Christa Hogan, Alexandra Elite-Marcandonatou and Maura McClane, therapists from the Over 60 Program, for their contributions to the treatment component of this study. The information in this manuscript and the manuscript itself are new and original and has never been published either electronically or in print.
Grant support: NIMH K08MH081065, NIMH K24MH074717, NIH P41RR023953, and the UCSF Leon J. Epstein Endowment.
Footnotes
There are no financial or other relationships that could be interpreted as a conflict of interest affecting this manuscript.
References
- 1.Hasin DS, Goodwin RD, Stinson FS, et al. Epidemiology of major depressive disorder: results from the National Epidemiologic Survey on Alcoholism and Related Conditions. Arch Gen Psychiatry. 2005;62:1097–1106. doi: 10.1001/archpsyc.62.10.1097. [DOI] [PubMed] [Google Scholar]
- 2.Anstey KJ, von Sanden C, Sargent-Cox K, et al. Prevalence and risk factors for depression in a longitudinal, population-based study including individuals in the community and residential care. Am J Geriatr Psychiatry. 2007;15:497–505. doi: 10.1097/JGP.0b013e31802e21d8. [DOI] [PubMed] [Google Scholar]
- 3.Sneed JR, Kasen S, Cohen P. Early-life risk factors for late-onset depression. Int J Geriatr Psychiatry. 2007;22:663–667. doi: 10.1002/gps.1727. [DOI] [PubMed] [Google Scholar]
- 4.Holley C, Murrell SA, Mast BT. Psychosocial and vascular risk factors for depression in the elderly. Am J Geriatr Psychiatry. 2006;14:84–90. doi: 10.1097/01.JGP.0000192504.48810.cb. [DOI] [PubMed] [Google Scholar]
- 5.Egger K, Schocke M, Weiss E, et al. Pattern of brain atrophy in elderly patients with depression revealed by voxel-based morphometry. Psychiatry Res. 2008;164:237–244. doi: 10.1016/j.pscychresns.2007.12.018. [DOI] [PubMed] [Google Scholar]
- 6.Taylor WD, Macfall JR, Payne ME, et al. Orbitofrontal cortex volume in late life depression: influence of hyperintense lesions and genetic polymorphisms. Psychol Med. 2007;37:1763–1773. doi: 10.1017/S0033291707000128. [DOI] [PubMed] [Google Scholar]
- 7.Lavretsky H, Roybal DJ, Ballmaier M, et al. Antidepressant exposure may protect against decrement in frontal gray matter volumes in geriatric depression. J Clin Psychiatry. 2005;66:964–967. doi: 10.4088/jcp.v66n0801. [DOI] [PubMed] [Google Scholar]
- 8.Lai T, Payne ME, Byrum CE, et al. Reduction of orbital frontal cortex volume in geriatric depression. Biol Psychiatry. 2000;48:971–975. doi: 10.1016/s0006-3223(00)01042-8. [DOI] [PubMed] [Google Scholar]
- 9.Ballmaier M, Sowell ER, Thompson PM, et al. Mapping brain sizeand cortical gray matter changes in elderly depression. Biol Psychiatry. 2004;55:382–389. doi: 10.1016/j.biopsych.2003.09.004. [DOI] [PubMed] [Google Scholar]
- 10.Andreescu C, Butters MA, Begley A, et al. Gray matter changes in late life depression--a structural MRI analysis. Neuropsychopharmacology. 2008;33:2566–2572. doi: 10.1038/sj.npp.1301655. [DOI] [PMC free article] [PubMed] [Google Scholar]
- 11.Smith GS, Kramer E, Ma Y, et al. The functional neuroanatomy of geriatric depression. Int J Geriatr Psychiatry. 2009;24:798–808. doi: 10.1002/gps.2185. [DOI] [PMC free article] [PubMed] [Google Scholar]
- 12.Drevets WC. Orbitofrontal cortex function and structure in depression. Ann N Y Acad Sci. 2007;1121:499–527. doi: 10.1196/annals.1401.029. [DOI] [PubMed] [Google Scholar]
- 13.Peterson BS, Warner V, Bansal R, et al. Cortical thinning in persons at increased familial risk for major depression. Proc Natl Acad Sci U S A. 2009 doi: 10.1073/pnas.0805311106. [DOI] [PMC free article] [PubMed] [Google Scholar]
- 14.Arean PA, Raue P, Mackin RS, et al. Problem-solving therapy and supportive therapy in older adults with major depression and executive dysfunction. Am J Psychiatry. 167:1391–1398. doi: 10.1176/appi.ajp.2010.09091327. [DOI] [PMC free article] [PubMed] [Google Scholar]
- 15.Evans SI. More disappointing treatment outcomes in late-life depression. Br J Psychiatry. 2000;177:281–282. doi: 10.1192/bjp.177.3.281-a. [DOI] [PubMed] [Google Scholar]
- 16.Nelson JC, Delucchi K, Schneider LS. Efficacy of second generation antidepressants in late-life depression: a meta-analysis of the evidence. Am J Geriatr Psychiatry. 2008;16:558–567. doi: 10.1097/JGP.0b013e3181693288. [DOI] [PubMed] [Google Scholar]
- 17.Gunning-Dixon FM, Walton M, Cheng J, et al. MRI signal hyperintensities and treatment remission of geriatric depression. J Affect Disord. 126:395–401. doi: 10.1016/j.jad.2010.04.004. [DOI] [PMC free article] [PubMed] [Google Scholar]
- 18.Almeida OP, Burton EJ, Ferrier N, et al. Depression with late onset is associated with right frontal lobe atrophy. Psychol Med. 2003;33:675–681. doi: 10.1017/s003329170300758x. [DOI] [PubMed] [Google Scholar]
- 19.Whitwell JL, Shiung MM, Przybelski SA, et al. MRI patterns of atrophy associated with progression to AD in amnestic mild cognitive impairment. Neurology. 2008;70:512–520. doi: 10.1212/01.wnl.0000280575.77437.a2. [DOI] [PMC free article] [PubMed] [Google Scholar]
- 20.Mackin RS, Arean P, Elite-Marcandonatou A. Problem solving therapy for the treatment of depression for a patient with Parkinson’s disease and mild cognitive impairment: a case study. Neuropsychiatr Dis Treat. 2006;2:375–379. doi: 10.2147/nedt.2006.2.3.375. [DOI] [PMC free article] [PubMed] [Google Scholar]
- 21.Arean P, Hegel M, Vannoy S, et al. Effectiveness of problem-solving therapy for older, primary care patients with depression: results from the IMPACT project. Gerontologist. 2008;48:311–323. doi: 10.1093/geront/48.3.311. [DOI] [PubMed] [Google Scholar]
- 22.Alexopoulos GS, Raue PJ, Kanellopoulos D, et al. Problem solving therapy for the depression-executive dysfunction syndrome of late life. Int J Geriatr Psychiatry. 2008;23:782–788. doi: 10.1002/gps.1988. [DOI] [PubMed] [Google Scholar]
- 23.Alexopoulos GS, Raue P, Arean P. Problem-solving therapy versus supportive therapy in geriatric major depression with executive dysfunction. Am J Geriatr Psychiatry. 2003;11:46–52. [PubMed] [Google Scholar]
- 24.Arean PA, Perri MG, Nezu AM, et al. Comparative effectiveness of social problem-solving therapy and reminiscence therapy as treatments for depression in older adults. J Consult Clin Psychol. 1993;61:1003–1010. doi: 10.1037//0022-006x.61.6.1003. [DOI] [PubMed] [Google Scholar]
- 25.Bell-McGinty S, Lopez OL, Meltzer CC, et al. Differential cortical atrophy in subgroups of mild cognitive impairment. Arch Neurol. 2005;62:1393–1397. doi: 10.1001/archneur.62.9.1393. [DOI] [PubMed] [Google Scholar]
- 26.Swartz RH, Stuss DT, Gao F, et al. Independent cognitive effects of atrophy and diffuse subcortical and thalamico-cortical cerebrovascular disease in dementia. Stroke. 2008;39:822–830. doi: 10.1161/STROKEAHA.107.491936. [DOI] [PubMed] [Google Scholar]
- 27.Mitchell AJ, Subramaniam H. Prognosis of depression in old age compared to middle age: a systematic review of comparative studies. Am J Psychiatry. 2005;162:1588–1601. doi: 10.1176/appi.ajp.162.9.1588. [DOI] [PubMed] [Google Scholar]
- 28.APA. Diagnostic and statistical manual of mental disorders. 4. Washington DC: American Psychiatric Association; 1994. [Google Scholar]
- 29.First M, Spitzer RL, Gibbon M, Williams J. Structured Clinical Interview for DSM-IV Axis I Disorders (SCID-I), Clinician Version. Arlington, VA: American Psychiatric Publishing; 1997. [Google Scholar]
- 30.Hamilton M. A rating scale for depression. J Neurol Neurosurg Psychiatry. 1960;23:56–62. doi: 10.1136/jnnp.23.1.56. [DOI] [PMC free article] [PubMed] [Google Scholar]
- 31.Van Leemput K, Maes F, Vandermeulen D, et al. Automated model-based tissue classification of MR images of the brain. IEEE Trans Med Imaging. 1999;18:897–908. doi: 10.1109/42.811270. [DOI] [PubMed] [Google Scholar]
- 32.Van Leemput K, Maes F, Vandermeulen D, et al. Automated model-based bias field correction of MR images of the brain. IEEE Trans Med Imaging. 1999;18:885–896. doi: 10.1109/42.811268. [DOI] [PubMed] [Google Scholar]
- 33.Han X, Pham DL, Tosun D, et al. CRUISE: cortical reconstruction using implicit surface evolution. Neuroimage. 2004;23:997–1012. doi: 10.1016/j.neuroimage.2004.06.043. [DOI] [PubMed] [Google Scholar]
- 34.Tosun D, Rettmann ME, Naiman DQ, et al. Cortical reconstruction using implicit surface evolution: accuracy and precision analysis. Neuroimage. 2006;29:838–852. doi: 10.1016/j.neuroimage.2005.08.061. [DOI] [PMC free article] [PubMed] [Google Scholar]
- 35.Yezzi AJ, Jr, Prince JL. An Eulerian PDE approach for computing tissue thickness. IEEE Trans Med Imaging. 2003;22:1332–1339. doi: 10.1109/TMI.2003.817775. [DOI] [PubMed] [Google Scholar]
- 36.Tosun D, Prince JL. A geometry-driven optical flow warping for spatial normalization of cortical surfaces. IEEE Trans Med Imaging. 2008;27:1739–1753. doi: 10.1109/TMI.2008.925080. [DOI] [PMC free article] [PubMed] [Google Scholar]
- 37.Tosun D, Rettmann ME, Prince JL. Mapping techniques for aligning sulci across multiple brains. Med Image Anal. 2004;8:295–309. doi: 10.1016/j.media.2004.06.020. [DOI] [PMC free article] [PubMed] [Google Scholar]
- 38.Lerch JP, Evans AC. Cortical thickness analysis examined through power analysis and a population simulation. Neuroimage. 2005;24:163–173. doi: 10.1016/j.neuroimage.2004.07.045. [DOI] [PubMed] [Google Scholar]
- 39.Benjamini Y. Controlling the False Discovery Rate: A practical and powerful approach to mulitiple testing. Journal of the Royal Statistical Society. 1995;57 (1):289–300. [Google Scholar]
- 40.Sheline YI. Neuroimaging studies of mood disorder effects on the brain. Biol Psychiatry. 2003;54:338–352. doi: 10.1016/s0006-3223(03)00347-0. [DOI] [PubMed] [Google Scholar]
- 41.Morris PL, Robinson RG, Raphael B, et al. Lesion location and poststroke depression. J Neuropsychiatry Clin Neurosci. 1996;8:399–403. doi: 10.1176/jnp.8.4.399. [DOI] [PubMed] [Google Scholar]
- 42.Godin O, Maillard P, Crivello F, et al. Association of white-matter lesions with brain atrophy markers: the three-city Dijon MRI study. Cerebrovasc Dis. 2009;28:177–184. doi: 10.1159/000226117. [DOI] [PubMed] [Google Scholar]