

Abstract
Purpose
Previous studies in phantoms and animals using animal MR systems have shown promising results in using oscillating gradient spin echo (OGSE) diffusion acquisition to depict microstructure information. The OGSE approach has also been shown to be a sensitive biomarker of tumor treatment response and white matter-related diseases. Translating these studies to a human MR scanner faces multiple challenges due to the much weaker gradient system. The goals of the current study are to optimize the OGSE acquisition for a human MR system and investigate its applicability in the in vivo human brain.
Methods
An analytical analysis of the OGSE modulation spectrum was provided. Based on this analysis and thorough simulation experiments, the OGSE acquisition was optimized in terms of diffusion waveform shape, waveform timing, and sequence timing – to achieve higher diffusion sensitivity and better sampling of the diffusion spectrum.
Results
The trapezoid-cosine waveform was found to be the optimal OGSE waveform. At the three employed peak encoding frequencies of 18 Hz, 44 Hz, and 63 Hz, the waveform polarity for the least blurry sampling of the diffusion spectrum was 90+/180−, 90+/180+, and 90+/180+, respectively. For the highest diffusion to noise ratio (DNR) at 63 Hz, the b-value was 200 s/mm2 and the echo time was 116 ms. Using the optimized sequence, a frequency dependence of the measured ADCs was observed in white-matter-dominant regions such as the corpus callosum.
Conclusion
The obtained results demonstrate, for the first time, the potential of utilizing an OGSE acquisition for investigating microstructure information on a human MR system.
Keywords: oscillating gradient, OGSE, restricted diffusion, gradient encoding spectrum, diffusion-to-noise ratio, 3 T human MR
INTRODUCTION
In the presence of cellular barriers, such as tissue membranes and intracellular organelles, water diffusion in biological tissue is restricted. The microstructural composition and the restrictions these barriers impose on diffusive motion lead to apparent diffusion coefficient (ADC) measurements that depend on the “shutter speed” (or formally the diffusion time) of the diffusion-probing technique (1,2). Traditionally, MR diffusion methods employ pulsed-gradient spin-echo (PGSE) encoding with a diffusion time on the order of 20–40 milliseconds (in human MR systems) to achieve high diffusion sensitivity. At these long diffusion times, the measured ADC reflects the effects of restricting boundaries at the 10 – 15 μm length scale. In other words, at these diffusion times the size-dependent ADC measurements are “saturated” for neuronal tissue and the effects of small cells or sub-cellular diffusion restriction cannot be observed.
Oscillating gradient spin echo (OGSE) encoding has been proposed as an alternative method to significantly reduce the diffusion time while maintaining reasonable diffusion sensitivity (3,4). However, the conventional q-space interpretation of the PGSE diffusion measurement is not suitable for the more complicated OGSE diffusion measurement (5). Instead the velocity autocorrelation function framework proposed by Stepisnik (6) can be used. As with any type of motion, restricted diffusion can be fully characterized by the velocity autocorrelation function, the Fourier transform of which is the diffusion spectrum. In the presence of barriers, molecules rebound and/or experience a reduction in velocity, yielding negative velocity autocorrelation (5). As a result, the corresponding diffusion spectrum has a deficit at a low frequency and increases toward a constant with increased frequency. It has been shown in simple geometries that this slope of change in the diffusion spectrum depends on the size of the restriction (7). Therefore, an OGSE acquisition combined with subsequent diffusion spectrum analysis (6) can reveal sub-cellular microstructural information of the tissue based on the dependence of the measured diffusion spectrum on the frequency of the employed OGSE waveform.
Several OGSE studies have been recently reported in phantoms (8–13) and in rodent brains (5,14). In a study on mice, a new tissue contrast was discovered in the maps of the rate of change in ADC with respect to diffusion gradient oscillation frequencies (14). The same study also demonstrated the high sensitivity of OGSE to microstructural changes associated with cuprizone-induced demyelinating lesions. In another study on rats, OGSE was shown to be a potentially earlier and more sensitive indicator of tumor treatment response than conventional PGSE (15).
The great potential of OGSE reported in previous phantom and animal studies urges its translation into human studies. The difficulty in applying OGSE in the in vivo human brain is related to the reduced gradient strength of a human MR system. Table 2 compares the specifications of the gradient hardware used in a typical animal MR system and a typical human MR system. With the same diffusion-encoding waveform, the limited maximum gradient strength of 50 mT/m achievable on a typical human system (compared to 1000 mT/m achievable on an animal system) significantly reduces the maximum b-value, maximum encoding frequency, and increases the echo time. As a result, the signal-to-noise ratio of the estimated ADC (or equivalently the diffusion-to-noise ratio, DNR) of an OGSE experiment in a human MR system drops significantly (12 times for the example given in Table 2) as compared to that in an animal MR system. Additionally, since the maximum OGSE frequency achieved at a certain b-value also drops significantly, the range of frequencies on the diffusion spectrum that is measurable using human MR systems is very limited. As a result, sensitivity to tissue microstructure of OGSE measurements deployed on human MR systems might be reduced (7).
Table 2.
Comparison between a typical animal MR system (14) and a typical human MR system.
| Animal MR (14) | Our human MR | |
|---|---|---|
| Field strength | 11.7 T | 3.0 T |
| Max gradient | 1000 mT/m | 50 mT/m |
| Max slew rate | N/A | 200 mT/m/ms |
| Achieved b-value (cosine) | 700 s/mm2 at 78 ×78 μm2 resolution TE = 40 ms f = 150 Hz |
129 s/mm2 at 2 × 2 mm2 resolution TE = 116 ms f = 62.5 Hz |
Another challenge in implementing OGSE is the finite duration of the diffusion encoding waveform. This challenge is common to both animal and human MR systems. Due to the finite duration of the waveform, the resulting diffusion gradient modulation spectrum has non-zero bandwidth (5). Therefore, the measured ADC no longer reflects the value of the diffusion spectrum at a single frequency. Rather, the measured ADC is the weighted sum of the diffusion spectrum over the non-zero bandwidth of the diffusion gradient modulation spectrum. Therefore, the larger the bandwidth of the diffusion gradient modulation spectrum, the more “blurred” the estimated diffusion spectrum.
The objective of the current study is to investigate the applicability of OGSE in detecting the frequency dependence of the measured ADC resulting from restricted diffusion in the in vivo human brain. To help surmount the gradient limitations of typical human MR systems, the OGSE diffusion waveform was optimized to exploit the full capacity of the available gradient system – with the aim to maximize the DNR, OGSE frequency, and the localization of the diffusion gradient modulation spectrum. The proposed waveform optimization is described in detail in the Theory section. First, an analytical description of the practical finite-length OGSE waveform was derived, which facilitated the choice of waveform timing and polarity for the optimal diffusion gradient modulation spectrum. Next, the waveform shape was modified to utilize the maximum slew rate and amplitude of the gradient system. Finally, sequence parameters (echo time, b-value) were optimized for DNR. Thorough simulation experiments were carried out to show the superiority of the optimized OGSE waveform over the previously employed OGSE waveforms. The obtained in vivo results are the first to show the frequency/time dependence of ADC using OGSE on a human MRI scanner, potentially revealing the new type of microstructural contrast previously achieved on animal MR systems (14).
THEORY
This section describes our derivation of the analytical formula of the diffusion gradient modulation spectrum (when the OGSE waveform has finite duration), and describes how the OGSE waveform can be optimized. For completeness, a brief overview of the basics of the spectral analysis of restricted diffusion is provided.
Unless otherwise specified, common terminologies used in the paper are given in Table 1.
Table 1.
List of definitions
| Terminology | Meaning |
|---|---|
| Encoding spectrum | Diffusion gradient modulation spectrum |
| Encoding frequency | Peak frequency of the encoding spectrum |
| Ripple | Maximum ratio between the amplitudes of side lobes and main lobe |
| Frequency localization | Ripple and the full-width-half-maximum (FWHM) of the main lobe of the encoding spectrum |
| Frequency selectivity | Frequency localization and peak frequency of the encoding spectrum |
| Waveform frequency of the trapezoid-cosine waveform | Frequency of its time-matched cosine waveform |
Background on Spectral Analysis of Restricted Diffusion
Under Stepisnik’s diffusion spectral analysis (6), diffusion attenuation is governed by the time-dependent characteristics of diffusion-encoding gradient waveforms and the diffusion spectrum defined by the underlying tissue composition. Specifically, the echo amplitude of a diffusion-weighting experiment follows (5,6,9,10)
| [1] |
where S and S0 are the echo amplitudes obtained with and without diffusion-encoding, D(ω) is the diffusion spectrum, and F(ω) is the Fourier transform of the spin phase accumulation (0th moment) due to the gradient waveform, g(t), given by:
| [2] |
Figure 1 shows diffusion-encoding gradient waveforms that were previously proposed for OGSE, their corresponding 0th moments and encoding spectrums |F(ω)|2. Diffusion-encoding using OGSE is affected by two important properties of the encoding spectrum: the peak frequency and the frequency localization. The peak frequency is the frequency at which |F(ω)|2 reaches its maximum. The frequency localization depends on both the full-width-half-maximum (FWHM) of the main lobe and the maximum ratio between the side lobes and main lobe amplitudes (ripple). The smaller the FWHM and ripple, the better the frequency localization.
Figure 1.

Commonly used diffusion encoding waveforms (1st columns), their corresponding 0th moments (2nd columns), and encoding spectrums (3rd columns) at two different frequencies/diffusion times ((a) and (b)). Abbreviations: PGSE, pulsed gradient spin-echo; OGSE, oscillating gradient spin-echo; -TS, trapezoid sine; -S, sine; -DS, double-sine; -C, cosine. PGSE, OGSE-TS, and OGSE-S have their fixed peak frequencies at 0 Hz while OGSE-DS and OGSE-C do not. Changing the waveform frequency/diffusion time (from (a) to (b)) changes the peak frequencies of the OGSE-DS and OGSE-C waveforms while leaving those of the PGSE, OGSE-TS, and OGSE-S waveforms unaffected. The last two rows show the dependence of the FWHM and ripples of |F(ω)|2 on the duration, not the number of periods, of the OGSE waveform.
It has been shown that PGSE, trapezoid-sine and sine waveforms have diffusion gradient modulation spectrum with fixed DC components (i.e. peak frequencies ω0 = 0) (7,10). Therefore, measuring the diffusion spectrum at an arbitrary frequency is nontrivial with these waveforms (5). On the other hand, double-sine and cosine waveforms have the peak frequency ω0 ≠ 0. Furthermore, this peak frequency is tunable by changing the frequencies of the oscillating gradient waveforms. Therefore, arbitrary frequencies of the diffusion spectrum can be probed for subsequent interpretation of tissue microstructure. Specifically, for infinitely long cosine- or double-sine-modulated waveforms at frequency ω0, we have (10,16)
| [3] |
where ∂(ω) is the Dirac’s delta function. In this case Eq. [1] can therefore be reduced to
| [4] |
where is the conventionally defined b-value (17). Probing the diffusion spectrum can then be done by simply sweeping through the frequencies of the diffusion waveform D(ω) and determining ADC values at these frequencies.
Optimization of Frequency Localization for a Truncated OGSE Waveform
Infinite OGSE encoding waveforms would require infinite echo times and are thus unrealistic in the experimental setting. To assess the effects of OGSE waveform truncation, a finite-duration OGSE waveform of practical use can be formulated by windowing the infinite waveform with two rectangular windows of width δ and separation Δ between their centers. Based on this observation, it can be shown that the encoding spectrum for a finite cosine OGSE waveform is (see Appendix)
| [5] |
H(ω) depends on the relative polarity of the OGSE waveforms on either side of the refocusing pulse. If the two waveforms have the same polarity, denoted as 90+/180+, H(ω) = sin(ω). On the other hand, if the two waveforms have opposite polarity, denoted as 90+/180−, H(ω) = cos(ω).
From Eq. [5], the truncation of the OGSE waveform blurs the ideal zero-FWHM, zero-ripple Dirac’s delta encoding spectrum of Eq. [3] into a finite FWHM, positive ripple encoding spectrum. In other words, the waveform truncation reduces the frequency-selective localization of the encoding spectrum. The FWHM and ripple of the encoding spectrum of the truncated waveform depend upon the duration of the waveform on each side of the refocusing pulse (δ) and the separation between the two sides (Δ). The FWHM of the main lobes and the ripple must be minimized for the blurred encoding spectrum to approximate the Dirac’s delta function of Eq. [3].
In the case where Δ ≈ δ and H(ω) = cos(ω) (90+/180− configuration), Eq. [5] reduces to (see Appendix)
| [6] |
The FWHM of the main lobes in this case can be computed numerically, yielding . The ripple is independent of δ and is 0.047. Therefore, to achieve better frequency localization (i.e. narrow-band |F(ω)|2 which is closer to the Dirac’s delta function) one should extend the duration of the OGSE waveform as long as permitted by T2-decay and ultimately by SNR.
In the case where Δ > δ, from Eq. [5], the best frequency localization for a given δ is achieved when the sinc function and reach their maxima at the same frequency. In other words, the best frequency localization occurs when ω = ω0 is a maximum of . Solving for the maxima of yields the requirement for the waveform separation Δ as follows
| [7] |
where k is a positive integer and is the period of the OGSE waveforms.
In practice, it is desirable to design a sequence with minimal dead time to maximize SNR. Therefore, Δ is often decided by imaging parameters such as diffusion gradient duration δ, slice selection, resolution, and readout trajectory. The only degree of freedom left to optimize the frequency localization is then the choice of H(ω), or equivalently the waveform polarity on the two sides of the refocusing pulse. Consequently, based on Eq. [5], the waveform polarity should be selected so that it yields a higher value for .
OGSE Waveform Optimization
As discussed previously, since cosine and double-sine waveforms have a tunable peak frequency, they typically have been the waveforms of choice in previous studies. However, when the maximum gradient amplitude is limited, such as in the case of a human MR system, a cosine waveform is superior to a double-sine waveform. The reason is that for a given peak encoding frequency and echo time, the maximum achievable b-value using a cosine waveform is times higher than the maximum achievable b-value using a double-sine waveform (where N is the total number of cosine periods or half the number of sine periods (5)).
A further improvement of the cosine waveform is possible in terms of increasing the maximum achievable b-value: when operating at the maximum slew rate and the maximum gradient amplitude, trapezoid lobes have at least times higher gradient-time integrals than sine/cosine lobes with the same duration, resulting in a higher b-value. Therefore, intuitively, the cosine waveform can be approximated by an oscillating time-matched trapezoid waveform – called “trapezoid-cosine” – to achieve an increased maximum b-value while ideally maintaining the encoding spectrum.
Optimization of diffusion-to-noise ratio (DNR)
The precision of an ADC measurement and, hence, the precision of a diffusion spectrum measurement is proportional to the signal-to-noise ratio (SNR) of the estimated ADC, which was defined previously as the diffusion-to-noise ratio (DNR) (18,19). The DNR of a diffusion measurement is (18,19)
| [8] |
where SNR0 is the SNR of the b = 0 image, b > 0 is the b-value used, D is the estimated ADC value, N0 and Nb are the number of b = 0 and b > 0 acquisitions, respectively. The limited maximum gradient amplitude makes the maximum achievable b-value dependent upon the employed echo time. Therefore, the b-value cannot be increased without considering the concomitant increase in echo time and consequent increase in T2-related signal loss. By extracting the effect of T2-decay from SNR0, Eq. [8] can be rewritten as
| [9] |
Assuming a target spatial resolution with a fixed readout trajectory, κD can be decoupled from and the optimum parameters (TE, b-value) of the sequence can be chosen to maximize DNR, or equivalently to maximize κD.
METHODS
Simulations
Simulation studies were performed to confirm the superiority of the trapezoid-cosine waveform over the cosine waveform and to show the dependence of the frequency localization on the OGSE waveform polarity. Without loss of generality, the dependence of frequency localization on the OGSE waveform polarity was investigated for the case where the frequency of the waveform is 62.5 Hz.
Simulations were also performed to find the acquisition parameters (TE, b-value) that would yield the optimal DNR using a wide range of T2 values that covers both gray and white matter at 3 T: T2 = 50 – 100 ms (20), and a wide range of diffusion coefficients that covers different level of diffusivity: D = 250 – 1500 × 10−6 mm2/s. In general, the higher the encoding frequency of the diffusion-encoding gradient waveform, the lower the maximum b-value that can be achieved for the same TE (i.e., lower DNR). Therefore, we chose to optimize our DNR at the highest encoding frequency that would be implemented, which is 63 Hz. The reason for this highest encoding frequency is that at diffusion-encoding frequency > 63 Hz, the resulting echo time is longer than 120 ms even for a b-value of only 100 s/mm2. The DNR simulation was performed with different echo times for double-sine, cosine, and trapezoid-cosine diffusion-encoding waveforms.
All simulations assumed gradient hardware limits: a maximum gradient amplitude of 50 mT/m and a maximum slew rate of 100 mT/m/ms. The sequence timing was calculated based on an in-plane resolution of 2 × 2 mm2; 3-interleaf EPI readout trajectory with partial Fourier encoding with 24 over scan lines; and a readout bandwidth of +/−125kHz.
In vivo Measurements
Four healthy volunteers were scanned on a 3T GE MR750 scanner (General Electric Healthcare, Waukesha, WI, USA) using an eight-channel head coil. Written informed consent was obtained from each volunteer. The maximum gradient strength is 50 mT/m. Although the maximum slew rate of the system is 200 mT/m/ms, a maximum slew rate of 100 mT/m/ms was used to avoid peripheral nerve stimulation.
Trapezoid-cosine OGSE waveforms were designed to replace the traditional PGSE waveform in a single-refocused spin-echo diffusion-weighted sequence. Trapezoid-cosine OGSE waveforms corresponding to three encoding frequencies (ω = 18 Hz, 44 Hz, and 63 Hz) were implemented. The b-value was kept constant at 200 s/mm2. To keep the b-value and TE constant for all OGSE experiments, an increasing number of periods of the waveform were used with increasing encoding frequency as follows: 2, 4, and 6 periods for encoding frequencies of 18Hz, 44 Hz, and 63 Hz, respectively. Notice that the total diffusion encoding duration δ on either side of the refocusing pulse is constant (48 ms) across encoding frequencies. For comparison, a PGSE DWI experiment with a diffusion time of 20 ms and a matched b-value was also carried out. Tetrahedral diffusion encoding was used to simultaneously exploit the maximum strength of the Gx, Gy, and Gz gradients and reduce the TE compared to standard diffusion gradient encoding where only the principal gradient direction is applied (21).
For all experiments, a 3-interleaf EPI trajectory was used. Parallel imaging with acceleration factor of three (22) was used to fill in the k-space gap of each interleaf. Other parameters are: TE/TR = 116/3000 ms, FOV= 240mm, acquisition matrix = 128 × 128, 2 mm2 resolution in-plane, 5 mm slice thickness with no slice gap, 8 sagittal slices, partial Fourier encoding with 24 over scan lines (i.e. half scan factor = 68.75%), and 15 repetitions of the diffusion scheme. For anatomical reference, a 15-direction b = 1000 s/mm2 DTI data set with one b = 0 image was acquired (TE/TR = 45/3000 ms) using a matched resolution, slice prescription, and readout trajectory.
FOV/2 EPI ghosting parameters were selected based on the best of the 15 fully-sampled b = 0 scans (as defined by the lowest grappa fit-error to the data (23)) through the use of an entropy-based method (24,25). After the ghost correction, each interleaf was reconstructed separately using GRAPPA (26,27). Non-acquired phase encoding lines (partial Fourier encoding) were reconstructed by projection onto convex sets (28,29). For all experiments, rigid-body registration of diffusion-weighted images to the b = 0 image was performed.
Estimation of ADC and Diffusion Spectrum
Given the assumption that Eq. [4] holds, the diffusion spectrum at the peak frequency, ω, of the OGSE encoding spectrum can be estimated using the following equation
| [10] |
where Sb(ω,TE) and S0(ω,TE) are the signals at the echo time TE with and without diffusion encoding being active. To minimize the effects of noise and possible additional partial volume due to further registration across different experiments (different encoding frequencies), the ADC frequency dependence analysis was done only on ROIs in white matter regions with known predominant uni-directional fibers, such as the genu and splenium of the corpus callosum.
RESULTS
Simulations
Superiority of trapezoid-cosine waveform
Figure 2(a, b) compares the cosine waveform with a matched trapezoid-cosine waveform at the encoding frequency of 63 Hz, showing the ability of the trapezoid-cosine waveform to exploit the maximum slew rate and thereby achieve a higher b-value for a given TE. As shown in Figure 2(c, d), the approximation of the cosine waveform by the trapezoid-cosine waveform does not noticeably change the diffusion-encoding gradient-induced phase accumulation and (more importantly) also does not alter the encoding spectrum.
Figure 2.

Comparison between cosine and trapezoid-cosine waveforms in terms of (a) the time-matched waveforms (b) corresponding slew rates, (c) 0th moments, and (d) encoding frequencies. The trapezoid-cosine waveform operates either at maximum gradient amplitude or maximum slew rate modes while the cosine waveform does not (a, b). Therefore, the resulting b-value is higher with the trapezoid-cosine than with the cosine waveform. The differences between the encoding spectrums of trapezoid-cosine and cosine waveforms are minimal (d).
OGSE waveform polarity and the resulting frequency selectivity
For the sequence timing of the simulation, the waveform separation time Δ was 55.7 ms. Thus, at the OGSE waveform frequency of 62.5 Hz, (90+/180+ configuration) while (90+/180− configuration). Therefore, the 90+/180+ configuration gives better frequency localization as is evident from Figure 3. We note that since does not reach its maximum value at ω = ω0, the peak frequency of the encoding spectrum (63 Hz) is slightly different from the waveform frequency (62.5 Hz). For the 90+/180− configuration, since at the peak frequency of the sinc functions ω = ±ω0 (Eq. [5]), the main lobes of the sinc functions are split into two half-magnitude lobes. This splitting leads to significant reduction in the frequency localization of the encoding spectrum (Figure 3).
Figure 3.

Dependence of frequency selectivity on the polarities of the OGSE waveform on the two sides of the refocusing pulse. At waveform oscillating frequency of ω0 = 62.5 Hz and waveform separation Δ = 55.7 ms, the 90+/180+ configuration resulted in better frequency localization than the 90+/180− configuration. The encoding spectrum of the 90+/180− configuration had two lobes with approximately equal amplitudes because two zeros of occurred at ω ≈ ±ω0 where the sinc functions reached their maxima (Eq. [5]).
The waveform polarity was varied for each of the different encoding spectra of the in vivo experiment to optimize frequency selectivity. Specifically, the best configurations found were 90+/180+ and 90+/180− for the 44 Hz and 18 Hz frequencies, respectively. Figure 4 shows the optimized encoding spectra of all of the employed waveforms (with that of a matched b-value PGSE sequence labeled as 0 Hz). The FWHM of the main lobes for all three OGSE waveforms was 8.5 Hz. The ratio between the maximum amplitudes of the side lobe and the main lobe was 0.15, 0.28, and 0.15 for the waveforms with encoding frequencies 18 Hz, 44 Hz, and 63 Hz, respectively.
Figure 4.

Encoding spectrums of the employed trapezoid-cosine waveforms. All trapezoid-cosine waveforms had FWHM = 8.5 Hz. Their maximum amplitude ratios between side lobes and main lobes were 0.15, 0.28, and 0.15 for the waveforms with encoding frequencies 18 Hz, 44 Hz, and 63 Hz, respectively. The employed PGSE waveform (at the diffusion time Δ = 20 ms), labeled as 0 Hz, had FWHM = 50 Hz.
DNR optimization
Figure 5 shows the variation of DNR with echo time for the double-sine, cosine, and trapezoid-cosine waveforms at T2 = 80 ms and D = 750 × 10−6 mm2/s. The DNR plots in Figure 5 were normalized by the DNR of a minimum-TE PGSE sequence with matched resolution but with a b-value = 1000 s/mm2. The observed “saw-tooth” shapes of the DNR curves arose because an increase in TE will lead to an increase in b-value only if the extra time is long enough to fit in a whole period of the employed diffusion-encoding gradient waveform. As predicted, the trapezoid-cosine waveform gave the highest DNR with the maximum value of approximately 1.5 times higher than that of the cosine waveform. The maximum DNR was achieved at TE = 116 ms which corresponded to a b-value of 200 s/mm2. However, even at this maximum value, the DNR of the OGSE experiment is only approximately 10% of the DNR of a conventional PGSE DWI experiment. Therefore, increasing (in Eq. [9]) through the use of signal averaging is needed to further improve the DNR and hence the quality of the estimated diffusion spectrum.
Figure 5.

Relative DNR with respect to echo times at T2 = 80 ms and D = 750 × 10−6 mm2/s. The plotted DNR curves were normalized to the DNR of a minimum-TE PGSE sequence with matched resolution but with b-value = 1000 mm2/s. The trapezoid-cosine waveform was superior to both double-sine and sine waveforms. The maximum DNR was achieved at TE = 116 ms for the trapezoid-cosine waveform.
The optimal TE in terms of DNR does not change when varying the measured diffusion coefficient D in the range 250 – 1500 × 10−6 mm2/s. For a T2 within the range of 50 – 76 ms, the optimal TE is 86 ms. When T2 is in the 76 – 100 ms range, the optimal TE is 116 ms. However, the difference between DNR values at TE = 86 ms and TE = 116 ms (with varying T2) does not exceed 20%.
In vivo Results
Figure 6 shows the estimated mean ADCs of one subject in the corpus callosum area, depicted by the red rectangle in the reference image. For anatomical reference, the fractional anisotropy (FA) map and color-coded FA map in this area are also shown. As the encoding frequency of the OGSE experiments increases, regions in the genu and splenium of the corpus callosum (red arrows) exhibit increased ADC as expected for restricted diffusion (5,7). To get a clearer observation of the trend, the mean and standard deviation within ROIs of the genu and splenium of the corpus callosum are plotted in Figure 7. A similar frequency dependence of the ADC was also observed in the three other subjects. The frequency dependence of the ADC of the OGSE experiment was also compared to the ADC of the PGSE experiment (denoted as 0 Hz frequency). Although the peak of the frequency-encoding spectrum of the PGSE encoding is at 0 Hz, its wide bandwidth (FWHM of 50 Hz) largely blurs the frequency selectivity of the measured ADC. The non-localized frequency selectivity of the PGSE experiment should partially explain the fact that the ADC of the PGSE is higher than that of the OGSE at the frequency of 18 Hz. It should be also emphasized that additional experiments performed on a water phantom (i.e. no diffusion restriction) found no dependencies on the encoding frequency chosen in the ADC maps (i.e. the ADC remained constant) (Figure 7a).
Figure 6.
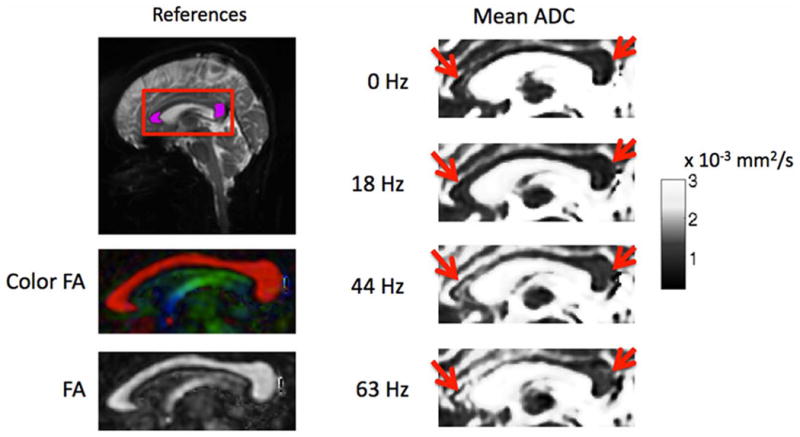
Measured mean ADC at different frequencies at the corpus callosum (depicted by the red rectangle on the first reference image). Reference FA map and color-coded FA map were estimated from a separate b = 1000 s/mm2 DTI acquisition with the resolution matched to that of OGSE experiments. Mean ADC labeled as 0 Hz is estimated from a PGSE acquisition with all parameters (including b-value and TE) matched to that of OGSE experiments. For OGSE experiments (18 Hz, 44 Hz, and 63 Hz), increase in ADC with increase in encoding frequency was observed in the genu and splenium of the corpus callosum as pointed out by the red arrows.
Figure 7.

Mean and standard deviation of measured ADC within ROIs (shown in magenta in the reference image in Figure 6) on four subjects in (a) genu (ROI of 60 voxels) of the corpus callosum, and (b) splenium (ROI of 70 voxels) of the corpus callosum. ADC measured in a water phantom was also shown for reference in (a). ADC at 0Hz was estimated from a PGSE experiment. In the genu and spenium of the corpus callosum, OGSE experiments showed dependence of ADC on the encoding frequency. In water phantom, no frequency dependence was observed. Due to its broad encoding spectrum, the PGSE experiment yields ADC with higher value than that of the OGSE experiment at 18 Hz.
DISCUSSION
Several human studies have attempted to investigate the dependence of measured ADC with diffusion times (4,30,31). Interestingly, regarding the ADC being time-dependent, the findings were positive in the study by Horsfield et al (30) and negative in those by Le Bihan et al (31) and Clark et al (4). The positive finding by Horsfield et al, however, is quite controversial due to the concomitant changes of both diffusion time and b-value in the experiments. The latter two studies used either stimulated-echo diffusion-encoding (31), which is PGSE-like, or oscillating trapezoid-sine encoding (4), which is sine-like. From Stepisnik’s diffusion spectrum point of view, it is important to note that these two diffusion-encoding schemes are primarily sensitive to the 0 Hz frequency regardless of the waveform timing (10), and therefore obscure the frequency/time-dependence of the measured ADC. Furthermore, the effective diffusion times employed in these studies were relatively long with minimum effective diffusion times of 8 ms (4). These are diffusion times where the ADC is already saturated by diffusion restriction in neuronal tissue.
The present study provides two significant contributions. Firstly, the presented formulation enables a thorough optimization of the OGSE diffusion-encoding waveform, both with regards to the shape and the timing of the waveform. The maximum gradient slew rate and gradient amplitude were fully exploited through the use of a trapezoid-cosine waveform, which yielded a higher b-value while maintaining a similar echo time and encoding spectrum as its cosine counterpart (Figure 2). Taking into consideration the DNR and T2-decay further optimized the waveforms as shown in Figure 5.
An interesting finding of the present study was the dependence of the diffusion-encoding spectrum on the polarity of the OGSE waveforms on the two sides of the refocusing pulse and the timing of the waveform (δ, Δ). For a given waveform duration δ and frequency ω0, the best frequency selectivity (in terms of the FWHM of main lobes and the ripples) is achieved with the value of Δ and the waveform polarity that maximize . Additionally, Eq. [5] shows that given a fixed diffusion-encoding duration δ and an optimal Δ, OGSE waveforms with different frequencies will have encoding spectrums with the same FWHM and ripple. The number of waveform periods fitted in δ thus becomes irrelevant to the frequency localization. This finding is important since it implies that the FWHM and ripple of OGSE encoding spectrum is limited only by δ and hence the echo time (TE).
Secondly, with these carefully designed OGSE waveforms, we were able to observe in vivo and on a human MR system the dependence of the measured ADC on the diffusion-encoding gradient waveform. Currently, these observed changes are limited to white-matter-dominant regions such as the corpus callosum where large coherent fiber bundles exist, as can be seen in the color-coded FA reference maps (Figure 6, 7). Nevertheless, this result serves as the first proof of the feasibility of OGSE on a human MR system. Since the employed cosine-trapezoid waveform is time-matched and spectrum-matched (Figure 2) with the cosine waveform, heuristically, the effective diffusion time of the trapezoid-cosine waveform can be approximated by that of its cosine waveform counterpart. In this case, the effective diffusion times used in the current experiment are 4 ms, 6 ms, and 12 ms (5), corresponding to the 63 Hz, 44 Hz, and 18 Hz encoding spectrums, respectively. Considering a diffusion coefficient of ~ 3 × 10⁻³ mm2/s (that of unrestricted water at 37°C (5)), the 1D root-mean-squared displacements are 4.9 μm, 6 μm, and 8.5μm in 4ms, 6ms, and 12 ms, respectively. Therefore, the observed frequency/time dependence of ADC suggests that the typical restriction diameter in the human genu and splenium of the corpus callosum is of several micrometers. In a previous study using PGSE acquisition and the single-diameter fiber model, a mean fiber diameter of 6 – 10 μm was reported in human genu and splenium of the corpus callosum (32), which agrees well with our data.
Multiple factors resulting from the in vivo experimental setting can bias the ADC frequency dependence analysis. First and foremost, the b-value (200 s/mm2) employed in the current study is relatively low. As suggested by Le Bihan (33), the measured diffusion signal at this low b-value might be contaminated with intra-voxel incoherent motion (IVIM) signal. Two models were previously proposed to explain the source of IVIM signal (34):
Model 1: Blood flow goes through multiple capillary segments with random orientation during the diffusion time.
Model 2: There exist multiple capillary segments with random orientation within a voxel, however, blood flow does not change from one capillary segment to another segment during the diffusion time.
Since our proposed trapezoid-cosine waveform is velocity-compensated (see Appendix), the contribution of IVIM signal from model 2, which is flow-like, is quite minimal. Further investigation is still needed to assess the contribution of the IVIM signal from model 1.
For fast data acquisition, the readout trajectory of choice in the current study is EPI. The additional diffusion weighting that the readout waveform introduces is negligible. With the employed acquisition parameters (24 over scan lines, 24 cm × 24 cm FOV, readout bandwidth +/−125 kHz, echo spacing 692 μs), the additional b-value at the center of k-space is 0.02 s/mm2.
Important artifacts induced by EPI acquisitions are ghosting due to gradient delays and misregistration due to motion between different volumes within an experiment (that is, between the acquisition of one encoding frequency). These artifacts can reduce the accuracy of ADC frequency dependence analysis, and subsequently bias our results if unaccounted for. Ghosting artifacts can arise from an inadequate ghost correction and GRAPPA parameter estimation during the calibration phase. However our data was unlikely to have been affected by ghost-induced artifacts as the best ghost parameters of 15 b = 0 scans were used for the ghost correction procedure. Motion that can occur across image volumes within an experiment was mitigated through the use of rigid registration of diffusion-weighted images to the b = 0 image. To minimize the effects of noise and additional partial voluming from experiment-to-experiment registration, the ADC frequency dependence analysis is currently done only on ROIs in white matter regions with known predominant uni-directional fibers, such as the genu and splenium of the corpus callosum. We anticipate that the incorporation of navigator-free prospective motion correction techniques, such as in (35), would benefit the current study.
Additional artifacts can arise from B0 inhomogeneity and eddy currents induced by the OGSE waveform, the effects of which become worse with increasing echo spacing in the EPI readout train. In this study, susceptibility artifacts were reduced significantly by employing a 3-interleaf trajectory. Regarding eddy currents, their effects are reduced in OGSE compared with PGSE through the presence of closely placed, sign-alternate diffusion-encoding gradient lobes. Also note that the OGSE waveform reduces the sensitivity of the estimated ADC to background and imaging gradient cross terms (5,36).
CONCLUSION
Through analytic solutions and experimental verifications, the trapezoid-cosine was found to be the OGSE waveform that achieves an optimal DNR and frequency localization. Using this waveform, the frequency-dependence of the measured ADCs was observed in white-matter-dominant regions, such as the corpus callosum. The results obtained demonstrate the potential of utilizing an OGSE acquisition for investigating restricted diffusion on a human MR system. OGSE may provide a new diffusion contrast mechanism that can probe tissue at the sub-cellular level, which could in turn become an early marker for disease or treatment response. Despite promising preliminary results, with more powerful gradient systems on the horizon (e.g. ‘Connectome gradients’), the acquisition OGSE in humans is likely to demonstrate an even further benefit.
Acknowledgments
The authors thank Dr. Dimitrios Karampinos and Dr. Murat Aksoy for their helpful discussions. The authors acknowledge grant support through the National Institutes of Health: 1 R01 EB 11654, 1 R01 EB 8706, 5 R01 EB 2711, and 1 R01 EB 6526.
APPENDIX
Encoding frequency spectrum of a truncated cosine waveform
The finite cosine diffusion-encoding waveform of duration δ on either side of the refocusing pulse and separation Δ can be described mathematically as
| [A1] |
where N is the number of cosine periods on each side of the refocusing pulse, ω0 is the frequency of the cosine waveform, whilst rect(t) is the rectangular function defined as
| [A2] |
The “plus” (in the “±” sign) in Eq. [A1] corresponds to the case when the cosine waveforms on the two sides of the refocusing pulse have opposite polarities while the “minus” corresponds to the same polarities case. The Fourier transform of the phase accumulation induced by this gradient waveform is
| [A3] |
where ∂(ω) is the Dirac’s delta function, sinc(ω) is the normalized sinc function and * represent the convolution operation. Computing the convolutions in Eq. [A3] gives
| [A4] |
Therefore, the encoding frequency spectrum is
| [A5] |
where H(ω) = cos(ω) if the waveforms on the two sides of the refocusing pulse have opposite polarities and H(ω) = sin(ω) if the waveforms on the two sides of the refocusing pulse have equal polarities.
When Δ ≈ δ and H(ω) = cos(ω), Eq. [A5] becomes
| [A6] |
Since δ is the duration of the OGSE waveform on each side of the refocusing pulse, we have . As a results and Eq. [A6] can be rewritten as
| [A7] |
Velocity-compensation property of the OGSE trapezoid-cosine waveform
The velocity-sensitivity of a gradient waveform is proportional to its first moment (37). Therefore, to show that the proposed OGSE trapezoid-cosine waveform is velocity-compensated, we need to show that its first moment is 0. The following property of the first moment of a gradient waveform is key to our proof (37):
If a gradient waveform g(t) is symmetric around t = τ, i.e. g(t) = g(2τ−t)), its first moment at the end of the waveform is
| [A8] |
where m0 is the zeroth moment at the end of the waveform. Therefore, from Eq. [A8], if the gradient waveform is symmetric and its zeroth moment at the end of the waveform is 0, its first moment at the end of the waveform is also 0.
Consider the OGSE trapezoid-cosine waveform as given in Figure A1. It can be seen that the zeroth moments of the left and right waveforms equal 0 at their respective ends. Furthermore, when considered separately, the left and the right trapezoid-cosine waveforms are symmetric around and , respectively. Therefore, the first moments of the left ( ) and the right ( ) trapezoid-cosine waveforms equal 0 at their respective ends. The first moment of the total OGSE trapezoid-cosine waveform at its end is
Figure A1.
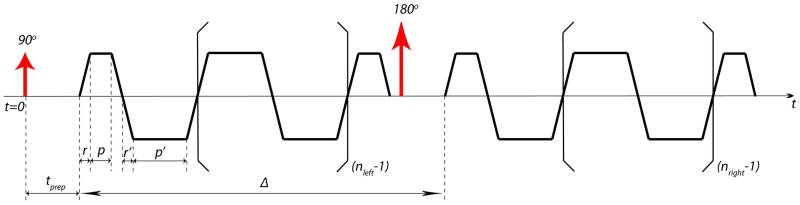
A simplified OGSE sequence diagram using trapezoid-cosine waveform with nleft and nright periods before and after the refocusing pulse, respectively. Time starts (t = 0) at the center of the excitation pulse. r, p are the ramp time and plateau time of both the first and last trapezoid, respectively; r′, p′ are the ramp time and plateau time of other trapezoid lobes in between. To have the desired gradient modulation spectrum as its cosine waveform counterpart, the timing of the waveform has to satisfy: (p′+r′) = 2(p+r).
| [A9] |
Therefore, the OGSE trapezoid-cosine waveform is velocity compensated. Similarly, it can be shown that the cosine and double-sine waveforms are also velocity compensated.
References
- 1.Latour LL, Svoboda K, Mitra PP, Sotak CH. Time-Dependent Diffusion of Water in a Biological Model System. P Natl Acad Sci USA. 1994;91(4):1229–1233. doi: 10.1073/pnas.91.4.1229. [DOI] [PMC free article] [PubMed] [Google Scholar]
- 2.Frohlich AF, Jespersen SN, Ostergaard L, Kiselev VG. The effect of impermeable boundaries of arbitrary geometry on the apparent diffusion coefficient. J Magn Reson. 2008;194(1):128–135. doi: 10.1016/j.jmr.2008.06.009. [DOI] [PubMed] [Google Scholar]
- 3.Schachter M, Does MD, Anderson AW, Gore JC. Measurements of restricted diffusion using an oscillating gradient spin-echo sequence. J Magn Reson. 2000;147(2):232–237. doi: 10.1006/jmre.2000.2203. [DOI] [PubMed] [Google Scholar]
- 4.Clark CA, Hedehus M, Moseley ME. Diffusion time dependence of the apparent diffusion tensor in healthy human brain and white matter disease. Magn Reson Med. 2001;45(6):1126–1129. doi: 10.1002/mrm.1149. [DOI] [PubMed] [Google Scholar]
- 5.Does MD, Parsons EC, Gore JC. Oscillating gradient measurements of water diffusion in normal and globally ischemic rat brain. Magn Reson Med. 2003;49(2):206–215. doi: 10.1002/mrm.10385. [DOI] [PubMed] [Google Scholar]
- 6.Stepisnik J. Analysis of Nmr Self-Diffusion Measurements by a Density-Matrix Calculation. Physica B & C. 1981;104(3):350–364. [Google Scholar]
- 7.Gore JC, Xu J, Colvin DC, Yankeelov TE, Parsons EC, Does MD. Characterization of tissue structure at varying length scales using temporal diffusion spectroscopy. NMR Biomed. 2010;23(7):745–756. doi: 10.1002/nbm.1531. [DOI] [PMC free article] [PubMed] [Google Scholar]
- 8.Callaghan PT, Stepisnik J. Frequency-Domain Analysis of Spin Motion Using Modulated-Gradient Nmr. J Magn Reson Ser A. 1995;117(1):118–122. [Google Scholar]
- 9.Parsons EC, Does MD, Gore JC. Modified oscillating gradient pulses for direct sampling of the diffusion spectrum suitable for imaging sequences. Magn Reson Imaging. 2003;21(3–4):279–285. doi: 10.1016/s0730-725x(03)00155-3. [DOI] [PubMed] [Google Scholar]
- 10.Parsons EC, Jr, Does MD, Gore JC. Temporal diffusion spectroscopy: theory and implementation in restricted systems using oscillating gradients. Magn Reson Med. 2006;55(1):75–84. doi: 10.1002/mrm.20732. [DOI] [PubMed] [Google Scholar]
- 11.Stepisnik J, Callaghan PT. The long time tail of molecular velocity correlation in a confined fluid: observation by modulated gradient spin-echo NMR. Physica B. 2000;292(3–4):296–301. [Google Scholar]
- 12.Stepisnik J, Callaghan PT. Low-frequency velocity correlation spectrum of fluid in a porous media by modulated gradient spin echo. Magn Reson Imaging. 2001;19(3–4):469–472. doi: 10.1016/s0730-725x(01)00269-7. [DOI] [PubMed] [Google Scholar]
- 13.Stepisnik J, Lasic S, Mohoric A, Sersa I, Sepe A. Spectral characterization of diffusion in porous media by the modulated gradient spin echo with CPMG sequence. J Magn Reson. 2006;182(2):195–199. doi: 10.1016/j.jmr.2006.06.023. [DOI] [PubMed] [Google Scholar]
- 14.Aggarwal M, Jones MV, Calabresi PA, Mori S, Zhang J. Probing mouse brain microstructure using oscillating gradient diffusion MRI. Magn Reson Med. 2012;67(1):98–109. doi: 10.1002/mrm.22981. [DOI] [PMC free article] [PubMed] [Google Scholar]
- 15.Colvin DC, Loveless ME, Does MD, Yue Z, Yankeelov TE, Gore JC. Earlier detection of tumor treatment response using magnetic resonance diffusion imaging with oscillating gradients. Magn Reson Imaging. 2011;29(3):315–323. doi: 10.1016/j.mri.2010.10.003. [DOI] [PMC free article] [PubMed] [Google Scholar]
- 16.Novikov DS, Kiselev VG. Surface-to-volume ratio with oscillating gradients. J Magn Reson. 2011;210(1):141–145. doi: 10.1016/j.jmr.2011.02.011. [DOI] [PubMed] [Google Scholar]
- 17.Le Bihan D. Diffusion and perfusion magnetic resonance imaging: applications to functional MRI. xxi. New York: Raven Press; 1995. p. 374. [Google Scholar]
- 18.Jones DK. Diffusion MRI: theory, methods, and applications. xvi. Oxford: Oxford University Press; 2011. p. 767. [Google Scholar]
- 19.Xing D, Papadakis NG, Huang CL, Lee VM, Carpenter TA, Hall LD. Optimised diffusion-weighting for measurement of apparent diffusion coefficient (ADC) in human brain. Magn Reson Imaging. 1997;15(7):771–784. doi: 10.1016/s0730-725x(97)00037-4. [DOI] [PubMed] [Google Scholar]
- 20.Stanisz GJ, Odrobina EE, Pun J, Escaravage M, Graham SJ, Bronskill MJ, Henkelman RM. T1, T2 relaxation and magnetization transfer in tissue at 3T. Magn Reson Med. 2005;54(3):507–512. doi: 10.1002/mrm.20605. [DOI] [PubMed] [Google Scholar]
- 21.Conturo TE, McKinstry RC, Akbudak E, Robinson BH. Encoding of anisotropic diffusion with tetrahedral gradients: a general mathematical diffusion formalism and experimental results. Magn Reson Med. 1996;35(3):399–412. doi: 10.1002/mrm.1910350319. [DOI] [PubMed] [Google Scholar]
- 22.Skare S, Newbould RD, Clayton DB, Albers GW, Nagle S, Bammer R. Clinical multishot DW-EPI through parallel imaging with considerations of susceptibility, motion, and noise. Magn Reson Med. 2007;57(5):881–890. doi: 10.1002/mrm.21176. [DOI] [PMC free article] [PubMed] [Google Scholar]
- 23.Holdsworth SJ, Aksoy M, Newbould RD, Yeom K, Van AT, Ooi MB, Barnes PD, Bammer R, Skare S. Diffusion tensor imaging (DTI) with retrospective motion correction for large-scale pediatric imaging. J Magn Reson Imaging. 2012 doi: 10.1002/jmri.23710. Epub ahead of print. [DOI] [PMC free article] [PubMed] [Google Scholar]
- 24.Holdsworth SJ, Skare S, Newbould RD, Bammer R. Robust GRAPPA-accelerated diffusion-weighted readout-segmented (RS)-EPI. Magn Reson Med. 2009;62(6):1629–1640. doi: 10.1002/mrm.22122. [DOI] [PMC free article] [PubMed] [Google Scholar]
- 25.Skare S, Clayton DB, Newbould RD, Moseley ME, Bammer R. A fast and robust minimum entropy based ghost correction. Seatle: 2006. p. 2349. [Google Scholar]
- 26.Griswold MA, Jakob PM, Heidemann RM, Nittka M, Jellus V, Wang J, Kiefer B, Haase A. Generalized autocalibrating partially parallel acquisitions (GRAPPA) Magn Reson Med. 2002;47(6):1202–1210. doi: 10.1002/mrm.10171. [DOI] [PubMed] [Google Scholar]
- 27.Qu P, Shen GX, Wang C, Wu B, Yuan J. Tailored utilization of acquired k-space points for GRAPPA reconstruction. J Magn Reson. 2005;174(1):60–67. doi: 10.1016/j.jmr.2005.01.015. [DOI] [PubMed] [Google Scholar]
- 28.Cuppen J, van Est A. Reducing MR imaging time by one-sided reconstruction. Magn Reson Imag. 1987;5(6):526–527. [Google Scholar]
- 29.Haacke EM, Lindskogj ED, Lin W. A fast, iterative, partial-fourier technique capable of local phase recovery. J Magn Reson. 1991;92(1):126–145. [Google Scholar]
- 30.Horsfield MA, Barker GJ, McDonald WI. Self-diffusion in CNS tissue by volume-selective proton NMR. Magn Reson Med. 1994;31(6):637–644. doi: 10.1002/mrm.1910310609. [DOI] [PubMed] [Google Scholar]
- 31.Le Bihan D, Turner R, Douek P. Is water diffusion restricted in human brain white matter? An echo-planar NMR imaging study. Neuroreport. 1993;4(7):887–890. doi: 10.1097/00001756-199307000-00012. [DOI] [PubMed] [Google Scholar]
- 32.Alexander DC, Hubbard PL, Hall MG, Moore EA, Ptito M, Parker GJ, Dyrby TB. Orientationally invariant indices of axon diameter and density from diffusion MRI. Neuroimage. 2010;52(4):1374–1389. doi: 10.1016/j.neuroimage.2010.05.043. [DOI] [PubMed] [Google Scholar]
- 33.Le Bihan D. Diffusion, confusion and functional MRI. Neuroimage. 2012;62(2):1131–1136. doi: 10.1016/j.neuroimage.2011.09.058. [DOI] [PubMed] [Google Scholar]
- 34.Le Bihan D, Breton E, Lallemand D, Aubin ML, Vignaud J, Laval-Jeantet M. Separation of diffusion and perfusion in intravoxel incoherent motion MR imaging. Radiology. 1988;168(2):497–505. doi: 10.1148/radiology.168.2.3393671. [DOI] [PubMed] [Google Scholar]
- 35.Aksoy M, Forman C, Straka M, Skare S, Holdsworth S, Hornegger J, Bammer R. Real-time optical motion correction for diffusion tensor imaging. Magn Reson Med. 2011;66(2):366–378. doi: 10.1002/mrm.22787. [DOI] [PMC free article] [PubMed] [Google Scholar]
- 36.Hong XL, Dixon WT. Measuring Diffusion in Inhomogeneous Systems in Imaging Mode Using Antisymmetric Sensitizing Gradients. Journal of Magnetic Resonance. 1992;99(3):561–570. [Google Scholar]
- 37.Bernstein MA, King KF, Zhou XJ. Handbook of MRI pulse sequences. xxii. Burlington, MA; London: Elsevier Academic; 2004. p. 1017. [Google Scholar]