Abstract
PDX1 is a homeodomain transcription factor essential for pancreatic development and mature beta cell function. Homeodomain proteins typically recognize short TAAT DNA motifs in vitro: this binding displays paradoxically low specificity and affinity, given the extremely high specificity of action of these proteins in vivo. To better understand how PDX1 selects target genes in vivo, we have examined the interaction of PDX1 with natural and artificial binding sites. Comparison of PDX1 binding sites in several target promoters revealed an evolutionarily conserved pattern of nucleotides flanking the TAAT core. Using competitive in vitro DNA binding assays, we defined three groups of binding sites displaying high, intermediate and low affinity. Transfection experiments revealed a striking correlation between the ability of each sequence to activate transcription in cultured beta cells, and its ability to bind PDX1 in vitro. Site selection from a pool of oligonucleotides (sequence NNNTAATNNN) revealed a non-random preference for particular nucleotides at the flanking locations, resembling natural PDX1 binding sites. Taken together, the data indicate that the intrinsic DNA binding specificity of PDX1, in particular the bases adjacent to TAAT, plays an important role in determining the spectrum of target genes.
INTRODUCTION
Homeodomain proteins are a large family of transcription factors possessing the hallmark 60 amino acid homeodomain that is highly conserved from yeast to human. Since their initial characterization in 1984 (1,2), homeodomain proteins have been studied extensively, because of the crucial role they play in a broad range of developmental processes in virtually all metazoan organisms (3). Through their ability to regulate gene expression, these proteins apparently act as switches that control the activities of batteries of genes during development (4).
Structural studies have revealed that the homeodomain consists of an N-terminal arm and three α helices (5), a structure that confers on the proteins the key property of sequence-specific binding to DNA. Since the repertoire of target genes for most homeodomain proteins is poorly defined, studies of DNA binding specificity have generally focused on in vitro analysis of their interactions with artificial DNA sequences. This approach has generated a detailed picture of DNA contacts made by a variety of homeodomains [reviewed in (6–8)]. Homeodomains typically bind a core TAAT sequence, with additional binding specificity contributed by base-specific interactions with the 2 nucleotides 3′ of the TAAT motif (6). However, numerous studies have indicated that the specificity and affinity of in vitro DNA binding is relatively low, despite the fact that these proteins function in a very precise and specific manner during development and cell differentiation (9).
Several explanations for this ‘homeodomain paradox’ have been proposed. For instance, additional DNA binding regions present on a subset of homeodomain proteins (e.g. the POU domain family) have been shown to substantially increase DNA binding affinity and specificity (10). Alternatively, it has been proposed that cofactors may facilitate the high specificity of action observed in vivo (11). Indeed in recent years, members of the PBC family of homeodomain proteins have been shown to serve as cofactors of homeodomain proteins (12). PBC proteins are capable of interacting with a subclass of homeodomain proteins via a conserved hexapeptide motif located N-terminal of the homeodomain, thereby expanding the DNA recognition sequence (13,14). A third explanation, the ‘widespread binding’ model, proposes that multiple monomer binding sites exist in target gene promoters, thereby increasing promoter occupancy, perhaps aided by cooperative binding mechanisms (15).
PDX1 (also known as IPF1, IDX-1 and STF-1) is a highly conserved 284 amino acid homeodomain protein expressed selectively in pancreatic precursor cells and in mature pancreatic beta cells (16). It is essential for pancreas development, since loss of PDX1 function results in agenesis of the organ both in mice (17) and in humans (18). PDX1 is also needed for normal function of mature pancreatic beta cells (19). Indeed under some circumstances, PDX1 may be sufficient to activate a pancreatic developmental program in non-pancreatic lineages, since ectopic expression of PDX1 in liver cells can bring about conversion to a pancreatic phenotype (20–22).
PDX1 represents one of the few homeodomain proteins for which several potential target genes with well-characterized promoters [e.g. the insulin, islet amyloid polypeptide (IAPP) and pancreatic glucokinase genes] have been identified (23–25). Yet the mechanism whereby these genes are selectively activated remains unclear. PDX1 contains a hexapeptide motif N-terminal to the homeodomain, and it has been shown that heteromeric complexes of PDX1 with PBC family members, e.g. PBX and Meis proteins, are able to bind with high affinity to the TAGTTAAT elements on the somatostatin (26) and elastase I (27) gene promoters. However, this high-affinity site is not found on the majority of potential beta cell target promoters (26). Thus, interaction with PBC proteins may not be essential for PDX1 function in mature pancreatic beta cells. This is consistent with the observation that the hexapeptide appears to be dispensable for activation of the insulin gene promoter in transgenic mice (28), and raises the possibility that selection of target genes is accomplished by PDX1 alone, perhaps as a monomer.
The aim of this study was to analyze the binding site preference of PDX1 with a view to better understanding the mode of action of the protein, and to help define the repertoire of target genes. Upon comparison of PDX1 binding sites on the insulin gene and other putative PDX1 target genes, we observed a strong conservation of nucleotides on either side of the TAAT core. This prompted us to test the functional significance of these flanking nucleotides. Our results indicate that PDX1 is able to discriminate in vitro among potential binding sites on natural promoters and on artificial binding sites, by virtue of 3 bp flanking the TAAT motif. By transfecting cultured beta cells with reporter genes bearing wild-type and mutated promoters, we showed that these flanking sites are also important for PDX1 action in vivo. The unanticipated ability of PDX1 to recognize an extended DNA sequence may help to explain how target gene preference of this crucial gene is determined in vivo.
MATERIALS AND METHODS
Plasmids
The plasmids pGL3.Synt.LUC and pRL.RSV have been described previously (29). The unique BamHI site in pGL3.Synt.LUC was destroyed by fill-in and religation, to produce pGL3.Synt-DB. For mutations in the A1 region (–83 to –74), the backbone reporter plasmid pGL3.S8a-DB was made by substituting the rat insulin I gene promoter region between PstI (–160) and HindIII (+1) in pGL3.Synt-DB with that from pS8a-CAT, a derivative of the plasmid pOK1 that contains a unique, transcriptionally silent BamHI site (–85) just upstream of the A1 element in the rat insulin I gene promoter (30). This construct was first digested at the unique HindIII site (+1), dephosphorylated, and then digested at the unique BamHI site (–85). Synthetic oligonucleotides with the desired mutations in the A1 TAAT flanking bases were annealed and ligated, together with a 64-bp linker, between the BamHI (–85) and HindIII (+1) sites of pGL3.S8a-DB. The 64-bp linker spanning the positions from –63 to +1 was produced by annealing the following oligonucleotides: 64-top d(AAGTCCAGGGGGCAGAGAGGAGGTGCTTT GGACTATAAAGCTAGTGGAGACCCAGTAACTCCCA) and 64-bot d(AGCTTGGGAGTTACTGGGTCTCCACTAG CTTTATAGTCCAAAGCACCTCCTCTCTGCCCCC). For mutations in the A3 region (–216 to –207), a unique EcoRI site (–250) was introduced in pGL3.Synt.LUC using the Quick Change™ site-directed mutagenesis kit (Stratagene). This construct was then digested at the EcoRI site, dephosphorylated and subsequently digested at the unique AvrII site (–205). Synthetic oligonucleotides with the desired mutations in the A3 TAAT flanking bases were then annealed and ligated, together with an 18-bp linker, between the EcoRI and AvrII sites. The 18-bp linker spanning the positions from –252 to –235 was produced by annealing the following oligonucleotides: 18-top d(AATTCCTTCATCAGGCCA) and 18-bot d(GCCAGATGGCCTGATGAAGG). Double mutations were then made by substituting the wild-type rat insulin I gene promoter region between the PstI (–160) and HindIII (+1) sites of the A3 type mutations with those from the A1 mutations. The constant 64- and 18-bp linkers were phosphorylated using polynucleotide kinase prior to ligation. The relevant regions of recombinant plasmids were verified by DNA sequencing.
Cell culture and transfections
Hamster insulinoma cells HIT (subclone M2.2.2) (31,32) were cultured in Dulbecco’s modified Eagles medium in the presence of 10% fetal calf serum, penicillin (200 IU/ml) and streptomycin (100 µg/ml). Cells were transfected using the calcium-phosphate co-precipitation procedure (33). HIT cells were plated 12 h before transfection on six-well plates at 2.5 × 10⁵ cells/well. Cells were cotransfected with 400 ng of the firefly luciferase reporter plasmid containing the rat insulin I gene promoter (wild type or mutated) and 100 ng of the Renilla luciferase (pRL.RSV) internal control plasmid. Firefly luciferase activity was measured and normalized according to the Renilla luciferase activity (29). Each experiment was performed in duplicate at least three times. Results shown are mean ± SE.
Electrophoretic mobility shift assay (EMSA)
Nuclear protein extracts for EMSA were prepared from HIT cells as described previously (34). Complementary synthetic oligonucleotides, diluted to a final concentration of 5 µM in 2.5 mM HEPES pH 7.9, 15 mM KCl, 1% glycerol and 0.5 mM dithiothreitol (DTT) were heated at 85°C for 3 min, and allowed to anneal by slow cooling (2–3 h) to room temperature. Double-stranded oligonucleotides (5 pmol) were end-labeled using DNA polymerase I (Klenow fragment) in the presence of 50 µCi [α-32P]dATP as described (34). The specific activity obtained was typically 1–2 × 10³ c.p.m./fmol. EMSA experiments were carried out as described previously (34), with the following modifications. For competition experiments, nuclear extract (2–3 µg protein) was incubated for 10 min on ice in 10 µl of EMSA binding buffer (25 mM HEPES pH 7.9, 150 mM KCl, 10% glycerol, 5 mM DTT) containing 600 ng of poly dI–dC (Sigma) and 600 ng of poly dA–dT (Sigma). Radioactive probe (∼20 000 c.p.m.) containing the desired molar excess of unlabeled DNA competitor in EMSA binding buffer was then added, and incubation was allowed to continue for an additional 20 min on ice. Following electrophoresis on non-denaturing polyacrylamide gel, the dried gels were analyzed by phosphorimager (Bio-Imaging Analyzer, BAS-2500; Fuji). The extent of DNA binding was calculated using Image Gauge 3.41 software (Fuji) and compared with that observed in the absence of competitor DNA. Data presented are mean ± SE from at least three independent experiments.
Apparent equilibrium dissociation constants (Kd) were calculated by analysis of competition binding data using the equation of Cheng and Prusoff (35), under conditions where a low percentage (<25%) of radioactive DNA is bound by PDX1. For this purpose, IC50 (concentration of unlabeled DNA that blocks 50% of binding to labeled DNA) was determined from the equation: Y = NS + (T – NS)/(1 + 10log(D)–log(IC50)), using non-linear regression fitting of the data from competition EMSA (KaleidaGraph 3.0.4, Adelbeck Software). [Y is total binding measured in the presence of various concentrations of the unlabeled competitor, (D) is concentration of competitor, T is the binding in the absence of competitor, NS is non-specific binding (determined from residual binding in the presence of a saturating concentration of competitor)]. The Kd values are mean ± SE from three independent competition EMSA experiments.
Selection and amplification of binding sites (SAAB)
Mouse PDX1 was expressed as a glutathione S-transferase (GST) fusion protein in Escherichia coli strain BL-21. The recombinant protein was purified by batch purification using glutathione–Sepharose 4B beads (Pharmacia Biotech). Oligonucleotide selection was performed with a DNA fragment containing degenerate bases at three positions on both sides of the ATTA core flanked by non-random sequences: d(GATCGACGTCCAGTGGATCCTTGANNNATTANNNGATGCCGGCAAGACTGGGAACAGTAG). The single-stranded oligonucleotide containing the random sequence was made double stranded by annealing with an oligonucleotide complementary to the 3′ non-random sequence: d(CTACTGTTCCCAGTCTTG) (SAAB bot), and fill-in reaction using PCR in the presence of 50 µCi [α-32P]dATP, and 200 µM dATP, 200 µM dCTP, 200 µM dGTP and 200 µM dTTP in a final volume of 50 µl. Oligonucleotides used for PCR were as follows: SAAB top [d(GAT CGACGTCCAGTGGAT)] and SAAB bot (see above). PCRs were carried out in separate tubes for 10, 15 and 20 cycles. Aliquots (5 µl) were then resolved by agarose gel electrophoresis. DNA derived from PCRs showing efficient incorporation of radioactivity yet remaining within the exponential PCR range, were incubated with GST–PDX1 protein (270 ng) and processed as for EMSA. DNA from the resulting DNA–protein complexes was subjected to three additional cycles of binding, EMSA and purification essentially as described (36). After the fourth round of selection, the eluted DNA was amplified by 25 cycles of PCR and cloned into the vector pGEM-T Easy (Promega). The recombinant clones were then sequenced.
RESULTS
Analysis of PDX1 in vitro binding sites within the insulin gene promoter
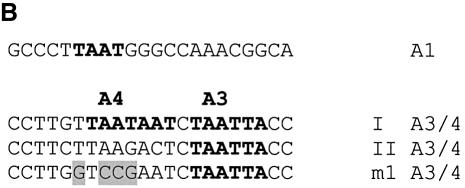
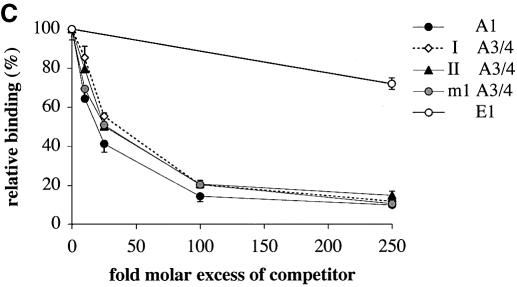
PDX1 has been shown to bind two different elements within the rat insulin I gene promoter: A1 and A3/4 (Fig. 1A) (26,37–39). The A1 element contains a single TAAT motif (Fig. 1B) flanked on both sides by a number of evolutionary conserved bases (Fig. 2). A3/4 is a more complex element, containing from one to four TAAT sites that differ from each other both in their flanking bases and in the degree of evolutionary conservation among the rat, mouse and human insulin gene promoters (Fig. 2). The A3 region is highly conserved, whereas the A4 region is much more variable: only in the rat insulin I gene does it possess a core TAAT sequence. These differences suggest that PDX1 may act differently on these elements. Furthermore, the strong evolutionary conservation of PDX1 function implies that within the A3/4 element the protein will primarily act at the most conserved site, i.e. the A3 element. Thus, PDX1 may be able to distinguish TAAT of the A3 site from irrelevant TAATs nearby, by recognizing bases flanking these TAATs. To test these ideas, we compared PDX1 binding to these naturally occurring sequences by competitive EMSA. Nuclear extracts from HIT cells were incubated with the rat insulin I A3/4 probe in the presence of increasing concentrations of competitor sequences containing the A1 and A3/4 elements from the rat insulin I and II gene promoters, or rat insulin I A3/4 element with a mutated A4 TAAT site (m1 A3/4) (Fig. 1B). The E1 sequence, derived from the rat insulin 1 gene lacks a TAAT sequence and was used as a control for non-specific binding. We observed that all the A1 and A3/4 sequences tested displayed similar ability to compete for DNA binding (Fig. 1C), indicating similar binding affinities. Since the A3/4 element displays binding indistinguishable from that of m1 A3/4 that lacks A4, it seems likely that A3 is the primary binding site for PDX1 in this region, as expected from its evolutionary conservation.
Figure 1.
Competition EMSA analysis using the rat insulin I A3/4 probe. (A) Locations of key cis-elements in the rat insulin I gene promoter. TATA indicates position of the TATA box. (B) Sequences of wild-type (A1, I A3/4, II A3/4) and mutated (m1 A3/4) promoter elements from the rat insulin I and II gene promoters used in the EMSA analysis. TAAT sequences are marked with bold letters, mutated nucleotides in m1 A3/4 are highlighted. (C) Competition EMSA analysis was performed using HIT cell nuclear extract with probe derived from the rat insulin I A3/4 sequence in the presence of the indicated excess of unlabeled competitor DNA. Binding of PDX1 was expressed as a percentage (mean ± SE, n ≥ 3) of that observed in the absence of competitor. The E1 element from the rat insulin I gene promoter (E1, CGCCATCTGCCA) lacks a TAAT motif and was used as a non-specific competitor.
Figure 2.
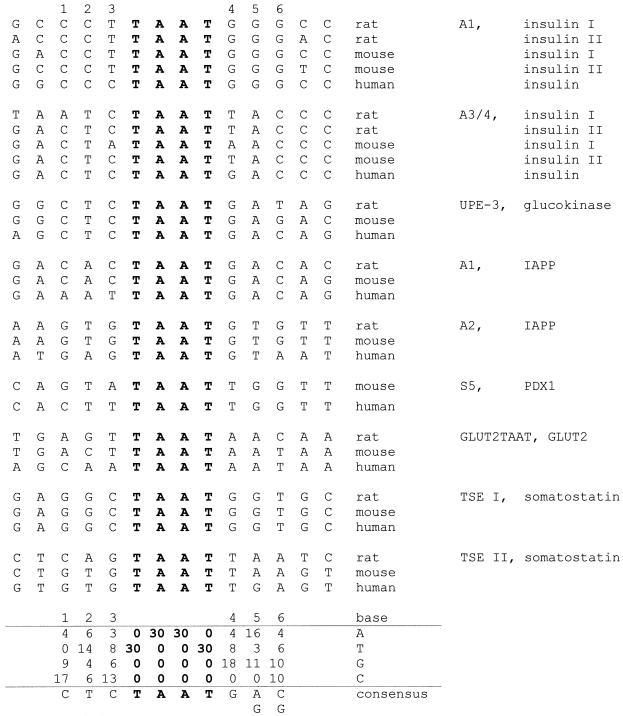
Tabulation of native PDX1 binding sites. Alignment of 30 sequences of experimentally defined potential PDX1 binding sites from human, mouse and rat genes relative to the TAAT motif (shown in bold). Designations of the PDX1 binding sites [according to nomenclature from (39,41,42,44–46)] are indicated on the right together with the corresponding genes. TAAT flanking positions are numbered. Below the sequences, a nucleotide frequency matrix and the derived consensus are shown.
Comparison of PDX1 binding properties among its potential target promoters in vitro
We analyzed the distribution of bases flanking the TAAT core in a number of potential PDX1 target genes of rat, mouse and human. Alignments were compiled using the programs ClustalW (40), PileUp (GCG) and FindPatterns (GCG). We restricted the analysis to conserved sites that have been experimentally shown to be PDX1 responsive (39,41–46). The alignment reveals a clear, non-random distribution of nucleotides at three positions adjacent to the TAAT core sequences, and yields the consensus sequence CTCTAATGA/GC/G (Fig. 2).
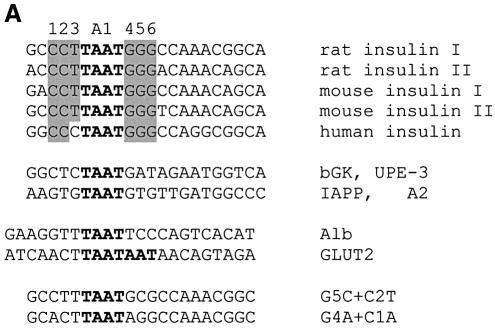
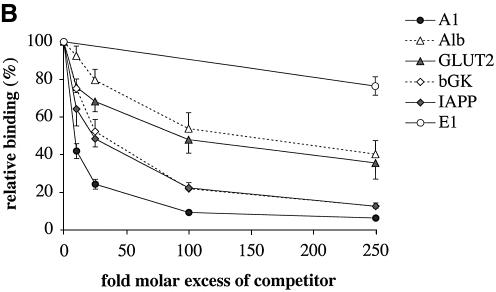
To compare the relative binding affinities of these elements, we used competition EMSA with TAAT sites derived from several PDX1 target promoters. The rat insulin I gene A1 sequence (containing a single TAAT site) was used as a probe, and incubated with nuclear extract from HIT cells in the presence of increasing concentrations of competitor sequences containing TAAT elements from promoters of the following genes: rat insulin I (A1 element), rat pancreatic glucokinase [UPE-3 site (41)], rat IAPP [A2 site (42)], mouse glucose transporter type 2 [GLUT2 TAAT site (45)] and mouse albumin (24) (a gene expressed in liver but not in pancreas, and therefore not a PDX1 target) (Fig. 3A). The sequences fell into three groups in terms of their ability to compete for binding (Fig. 3B). The most effective competitor was A1 itself, while TAAT sequences from GLUT2 and albumin gene promoters showed low efficiency of competition; the sites from IAPP and pancreatic glucokinase gene promoters both displayed intermediate competition efficiency (Fig. 3B).
Figure 3.
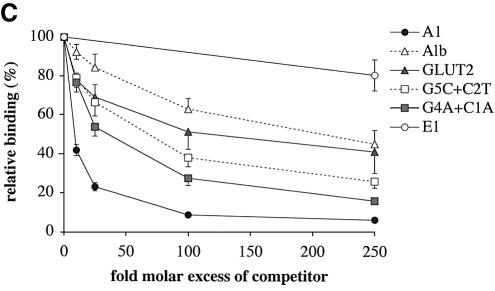
In vitro DNA binding specificity of PDX1. (A) Alignment of A1 elements from rat, mouse and human insulin gene promoters with TAAT elements from other genes. The TAAT sequences are shown in bold. Conserved flanking bases are highlighted. Sequences of TAAT promoter elements that were used in the EMSA analysis are aligned with respect to their conserved TAAT sites. The elements are from rat pancreatic glucokinase (bGK), IAPP, albumin (Alb) and mouse GLUT2 (GLUT2) gene promoters. Mutated oligonucleotides (G5C + C2T and G4A + C1A) are aligned with respect to the TAAT site of rat insulin I A1 element. (B and C) Competition EMSA analysis showing percentage of relative binding (mean ± SE, n ≥ 3) of PDX1 (derived from HIT nuclear extracts) to the rat insulin I A1 probe in the presence of the indicated molar excess of competitor sequence. The E1 element from rat insulin I promoter was used as a non-specific competitor (see legend to Fig. 1).
The competition analysis allowed us to measure the affinity of PDX1 binding to DNA, by calculating apparent Kd values. The Kd values obtained for PDX1 were in the nanomolar range, typical for homeodomain proteins (47–50). The apparent Kd for the A1 binding site was 5.9 ± 0.9 nM, significantly lower (P < 0.005) than that for albumin and GLUT2 TAAT sites (24.6 ± 1.8 and 24.7 ± 4.2 nM, respectively).
In order to clarify the nucleotide requirements for DNA recognition by PDX1, we made a series of DNA competitors with nucleotide substitutions within the A1 probe that resemble the ‘unfavorable’ bases from GLUT2 and albumin promoter TAAT elements (Fig. 3A). The effects of these substitutions were tested by competition EMSA using HIT cell nuclear protein extracts. Simultaneous substitutions both upstream and downstream of TAAT (G5C + C2T—as in albumin, and G4A + C1A—as in GLUT2) led to a substantial decrease in PDX1 binding, although the extent of the effect was less than that observed for the corresponding TAAT elements from the albumin and GLUT2 promoters (Fig. 3C). Therefore, the 2 nt mutated in each case are important in determining binding affinity, but are insufficient to explain completely the differences between high and low affinity TAAT core sequences.
Effect of TAAT flanking bases in vivo
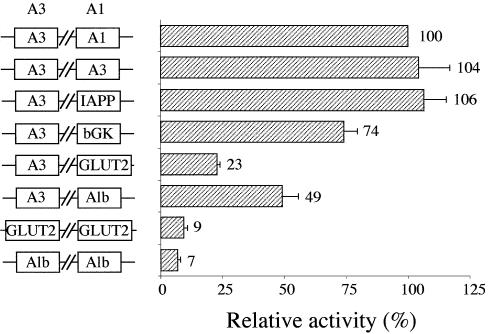
To assess the physiological role of TAAT flanking nucleotides within PDX1 binding sites, we made a series of reporter plasmids based on the firefly luciferase reporter gene under control of the rat insulin I gene promoter. For this purpose, the A1 site (TAAT and three bases flanking it on both sides) was substituted with the corresponding sequences from the previously examined PDX1 binding sites from the promoters of the following genes: rat insulin I (A3 site), IAPP, pancreatic glucokinase, GLUT2 and albumin (see Fig. 2 for sequence details). The activities of these reporter plasmids were then compared with that of the wild-type rat insulin I gene promoter following transient transfection of HIT cells (Fig. 4). As expected, the A3 sequence, which has PDX1 binding affinity similar to A1, showed activity essentially identical to the wild-type promoter (104%). On the other hand, the TAAT sequences from the GLUT2 and albumin promoters, that display weak PDX1 binding in vitro, showed significantly weaker promoter activity (23 and 49%, respectively). The UPE-3 site from the pancreatic promoter of the glucokinase gene (moderate PDX1 binding in vitro) showed intermediate activity (74%). The IAPP site (PDX1 binding similar to that of glucokinase) produced unexpectedly high (106%) promoter activity, probably indicating involvement of additional parameters in vivo not detected in vitro by EMSA, that are beyond simple PDX1–DNA interactions. Conceivably, the presence of an intact A3 site may partially compensate for a sub-optimal binding site in the A1 location.
Figure 4.
Effect of TAAT flanks on rat insulin I gene promoter activity. A series of firefly luciferase reporter plasmids containing wild-type or mutated rat insulin I gene promoter were constructed using the plasmid pGL3.Synt.LUC as described in Materials and Methods. TAAT elements from rat insulin I A3 (A3), pancreatic glucokinase (bGK), IAPP, mouse GLUT2 and rat albumin (Alb) promoters replacing the A1 region of the rat insulin I gene promoter are indicated under the heading ‘A1’; those replacing the A3 region are shown under the heading ‘A3’, respectively. HIT cells were transfected with the indicated reporter plasmids. The firefly luciferase activity was normalized to the activity of the internal control Renilla luciferase gene driven by RSV promoter. The normalized activities of the modified promoters are expressed (mean ± SE, n ≥ 3) relative to that of the wild-type rat insulin I gene promoter.
To confirm these results, we made a series of double mutations in the rat insulin I gene promoter with substitutions of both A1 and A3 sites by the TAAT elements from albumin and GLUT2 genes (Fig. 4). Since the A3 and A4 sites are located very close to each other, we designed substitutions within A3 that involved only the 3 nt downstream of the TAAT site on the sense strand, thereby maintaining the wild-type A4 sequence. Simultaneous replacement of both A1 and A3 regions with the corresponding sequences from albumin and GLUT2 genes led to a further substantial reduction in promoter activity, as compared with single mutations, to 7 and 9%, respectively (Fig. 4). Taken together, our results indicate that the TAAT core is not sufficient to bring about activation of the promoter, and that 3 bp adjacent to the core play an important role in determining target gene selection both in vitro and in vivo. Further, since the TAAT motif from the GLUT2 promoter shows inefficient binding in vitro and functions relatively inefficiently in vivo, this promoter seems unlikely to serve as a direct target of PDX1 action.
SAAB analysis of PDX1 binding
In order to determine systematically the in vitro DNA binding specificity of PDX1, we used the SAAB procedure (51). GST–PDX1 fusion protein was expressed in bacteria and purified using glutathione–Sepharose beads. The DNA binding properties of this purified GST–PDX1 were assessed by EMSA analysis. This recombinant protein specifically binds the A1 DNA, and is efficiently competed with unlabeled A1, but not E1 (Fig. 5), indicating DNA binding properties similar to that of native PDX1. We used this purified GST–PDX1 protein to select sequences possessing optimal TAAT flanking bases.
Figure 5.
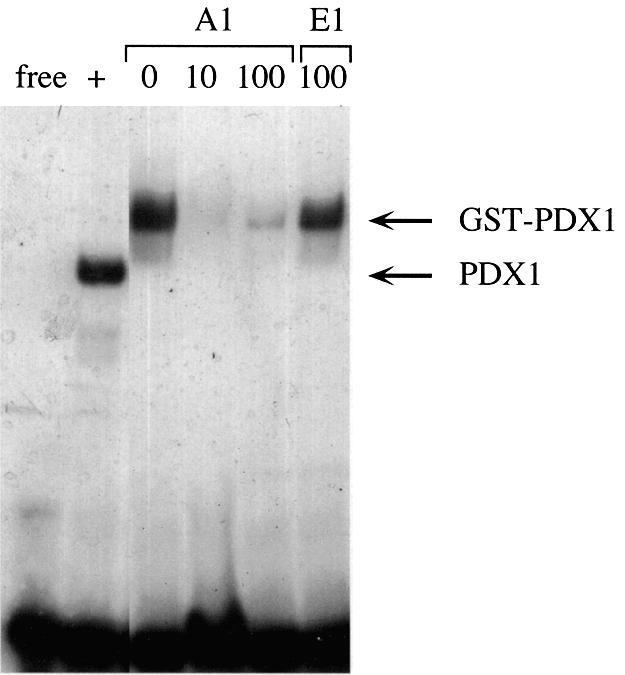
DNA binding properties of GST–PDX1 protein. EMSA with the A1 probe from the rat insulin I gene promoter using 20 ng of purified GST-PDX1. ‘Free’ indicates the A1 probe in the absence of added protein extract. HIT nuclear extract (2.5 µg) was used as a positive control (‘+’). The fold molar excess of unlabeled A1 and E1 (non-specific competitor) DNA used is indicated. The positions of migration of DNA complexes containing PDX1 and GST–PDX1 are indicated.
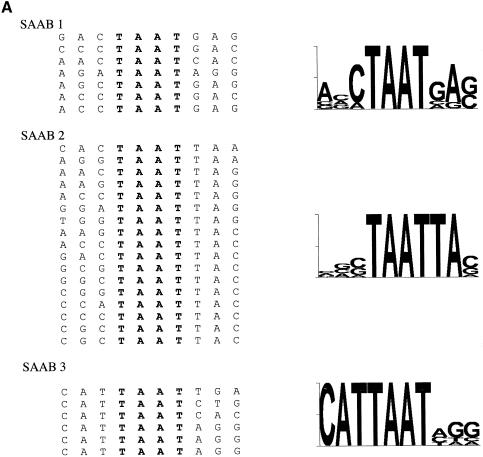
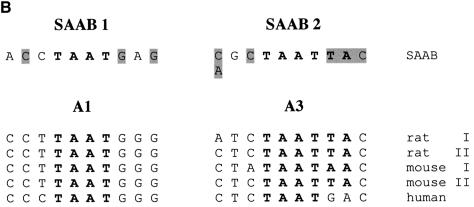
Comparison of the 30 sequences obtained after four rounds of site selection shows a strikingly non-random distribution of TAAT flanking bases (Fig. 6A) resembling natural PDX1 binding sites. The sequences fall into three different groups according to the number and relative position of the TAAT core (Fig. 6A). The first group (seven clones, designated SAAB1) has consensus sequence (based on most frequently occurring nucleotides) ACCTAATGAG, resembling (three out of six bases identical) the A1 site of insulin gene promoters (CCTTAATGGG) (Fig. 6B). The largest group (17 clones, SAAB2) contains a palindromic double TAAT sequence (TAATTA) with consensus sequence A/CGCTAATTAC. This sequence is closely similar (five out of six bases identical) to the insulin gene A3 consensus site (CTCTAATTAC) (Fig. 6B). The third group (six clones) also contains a palindromic double TAAT site, but of opposite orientation, generating a CATTAATAGG consensus sequence that we did not observe in putative PDX1 target promoters analyzed (Fig. 6A). Thus, the majority of sequences selected by SAAB are related to natural PDX1 binding sites in the insulin gene promoters.
Figure 6.
(A) Alignment of PDX1 binding sites derived from SAAB analysis. On the left side are shown the aligned nucleotide sequences arranged into three groups (SAAB1, SAAB2 and SAAB3) according to number and orientation of TAAT motifs (shown in bold). On the right are shown the corresponding sequences displayed in ‘sequence logo’ (60) format. (B) Comparison of SAAB consensus sequences with natural TAAT sites. Alignments of two SAAB consensus sites (SAAB1 and SAAB2) from (A), based on the most frequently appearing nucleotide at each position, with the A1 and A3 regions from rat, mouse and human insulin gene promoters. TAAT motifs are shown in bold, conserved flanking bases are highlighted.
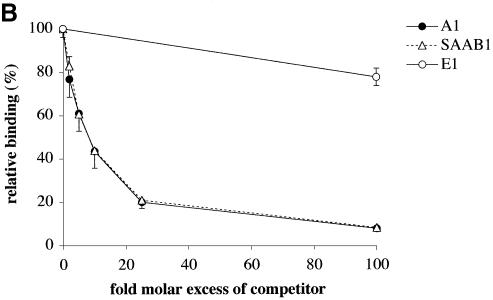
The SAAB approach is expected to select sequences of relatively high binding affinity. To validate the effectiveness of the SAAB procedure, we examined the properties of the SAAB1 consensus sequence. Natural TAAT flanks of the A1 probe were substituted with the corresponding bases from the single TAAT consensus sequence (Fig. 7A) and analyzed by competition EMSA. The relative PDX1 binding affinity of this construct (designated SAAB1) was indistinguishable from that of the wild-type A1 sequence (Fig. 7B), confirming that the SAAB procedure indeed selected high affinity binding sites.
Figure 7.
PDX1 binding to the SAAB1 consensus site. (A) Alignment of SAAB1 sequence with insulin I gene A1 element. (B) Competition EMSA analysis showing relative binding (mean ± SE, n ≥ 3) of PDX1 (derived from HIT nuclear extracts) to the rat insulin I A1 probe in the presence of the indicated molar excess of the SAAB1 consensus sequence (ACCTAATGAG) or rat insulin I A1 DNA. The rat insulin I E1 element was used as a non-specific competitor (see legend to Fig. 1).
DISCUSSION
In this study, we have examined the DNA binding specificity of the key pancreatic transcription factor PDX1. Although the crucial role of PDX1 in pancreas development and beta cell gene expression is well established, the mechanism whereby it selectively activates genes and the identity of its target genes, particularly those activated during development, remain poorly understood. This is a reflection of our incomplete understanding of the actions of homeodomain proteins.
PDX1 contains a hexapeptide domain that permits dimerization with PBC proteins and binding to compound cis elements on the somatostatin and amylase promoters. However, since most pancreatic somatostatin- or amylase-producing cells do not express PDX1 (52), the significance of the dimerization is not clear. Indeed it appears that binding sites for PDX1/PBC heterodimeric complexes are absent in several PDX1 target genes, e.g. the insulin gene (26). Furthermore, PDX1 protein bearing a mutation in the hexapeptide motif was able to partly rescue the phenotype of PDX1 knockout mice (28). Thus, for at least some of the in vivo actions of PDX1, it appears that promoter recognition is mediated without involvement of PBC co-factors, perhaps through DNA binding by a monomer of PDX1. A key question therefore surrounds the mechanisms whereby PDX1 is able to select target genes as monomers.
A considerable amount of evidence suggests that the insulin gene represents a direct target of PDX1, including recent chromatin immunoprecipitation experiments showing that PDX1 is bound to the insulin gene promoter in vivo (24,25). We therefore initially examined the ability of PDX1 to discriminate among cis elements located in the insulin gene promoter, a well-characterized promoter which has been shown previously to contain two cis elements (A1 and A3/4) that are efficiently recognized in vitro by PDX1 (26). Using a competition EMSA procedure, we showed that the A1 and A3 sequences were recognized with similar efficiency by PDX1. On the other hand, the A4 region was apparently not required for efficient binding. The A4 region has been shown previously to represent a binding site for the transcription factor HNF1α (53). Interestingly, only in the rat insulin I gene does the A4 region contain a TAAT core: this region is not conserved in other characterized insulin gene promoters (Figs 1B and 2). Thus, A4 is unlikely to represent a physiologically relevant PDX1 target site. The data do indicate however, that the evolutionarily conserved A3 and A1 regions are the key determinants of PDX1 binding within the promoter. Furthermore, the differences between A1 and A3 on the one hand, and A4 on the other, indicate the likely contribution of additional nucleotides flanking the TAAT core in determining the efficiency of PDX1 binding. In the case of A1 and A3, there is significant conservation of at least 3 nt on either side of the TAAT motif.
PDX1 represents one of the few homeodomain proteins, for which several multiple well-characterized promoters have been identified as potential direct targets. This enabled us to correlate DNA binding preferences of PDX1 to the occurrence of particular bases flanking the TAAT core site in the native target sequences. To our knowledge, this represents the first time such an analysis has been performed for a homeodomain protein. We observed a strikingly non-random organization of bases flanking the TAAT core. Utilizing the quantitative EMSA assay, we were able to show that these binding sites could be classified into several groups based on their relative binding affinities. Thus, the IAPP and pancreatic glucokinase sites bind relatively efficiently, though at significantly lower affinity than the insulin A1 and A3/4 sites. In contrast, the GLUT2 site exhibits lower binding affinity, similar to that shown by a site contained within the albumin promoter, a gene expressed selectively in liver cells, and therefore not a PDX1 target gene. These analyses clearly indicate that the PDX1 protein possesses the ability to discriminate in vitro between potential binding sites based on the nucleotides flanking the TAAT core.
To examine systematically the in vitro binding preference of PDX1, we utilized the SAAB procedure (51) with oligonucleotides degenerate at the 3 nt upstream and downstream of the TAAT core. The selected sequences fell into three groups showing a non-random distribution of nucleotides flanking the TAAT core. Two of the groups bear a similarity to natural TAAT binding sites, particularly the A1 and A3 regions of the insulin gene promoter. To verify the ability of the SAAB-selected sequences to efficiently bind DNA, we used EMSA analysis. Indeed the SAAB1 sequence showed DNA binding affinity indistinguishable from A1. These results confirm that efficient PDX1 binding to DNA involves sequences flanking the TAAT core, and that the A1 and A3 sites of the insulin gene promoter correspond to preferred binding sites. Thus, DNA recognition by PDX1 seems to involve at least two different mechanisms. When the TGATTAAT sequence is available, e.g. in the somatostatin promoter, PDX1 can bind as a heterodimer with a PBC family co-factor. Alternatively, PDX1 binds as a monomer to TAAT sequences different from TGATTAAT, with affinities according to the flanking bases as described in this study.
Previous studies have examined systematically the DNA binding preference of homeodomain proteins, and have observed a variable degree of sequence specificity in bases flanking the TAAT core (49,54,55). Homeodomain proteins possessing a glutamine at residue 50 of the homeodomain, preferentially recognize the sequence TAAT G/T G/T (47). The significance of flanking bases in vivo has not been examined in detail previously. Utilizing the well defined beta cell transcriptional activity of the insulin gene promoter (56), we examined the in vivo significance of the sequence variability surrounding the TAAT core. Indeed the observed in vivo activity showed a strong correlation with the ability of PDX1 to bind these TAAT elements in vitro. These data indicate that PDX1 is able to discriminate among TAAT elements both in vitro and in vivo by virtue of the flanking nucleotides. Thus, the intrinsic DNA binding ability of monomer homeodomain proteins may play a more important role than suspected previously in determining the spectrum of target genes.
GLUT2 is an isoform of a membrane glucose transporter that is predominantly expressed in liver and pancreatic beta cells, and has been proposed to comprise part of the glucose-sensing mechanism of the beta cell (57). Yet the role of PDX1 in regulating GLUT2 gene expression is not clear. On the one hand, it has been shown that PDX1 expression activates the GLUT2 promoter (19,45,58). On the other hand, transgenic mice expressing dominant negative FGFR1 show strongly reduced GLUT2, but essentially no effect on PDX1 expression, consistent with a model whereby PDX1 activates GLUT2 indirectly, through FGF signaling (59). Chromatin immunoprecipitation studies support this idea, since PDX1 apparently does not bind to the GLUT2 promoter in vivo (24). Our data indicate that this may be the result of an intrinsically low efficiency of binding to the TAAT element of the GLUT2 gene, rather than chromatin accessibility effects.
The molecular basis for the extended sequence recogni tion by PDX1 is not clear. A substantial number of three-dimensional structures of homeodomain–DNA complexes have been elucidated by X-ray crystallography and NMR (4). These reveal a conserved protein–DNA interface, in which sequence-specific DNA protein interactions are mediated principally by residues located in the so-called ‘recognition helix’, the highly conserved third alpha helix of the homeodomain. These contacts involve primarily the TAAT core and 2–3 nt 3′ terminal to the core. The structures reveal little or no sequence-specific interaction with nucleotides 5′ from the core. Since evolutionary comparisons and the SAAB analysis clearly indicate a significant role for at least 3 nt at the 5′ side, previously unrecognized mechanisms must be involved. These may include additional protein–DNA interactions, perhaps mediated by amino acids outside the homeodomain, or through interactions involving indirect readout of the DNA sequence, or a possible involvement of heterodimeric DNA binding complexes with an as yet unidentified partner protein. Detailed structure–function analysis of the binding sites will be required to better define these issues.
Previous studies of homeodomain–DNA interaction have tended to focus on in vitro binding properties of homeodomain proteins, or the homeodomain itself (6). The approach we have used differs from these in that we have also examined the functional significance of homeodomain binding sequences in the context of a native full-length promoter of a bona fide PDX1 target gene. Thus, we have been able to demonstrate that reduced in vitro binding to particular TAAT elements correlates with substantially reduced biological activity, and thereby pinpoints DNA binding specificity of PDX1 as an important factor in determining the spectrum of target genes. As additional target genes of other homeodomain proteins are identified, it will be possible to apply this type of analysis to better understand the process of selective gene regulation by these homeodomain proteins also.
Acknowledgments
ACKNOWLEDGEMENTS
We would like to thank Drs G. Schreiber, R. Dikstein and S. Ferber for valuable discussions, and the members of the Walker laboratory for many useful suggestions. The work was supported in part by grants to M.D.W. from the Israel Academy of Sciences and Humanities, the Roy and Ellen Rosenthal Family Foundation, and the Laufer Trust. M.D.W. is the incumbent of the Marvin Meyer and Jenny Cyker Chair of Diabetes Research.
REFERENCES
- 1.McGinnis W., Garber,R.L., Wirz,J., Kuroiwa,A. and Gehring,W.J. (1984) A homologous protein-coding sequence in Drosophila homeotic genes and its conservation in other metazoans. Cell, 37, 403–408. [DOI] [PubMed] [Google Scholar]
- 2.Laughon A. and Scott,M.P. (1984) Sequence of a Drosophila segmentation gene: protein structure homology with DNA-binding proteins. Nature, 310, 25–31. [DOI] [PubMed] [Google Scholar]
- 3.McGinnis W. and Krumlauf,R. (1992) Homeobox genes and axial patterning. Cell, 68, 283–302. [DOI] [PubMed] [Google Scholar]
- 4.Gehring W.J., Affolter,M. and Burglin,T. (1994) Homeodomain proteins. Annu. Rev. Biochem., 63, 487–526. [DOI] [PubMed] [Google Scholar]
- 5.Kissinger C.R., Liu,B.S., Martin-Blanco,E., Kornberg,T.B. and Pabo,C.O. (1990) Crystal structure of an engrailed homeodomain-DNA complex at 2.8Å resolution: a framework for understanding homeodomain-DNA interactions. Cell, 63, 579–590. [DOI] [PubMed] [Google Scholar]
- 6.Laughon A. (1991) DNA binding specificity of homeodomains. Biochemistry, 30, 11357–11367. [DOI] [PubMed] [Google Scholar]
- 7.Billeter M. (1996) Homeodomain-type DNA recognition. Prog. Biophys. Mol. Biol., 66, 211–225. [DOI] [PubMed] [Google Scholar]
- 8.Ledneva R.K., Alekseevskii,A.V., Vasil’ev,S.A., Spirin,S.A. and Kariagina,A.S. (2001) Structural aspects of homeodomain interactions with DNA. Mol. Biol. Mosk., 35, 764–777. [PubMed] [Google Scholar]
- 9.Lawrence P.A. (1992) The Making of a Fly. Blackwell, Oxford, UK. [Google Scholar]
- 10.Herr W. and Cleary,M.A. (1995) The POU domain: versatility in transcriptional regulation by a flexible two-in-one DNA-binding domain. Genes Dev., 9, 1679–1693. [DOI] [PubMed] [Google Scholar]
- 11.Mann R.S. (1995) The specificity of homeotic gene function. Bioessays, 17, 855–863. [DOI] [PubMed] [Google Scholar]
- 12.Mann R.S. and Affolter,M. (1998) Hox proteins meet more partners. Curr. Opin. Genet. Dev., 8, 423–429. [DOI] [PubMed] [Google Scholar]
- 13.Chan S.K. and Mann,R.S. (1996) A structural model for a homeotic protein-extradenticle-DNA complex accounts for the choice of HOX protein in the heterodimer. Proc. Natl Acad. Sci. USA, 93, 5223–5228. [DOI] [PMC free article] [PubMed] [Google Scholar]
- 14.Wilson D.S. and Desplan,C. (1999) Structural basis of Hox specificity. Nature Struct. Biol., 6, 297–300. [DOI] [PubMed] [Google Scholar]
- 15.Biggin M.D. and McGinnis,W. (1997) Regulation of segmentation and segmental identity by Drosophila homeoproteins: the role of DNA binding in functional activity and specificity. Development, 124, 4425–4433. [DOI] [PubMed] [Google Scholar]
- 16.McKinnon C.M. and Docherty,K. (2001) Pancreatic duodenal homeobox-1, PDX-1, a major regulator of beta cell identity and function. Diabetologia, 44, 1203–1214. [DOI] [PubMed] [Google Scholar]
- 17.Jonsson J., Carlsson,L., Edlund,T. and Edlund,H. (1994) Insulin promoter factor 1 is required for pancreas development in mice. Nature, 371, 606–609. [DOI] [PubMed] [Google Scholar]
- 18.Stoffers D., Zinkin,N., Stanojevic,V., Clarke,W. and Habener,J. (1997) Pancreatic agenesis attributable to a single nucleotide deletion in the human IPF1 gene coding sequence. Nature Genet., 15, 106–110. [DOI] [PubMed] [Google Scholar]
- 19.Ahlgren U., Jonsson,J., Jonsson,L., Simu,K. and Edlund,H. (1998) Beta-cell-specific inactivation of the mouse Ipf1/Pdx1 gene results in loss of the beta-cell phenotype and maturity onset diabetes. Genes Dev., 12, 1763–1768. [DOI] [PMC free article] [PubMed] [Google Scholar]
- 20.Ferber S., Halkin,A., Cohen,H., Ber,I., Einav,Y., Goldberg,I., Barshack,I., Seijffers,R., Kopolovic,J., Kaiser,N. and Karasik,A. (2000) Pancreatic and duodenal homeobox gene 1 induces expression of insulin genes in liver and ameliorates streptozotocin-induced hyperglycemia. Nature Med., 6, 568–572. [DOI] [PubMed] [Google Scholar]
- 21.Horb M.E., Shen,C.N., Tosh,D. and Slack,J.M. (2003) Experimental conversion of liver to pancreas. Curr. Biol., 13, 105–115. [DOI] [PubMed] [Google Scholar]
- 22.Zalzman M., Gupta,S., Giri,R.K., Berkovich,I., Sappal,B.S., Karnieli,O., Zern,M.A., Fleischer,N. and Efrat,S. (2003) Reversal of hyperglycemia in mice by using human expandable insulin-producing cells differentiated from fetal liver progenitor cells. Proc. Natl Acad. Sci. USA, 100, 7253–7258. [DOI] [PMC free article] [PubMed] [Google Scholar]
- 23.Ohneda K., Ee,H. and German,M. (2000) Regulation of insulin gene transcription. Semin. Cell Dev. Biol., 11, 227–233. [DOI] [PubMed] [Google Scholar]
- 24.Chakrabarti S.K., James,J.C. and Mirmira,R.G. (2002) Quantitative assessment of gene targeting in vitro and in vivo by the pancreatic transcription factor, Pdx1. Importance of chromatin structure in directing promoter binding. J. Biol. Chem., 277, 13286–13293. [DOI] [PubMed] [Google Scholar]
- 25.Cissell M.A., Zhao,L., Sussel,L., Henderson,E. and Stein,R. (2003) Transcription factor occupancy of the insuling gene in vivo. Evidence for direct regulation by Nkx2.2. J. Biol. Chem., 278, 751–756. [DOI] [PubMed] [Google Scholar]
- 26.Peers B., Sharma,S., Johnson,T., Kamps,M. and Montminy,M. (1995) The pancreatic islet factor STF-1 binds cooperatively with PBX to a regulatory element in the somatostatin promoter—importance of the FPWMK motif and of the homeodomain. Mol. Cell. Biol., 15, 7091–7097. [DOI] [PMC free article] [PubMed] [Google Scholar]
- 27.Swift G.H., Liu,Y., Rose,S.D., Bischof,L.J., Steelman,S., Buchberg,A.M., Wright,C.V. and MacDonald,R.J. (1998) An endocrine-exocrine switch in the activity of the pancreatic homeodomain protein PDX1 through formation of a trimeric complex with PBX1b and MRG1 (MEIS2). Mol. Cell. Biol., 18, 5109–5120. [DOI] [PMC free article] [PubMed] [Google Scholar]
- 28.Dutta S., Gannon,M., Peers,B., Wright,C., Bonner-Weir,S. and Montminy,M. (2001) PDX:PBX complexes are required for normal proliferation of pancreatic cells during development. Proc. Natl Acad. Sci. USA, 98, 1065–1070. [DOI] [PMC free article] [PubMed] [Google Scholar]
- 29.Bartoov-Shifman R., Hertz,R., Wang,H., Wollheim,C.B., Bar-Tana,J. and Walker,M.D. (2002) Activation of the insulin gene promoter through a direct effect of hepatocyte nuclear factor 4 alpha. J. Biol. Chem., 277, 25914–25919. [DOI] [PubMed] [Google Scholar]
- 30.Karlsson O., Edlund,T., Moss,J.B., Rutter,W.J. and Walker,M.D. (1987) A mutational analysis of the insulin gene transcription control region: expression in beta cells is dependent on two related sequences within the enhancer. Proc. Natl Acad. Sci. USA, 84, 8819–8823. [DOI] [PMC free article] [PubMed] [Google Scholar]
- 31.Edlund T., Walker,M.D., Barr,P.J. and Rutter,W.J. (1985) Cell-specific expression of the rat insulin gene: evidence for role of two distinct 5′ flanking elements. Science, 230, 912–916. [DOI] [PubMed] [Google Scholar]
- 32.Santerre R.F., Cook,R.A., Crisel,R.M. D., Sharp,J.D., Schmidt,R.J., Williams,D.C. and Wilson,C.P. (1981) Insulin synthesis in a clonal cell line of simian virus 40-transformed hamster pancreatic beta cells. Proc. Natl Acad. Sci. USA, 78, 4339–4343. [DOI] [PMC free article] [PubMed] [Google Scholar]
- 33.Wigler M., Pellicer,A., Silverstein,S., Axel,R., Urlaub,G. and Chasin,L. (1979) DNA-mediated transfer of the adenine phosphoribosyltransferase locus into mammalian cells. Proc. Natl Acad. Sci. USA, 76, 1373–1376. [DOI] [PMC free article] [PubMed] [Google Scholar]
- 34.Glick E., Leshkowitz,D. and Walker,M.D. (2000) Transcription factor BETA2 acts cooperatively with E2A and PDX1 to activate the insulin gene promoter. J. Biol. Chem., 275, 2199–2204. [DOI] [PubMed] [Google Scholar]
- 35.Cheng Y. and Prusoff,W.H. (1973) Relationship between the inhibition constant (K1) and the concentration of inhibitor which causes 50 per cent inhibition (I50) of an enzymatic reaction. Biochem. Pharmacol., 22, 3099–3108. [DOI] [PubMed] [Google Scholar]
- 36.Blackwell T.K. (1995) Selection of protein binding sites from random nucleic acid sequences. Methods Enzymol., 254, 604–618. [DOI] [PubMed] [Google Scholar]
- 37.Ohlsson H., Thor,S. and Edlund,T. (1991) Novel insulin promoter- and enhancer-binding proteins that discriminate between pancreatic α and β cells. Mol. Endocrinol., 5, 897–904. [DOI] [PubMed] [Google Scholar]
- 38.Peshavaria M., Gamer,L., Henderson,E., Teitelman,G., Wright,C.V.E. and Stein,R. (1994) XIHbox 8, an endoderm-specific Xenopus homeodomain protein, is closely related to a mammalian insulin gene transcription factor. Mol. Endocrinol., 8, 806–816. [DOI] [PubMed] [Google Scholar]
- 39.German M., Ashcroft,S., Docherty,K., Edlund,T., Edlund,H., Goodison,S., Imura,H., Kennedy,G., Madsen,O., Melloul,D., Moss,L., Olson,K., Permutt,A., Philippe,J., Robertson,R.P., Rutter,W.J., Serup,P., Stein,R., Steiner,D., Tsai,M.-J. and Walker,M.D. (1995) The insulin gene promoter: a simplified nomenclature. Diabetes, 44, 1002–1004. [DOI] [PubMed] [Google Scholar]
- 40.Thompson J.D., Higgins,D.G. and Gibson,T.J. (1994) CLUSTAL W: improving the sensitivity of progressive multiple sequence alignment through sequence weighting, position-specific gap penalties and weight matrix choice. Nucleic Acids Res., 22, 4673–4680. [DOI] [PMC free article] [PubMed] [Google Scholar]
- 41.Shelton K.D., Franklin,A.J., Khoor,A., Beechem,J. and Magnuson,M.A. (1992) Multiple elements in the upstream glucokinase promoter contribute to transcription in insulinoma cells. Mol. Cell. Biol., 12, 4578–4589. [DOI] [PMC free article] [PubMed] [Google Scholar]
- 42.Carty M.D., Lillquist,J.S., Peshavaria,M., Stein,R. and Soeller,W.C. (1997) Identification of cis- and trans-active factors regulating human islet amyloid polypeptide gene expression in pancreatic beta-cells. J. Biol. Chem., 272, 11986–11993. [DOI] [PubMed] [Google Scholar]
- 43.Marshak S., Benshushan,E., Shoshkes,M., Havin,L., Cerasi,E. and Melloul,D. (2000) Functional conservation of regulatory elements in the pdx-1 gene: PDX-1 and hepatocyte nuclear factor 3beta transcription factors mediate beta-cell-specific expression. Mol. Cell. Biol., 20, 7583–7590. [DOI] [PMC free article] [PubMed] [Google Scholar]
- 44.Gerrish K., Cissell,M.A. and Stein,R. (2001) The role of hepatic nuclear factor 1 alpha and PDX-1 in transcriptional regulation of the pdx-1 gene. J. Biol. Chem., 276, 47775–47784. [DOI] [PubMed] [Google Scholar]
- 45.Waeber G., Thompson,N., Nicod,P. and Bonny,C. (1996) Transcriptional activation of the GLUT2 gene by the IPF-1/STF-1/IDX-1 homeobox factor. Mol. Endocrinol., 10, 1327–1334. [DOI] [PubMed] [Google Scholar]
- 46.Leonard J., Peers,B., Johnson,T., Ferreri,K., Lee,S. and Montminy,M.R. (1993) Characterization of somatostatin transactivating factor-1, a novel homeobox factor that stimulates somatostatin expression in pancreatic islet cells. Mol. Endocrinol., 7, 1275–1283. [DOI] [PubMed] [Google Scholar]
- 47.Ekker S.C., Young,K.E., von Kessler,D.P. and Beachy,P.A. (1991) Optimal DNA sequence recognition by the Ultrabithorax homeodomain of Drosophila. EMBO J., 10, 1179–1186. [DOI] [PMC free article] [PubMed] [Google Scholar]
- 48.Florence B., Handrow,R. and Laughon,A. (1991) DNA-binding specificity of the fushi tarazu homeodomain. Mol. Cell. Biol., 11, 3613–3623. [DOI] [PMC free article] [PubMed] [Google Scholar]
- 49.Catron K.M., Iler,N. and Abate,C. (1993) Nucleotides flanking a conserved TAAT core dictate the DNA binding specificity of three murine homeodomain proteins. Mol. Cell. Biol., 13, 2354–2365. [DOI] [PMC free article] [PubMed] [Google Scholar]
- 50.Ades S.E. and Sauer,R.T. (1994) Differential DNA-binding specificity of the engrailed homeodomain: the role of residue 50. Biochemistry, 33, 9187–9194. [DOI] [PubMed] [Google Scholar]
- 51.Blackwell T.K. and Weintraub,H. (1990) Differences and similarities in DNA-binding preferences of MyoD and E2A protein complexes revealed by binding site selection. Science, 250, 1104–1110. [DOI] [PubMed] [Google Scholar]
- 52.Guz Y., Montminy,M.R., Stein,R., Leonard,J., Gamer,L.W., Wright,C.V.E. and Teitelman,G. (1995) Expression of murine Stf-1, a putative insulin gene-transcription factor, in beta-cells of pancreas, duodenal epithelium and pancreatic exocrine and endocrine progenitors during ontogeny. Development, 121, 11–18. [DOI] [PubMed] [Google Scholar]
- 53.Emens L.A., Landers,D.W. and Moss,L.G. (1992) Hepatocyte nuclear factor 1α is expressed in a hamster insulinoma line and transactivates the rat insulin I gene. Proc. Natl Acad. Sci. USA, 89, 7300–7304. [DOI] [PMC free article] [PubMed] [Google Scholar]
- 54.Ekker S.C., von Kessler,D.P. and Beachy,P.A. (1992) Differential DNA sequence recognition is a determinant of specificity in homeotic gene action. EMBO J., 11, 4059–4072. [DOI] [PMC free article] [PubMed] [Google Scholar]
- 55.Pellerin I., Schnabel,C., Catron,K.M. and Abate,C. (1994) Hox proteins have different affinities for a consensus DNA site that correlate with the positions of their genes on the hox cluster. Mol. Cell. Biol., 14, 4532–4545. [DOI] [PMC free article] [PubMed] [Google Scholar]
- 56.Walker M.D., Edlund,T., Boulet,A.M. and Rutter,W.J. (1983) Cell-specific expression controlled by the 5′ flanking region of insulin and chymotrypsin genes. Nature, 306, 557–561. [DOI] [PubMed] [Google Scholar]
- 57.Guillam M.T., Hummler,E., Schaerer,E., Yeh,J.I., Birnbaum,M.J., Beermann,F., Schmidt,A., Deriaz,N. and Thorens,B. (1997) Early diabetes and abnormal postnatal pancreatic islet development in mice lacking Glut-2. Nature Genet., 17, 327–330. [DOI] [PubMed] [Google Scholar]
- 58.Wang H., Maechler,P., Ritz-Laser,B., Hagenfeldt,K.A., Ishihara,H., Philippe,J. and Wollheim,C.B. (2001) Pdx1 level defines pancreatic gene expression pattern and cell lineage differentiation. J. Biol. Chem., 276, 25279–25286. [DOI] [PubMed] [Google Scholar]
- 59.Hart A.W., Baeza,N., Apelqvist,A. and Edlund,H. (2000) Attenuation of FGF signalling in mouse beta-cells leads to diabetes. Nature, 408, 864–868. [DOI] [PubMed] [Google Scholar]
- 60.Schneider T.D. and Stephens,R.M. (1990) Sequence logos: a new way to display consensus sequences. Nucleic Acids Res., 18, 6097–6100. [DOI] [PMC free article] [PubMed] [Google Scholar]


