Although species richness is classically believed to increase with area and habitat heterogeneity, unimodal patterns are commonly observed (1). A recently developed theoretical model combining the main elements of niche and island biogeography theories suggests that such unimodal patterns of species richness can result from area-heterogeneity tradeoffs (1). The four critical predictions of the model are validated by Allouche et al. (1) with an analysis of birds breeding in Catalonia (northeastern Spain). Here, we reanalyze their data to show that improved tests are warranted.
The area-heterogeneity tradeoff (A-H) model is based on the idea that for a given zone, as heterogeneity increases the amount of each habitat available for species decreases. This reduces the species population size and increases its likelihood of local extinction (1). A critical prediction of the model is, thus, that extinction rates increase with heterogeneity. However, the positive association between local extinction and heterogeneity reported by Allouche et al. (1) was largely driven by sampling effects. Using improved measures of sampling effort (2–5), we found that sampling effort was positively correlated with heterogeneity in the first survey (1975–1983; r2 = 0.12; t = 6.63; P < 0.0001) but not in the second survey (1999–2002; t = 0.62; P = 0.53). As a result, there was a significant effect of sampling effort on bird extinction numbers [ordinary least-squares model (OLS): estimate, –16.11; SE = 0.87; t = −18.42; P < 0.0001). Differences in sampling effort between surveys explained 56% of the variation in extinction numbers between consecutive surveys. When accounting for sampling effort effects, the relationship between bird extinction numbers and heterogeneity turned out nonsignificant (OLS: estimate, 1.42 10−3; SE = 7.75 × 10⁻⁴; t = 1.84; P = 0.067).
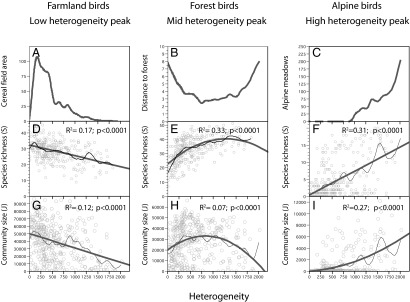
The A-H model also predicts unimodal heterogeneity–diversity relationships and a negative relationship between environmental heterogeneity and average population size (1). Although Allouche et al. (1) find support for these predictions, their analyses do not consider possible biases attributable to the nonrandom distribution of habitats along heterogeneity gradients. However, land-cover analyses revealed that farmland was more abundant at low-heterogeneity sites, forests peaked at mid heterogeneity regions, and alpine habitats increased with heterogeneity (Fig. 1 A–C). Consistent with these habitat trends, the distribution of bird richness and abundances differed between functional groups (Fig. 1 D–I). Of note, the unimodal heterogeneity–diversity relationship was only observed in forest birds (Fig. 1).
Fig. 1.

Observed variation in the distribution of habitat land cover area, bird species richness, and total bird abundance along the altitudinal heterogeneity gradient in Catalonia (northeastern Spain). Patterns are reported for three bird functional groups: farmland birds, forest birds, and alpine birds. (A–C) Spline fit describing variation along the heterogeneity gradient of farmland, forest, and alpine habitats. (D–F) Observed variation in species richness along the heterogeneity gradient for farmland, forest, and alpine birds (2). Spline fits (thin dark lines) and OLS fits (wide gray lines) are illustrated. Note that species-richness patterns for each group parallel group-specific habitat availability gradients. (G–I) Observed variation of total bird abundance (community size) along the heterogeneity gradient for farmland, forest, and alpine birds. Maximum abundances at low heterogeneity sites, as predicted by the area-heterogeneity tradeoff hypothesis, were only observed in farmland birds (G). All patterns shown are significant at P < 0.0001.
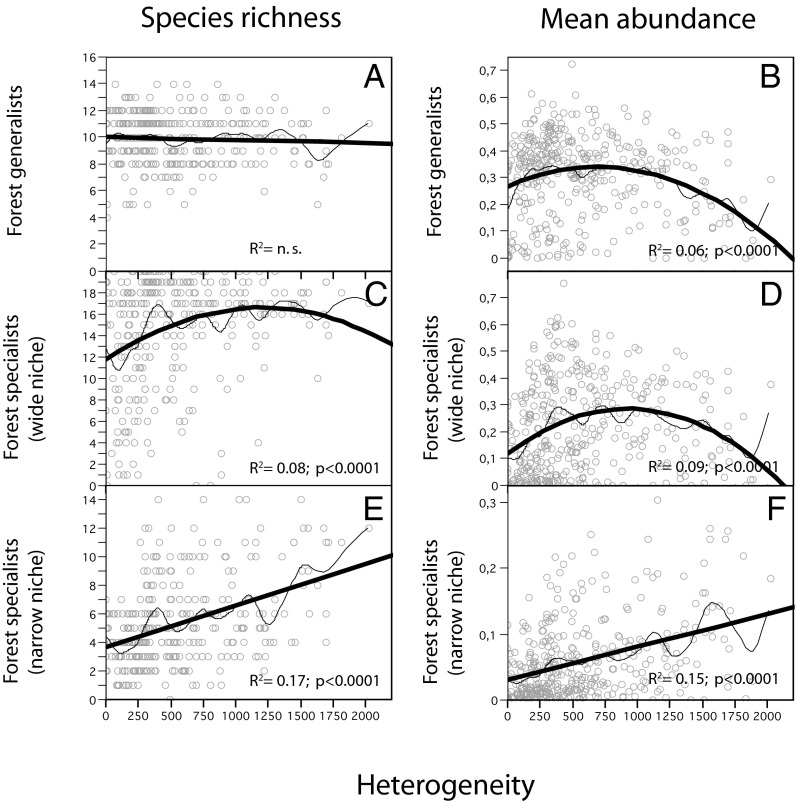
Finally, the A-H model predicts that the number of species characterized by very narrow niches should decrease when increasing heterogeneity, whereas the number of species with broad niches should exhibit the opposed pattern (1). This prediction was not supported in a test using detailed niche width estimates (Fig. 2) (5).
Fig. 2.
Test of the predictions of the area-heterogeneity tradeoff hypothesis in forest birds of Catalonia. Observed variation of species richness and mean abundance along the heterogeneity gradient for three functional groups: forest generalists (A and B), wide-niche forest specialists (C and D), and narrow-niche forest specialists (E and F). Following previous analyses (2, 5), we considered a species as a forest generalist if it inhabited both forest and farmland habitats and a forest specialist if it was restricted to forest habitats. The forest-specialist group was, in turn, subdivided in two groups, wide-niche and narrow-niche forest specialists, using quantitative metrics (see details in ref. 5). The observed trends were exactly in the opposite direction of the predictions of the area-heterogeneity hypothesis.
In summary, our analyses yield little support to the A-H model and are, instead, more consistent with previously suggested species-specific, niche-filtering mechanisms (2–5). Although, in their study, Allouche et al. (1) provide additional evidence by showing that the heterogeneity–diversity relationships in islands were often unimodal when the effect of area or habitat diversity was taken into account, our unsupportive results highlight that improved tests of the theory are still warranted.
Footnotes
The authors declare no conflict of interest.
References
- 1.Allouche O, Kalyuzhny M, Moreno-Rueda G, Pizarro M, Kadmon R. Area–heterogeneity tradeoff and the diversity of ecological communities. Proc Natl Acad Sci USA. 2012;109(43):17495–17500. doi: 10.1073/pnas.1208652109. [DOI] [PMC free article] [PubMed] [Google Scholar]
- 2.Estrada J, Pedrocchi V, Brotons L, Herrando S. 2004. Atles dels Ocells Nidificants de Catalunya 1999-2002 [Catalan Breeding Bird Atlas 1999-2002] (Lynx Edicions/Institut Català d’Ornitologia, Barcelona). Catalan.
- 3.Gil-Tena A, Brotons L, Saura S. Mediterranean forest dynamics and forest bird distribution changes in the late 20th century. Glob Change Biol. 2009;15(2):474–485. [Google Scholar]
- 4.Carnicer J, Brotons L, Sol D, Jordano P. Community-based processes behind species richness gradients: contrasting abundance–extinction dynamics and sampling effects in areas of low and high productivity. Glob Ecol Biogeogr. 2007;16(6):709–719. [Google Scholar]
- 5.Carnicer J, Brotons L, Sol D, De Cáceres M. Random sampling, abundance–extinction dynamics and niche-filtering immigration constraints explain the generation of species richness gradients. Glob Ecol Biogeogr. 2008;17(3):352–362. [Google Scholar]


