Zhang et al. (1) report that the Tibetan Plateau experienced a continuous advancing start of green-up date (SOS) from 1982 to 2011 based on the merged Global Inventory Modeling and Mapping Studies (GIMMS)-based with Moderate Resolution Imaging Spectroradiometer (MODIS) [Système Pour l’Observation de la Terre vegetation (SPOT-VGT)]-based SOSs. It challenged the previous contention that plants over the Tibetan Plateau failed to fulfill vegetation chilling due to continuous winter warming (2) and provided the evidence that spring phenology advancement was consistent with observed warming in springs and winters over the last three decades. The results have significant implications for understanding responses of spring phenology to temperature under climate change.
According to Zhang et al. (1), SOS advanced at the rate of 10.4 (15.0) days per decade, and the spring temperature increased at the rate of 0.57 (1.07) °C per decade during the period 1982–2011 (2000–2011). However, based on their long-term trends, the temperature sensitivity of spring phenology (changes in days per Celsius degree) was estimated to be −18.3 (−13.9) d⋅°C−1 during 1982–2011 (2000–2011), which was much higher (in absolute magnitude) than currently available in situ herbaceous observations (leaf unfolding: −5.6 ± 5.8 d⋅°C−1; flowering: −4.5 ± 4.7 d⋅°C−1) on the Tibetan Plateau (3). Furthermore, if the temperature sensitivity was calculated as the regression slope between interannual variations of SOS and spring temperature extracted from ref. 1, they were still higher in absolute magnitude (−10.3 and −9.1 d⋅°C−1 for 1982–2011 and 2000–2011, respectively) than the observations (3). If we multiplied these calculated temperature sensitivities by spring temperature trends, the inferred advances in spring phenology were 5.9 and 9.8 d per decade over the period 1982–2011 and 2000–2011, respectively. The estimated advances in spring phenology were substantially smaller than those reported by Zhang et al. (1) (10.4 and 15.0 d per decade, respectively). This discrepancy implied that other factors, e.g., declining snow cover especially found on the eastern Tibetan Plateau (4), may be responsible for higher Normalized Difference Vegetation Index (NDVI) values associated with the advancing trend in spring phenology.
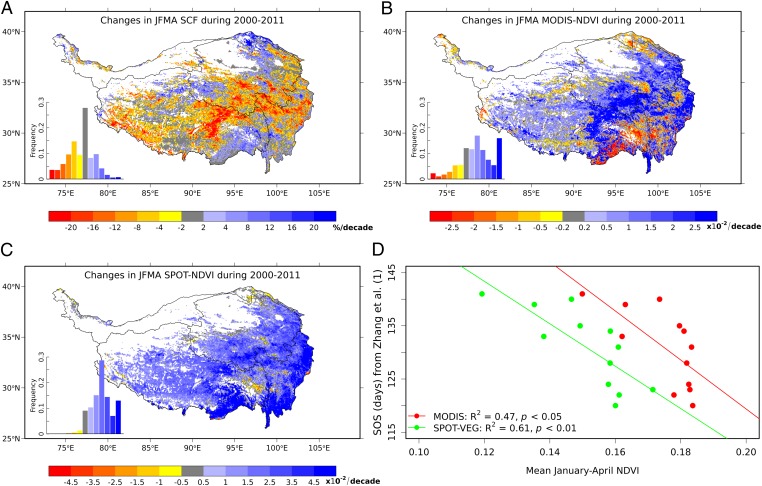
To quantify the change in snow cover on the Tibet Plateau, we used snow cover fraction (SCF, %) from 0.05 degree MODIS/Terra 8-Day Snow Cover dataset from 2000 to 2011. Our analyses showed that SCF during January–April decreased from 2000 to 2011 over a majority of pixels (Fig. 1A), which caused the corresponding NDVI to rise (Fig. 1 B and C). This rise in NDVI can be expected because the presence of snow can diminish NDVI (5). More importantly, we found that the extracted SOS from Zhang et al. (1) was not only negatively correlated with NDVI in May (MODIS, R2 = 0.36, P < 0.05; SPOT-VGT, R2 = 0.61, P < 0.01) when the onset of growing season on the Tibetan Plateau mainly occurred (1, 2), but also negatively related to January–April NDVI (MODIS, R2 = 0.47, P < 0.05; SPOT-VGT, R2 = 0.61, P < 0.01) (Fig. 1D) during the period 2000–2011. These significant correlations suggested that advances in spring phenology observed by Zhang et al. (1) may be influenced by increasing January–April NDVI values due to the declining snow cover. Thus, snow cover change in nongrowing season should not be dismissed in detection of long-term trends in spring phenology.
Fig. 1.
Spatial distributions of the trends in (A) snow cover fraction (SCF, %), (B) MODIS-NDVI, and (C) SPOT-VGT-NDVI on the Tibetan Plateau during January–April from 2000 to 2011. The trends were estimated by the use of the Mann–Kendall test. The Insets show the frequency distributions of corresponding trends. (D) The relationship between interannual variations of SOS extracted from Zhang et al. (1) and mean January–April NDVI averaged over the Tibetan Plateau. Only pixels with averaged monthly MODIS-NDVI (SPOT-VGT-NDVI) of April–October less than 0.1 were used in the graphs. JFMA, January, February, March, and April.
Acknowledgments
We are thankful for support from Agence Nationale de la Recherche CLimat, Agriculture et Société SIbérienne- QUelle Evolution and “Changing permafrost in the arctic and its global effects in the 21st century” project funding granted to Dr. C. Ottlé and Dr. G. Krinner.
Footnotes
The authors declare no conflict of interest.
References
- 1.Zhang G, Zhang Y, Dong J, Xiao X. Green-up dates in the Tibetan Plateau have continuously advanced from 1982 to 2011. Proc Natl Acad Sci USA. 2013;110(11):4309–4314. doi: 10.1073/pnas.1210423110. [DOI] [PMC free article] [PubMed] [Google Scholar]
- 2.Yu HY, Luedeling E, Xu JC. Winter and spring warming result in delayed spring phenology on the Tibetan Plateau. Proc Natl Acad Sci USA. 2010;107(51):22151–22156. doi: 10.1073/pnas.1012490107. [DOI] [PMC free article] [PubMed] [Google Scholar]
- 3.Qi RY, Wang QL, Sheng HY. Analysis of phenological-phase variation of herbage plants over Qinghai and impact of meteorological conditions. Meteorol Sci Technol. 2006;34(3):306–310. [Google Scholar]
- 4.Peng S, Piao S, Ciais P, Fang J, Wang X. Change in winter snow depth and its impacts on vegetation in China. Glob Change Biol. 2010;16:3004–3013. [Google Scholar]
- 5.Stöckli R, Vidale PL. European plant phenology and climate as seen in a 20-year AVHRR land surface parameters data set. Int J Remote Sens. 2004;25:3303–3330. [Google Scholar]


