Abstract
Autosomal dominant polycystic kidney disease (ADPKD) is a progressive genetic syndrome with an incidence of 1:500 in the population, arising from inherited mutations in the genes for polycystic kidney disease 1 (PKD1) or polycystic kidney disease 2 (PKD2). Typical onset is in middle age, with gradual replacement of renal tissue with thousands of fluid-filled cysts, resulting in end-stage renal disease requiring dialysis or kidney transplantation. There currently are no approved therapies to slow or cure ADPKD. Mutations in the PKD1 and PKD2 genes abnormally activate multiple signaling proteins and pathways regulating cell proliferation, many of which we observe, through network construction, to be regulated by heat shock protein 90 (HSP90). Inhibiting HSP90 with a small molecule, STA-2842, induces the degradation of many ADPKD-relevant HSP90 client proteins in Pkd1−/− primary kidney cells and in vivo. Using a conditional Cre-mediated mouse model to inactivate Pkd1 in vivo, we find that weekly administration of STA-2842 over 10 wk significantly reduces initial formation of renal cysts and kidney growth and slows the progression of these phenotypes in mice with preexisting cysts. These improved disease phenotypes are accompanied by improved indicators of kidney function and reduced expression and activity of HSP90 clients and their effectors, with the degree of inhibition correlating with cystic expansion in individual animals. Pharmacokinetic analysis indicates that HSP90 is overexpressed and HSP90 inhibitors are selectively retained in cystic versus normal kidney tissue, analogous to the situation observed in solid tumors. These results provide an initial justification for evaluating HSP90 inhibitors as therapeutic agents for ADPKD.
Keywords: ganetespib, HSP90 inhibitor, PKD
Polycystic kidney disease (PKD) is a common, genetically inherited disorder that poses a significant public health burden, affecting 600,000 people in the United States (1, 2). Symptoms typically manifest at middle age, with kidney function increasingly impaired as normal tissue becomes replaced by thousands of abnormally proliferating cysts. Approximately one half of PKD patients will progress to end-stage renal disease and will require renal transplantation or dialysis, the only current treatment options. Autosomal dominant PKD (ADPKD) arises from inactivating mutations in the PKD1 or PKD2 genes, disrupting numerous signaling pathways that regulate kidney homeostasis. Signaling proteins hyperactivated in ADPKD kidneys include human epidermal growth factor receptor 2 (HER2), serin-threonin kinase AKT (AKT), mammalian target of rapamycin (mTOR), STAT3, Proto-oncogene tyrosine-protein kinase Src (SRC), ERK1/2, RAF proto-oncogene serine/threonine-protein kinase (RAF), and others (3). Therapeutic strategies under evaluation for PKD include inhibitors of some of these individual proteins, such as SRC and mTOR (4, 5). However, extensive experience with development and evaluation of targeted therapies in clinical trials for other conditions of abnormal proliferation, such as cancer, has suggested that only rarely is inhibition of single signaling targets sufficient to limit cell growth fully (6, 7).
As an alternative approach, the molecular chaperone heat shock protein 90 (HSP90) promotes the folding and function of hundreds of client proteins, including the majority of the human kinome (8). Inhibitors of HSP90 have shown encouraging signs of clinical activity in patients with cancer because of this ability to affect many of the essential components driving the disease (9). There are numerous parallels between ADPKD and cancer in terms of altered growth, apoptosis, differentiation, and signaling (10). Notably, many proteins that are hyperactive in ADPKD are clients of HSP90 (8, 11). We hypothesized that inhibitors of the HSP90 chaperone protein might be broadly active in limiting cyst growth and improving kidney function based on simultaneous inhibition of multiple proteins supporting progressive growth of cysts. To test this idea, we used STA-2842, a highly specific inhibitor of HSP90, in a mouse model of ADPKD (12) to assess the efficacy of this strategy in limiting disease-associated signaling pathways and disease progression. Our results summarized below indicate STA-2842 has significant efficacy in limiting kidney and cystic growth and in improving renal function.
Results
To determine if the chaperone HSP90 plays a role in PKD-relevant signaling, we systematically investigated the intersection of HSP90 client proteins and proteins associated with PKD. The resulting set of 33 common proteins, which included many known to display abnormally elevated activity in ADPKD patients (13), represented a 4.1-fold enrichment over intersections between randomly selected groups of proteins (P = 7 × 10⁻⁷) (Fig. 1A). We then asked if inhibition of HSP90 could limit the activity of these signaling proteins and pathways relevant to ADPKD pathology. We performed reverse phase protein array (RPPA) analysis in primary kidney cells isolated from Pkd1−/− mice and treated with STA-2842, a resorcinolic triazole (Fig. S1A) that competitively binds the N-terminal ATP pocket of HSP90, has potency similar to that of the Phase 3 HSP90 inhibitor ganetespib (Fig. S1 B–E) (14), and has limited off-target activity (Figs. S2 and S3). STA-2842 induced significant reductions in the expression or activation of a large number of previously established HSP90 client proteins in Pkd1−/− renal cell lines, including phosphorylated epidermal growth factor receptor (p-EGFR), AKT, and cyclin-dependent kinase 1, as well as their effectors and other proteins implicated in PKD (p-S6, p-ERK, and p-NF-κB) (Fig. 1 B and C, Fig. S4, and Dataset S1). Among the 33 proteins in the overlapping HSP90/PKD network (Fig. 1A), 11 of the 12 present in the RPPA analyte set were confirmed by RPPA analysis to be significantly down-regulated by STA-2842 treatment. Mechanistically, these results implied that HSP90 inhibition would limit multiple critical effectors of mutant Pkd1 or Pkd2 genes simultaneously in vivo, restricting pathogenesis.
Fig. 1.
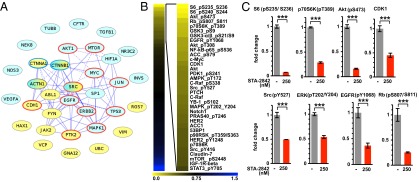
Systematic inhibition of PKD-associated signaling proteins. (A) Network of genes associated with PKD and interacting with HSP90, based on data in ref. 8 and in the databases noted in Materials and Methods. Blue, PKD1 or PKD2 interacting; yellow, associated with the disease ADPKD but not reported to interact with PKD1 or PKD2; red circle, detected by RPPA analysis as down-regulated by STA-2842; blue circle, within RPPA analyte set but not affected by STA-2842 treatment. Solid lines indicate direct protein–protein interactions; dashed lines indicate functional interactions (retrieved from pathway maps). (B) Heatmap indicates protein species identified by RPPA analysis of two independent, early passage isolates of Pkd1−/− kidney cells as showing greatest decrease following treatment with 250 nM STA-2842 versus vehicle for 24 h. Colors represent fold change of protein expression in cells treated with 250 nM STA-2842 compared with vehicle-treated cells as indicated. (C) Quantification of the expression levels of selected proteins based on RPPA analysis. ***P ≤ 0.001; data are expressed as mean ± SEM.
To evaluate this possibility directly, we used an adult mouse model with slow, progressive kidney disease that closely resembles the human disease and allows the analysis of long-term treatment, in contrast to rapid incidence models (discussed in refs. 12 and 15). For this purpose, Pkd1fl/fl;Cre/Esr1+ (hereafter referred to as Pkd1−/−) and control Pkd1fl/fl;Cre/Esr1− mice (12) were injected with tamoxifen at 5–6 wk of age to inactivate the Pkd1 gene; this inactivation leads to the development of cysts starting at 4 mo of age (12). To determine if inhibiting HSP90 could slow the appearance of cysts and other renal pathologies, mice were dosed with STA-2842 (75 mg/kg) weekly from age 6 wk to 4 mo and then every other week from 4 to 6 mo (Fig. 2A). MRI assessment of the appearance of cysts and growth in kidney volume (Fig. 2 B–D and Fig. S5) indicated that STA-2842 significantly reduced cyst formation and kidney growth compared with vehicle-treated animals, which displayed tremendous and variable cystic burden consistent with previous results in this model (12). These results were corroborated by direct measurement of kidney weight (Fig. 2E) and pathological assessment of cystic index (Fig. 2 B and F). Importantly, STA-2842 treatment significantly improved kidney function in Pkd1−/− mice with blood urea nitrogen (BUN) (Fig. 2G) and plasma creatinine (Fig. 2H) at levels comparable to those in WT mice, in contrast to the significantly elevated levels in vehicle-treated Pkd1−/− mice.
Fig. 2.
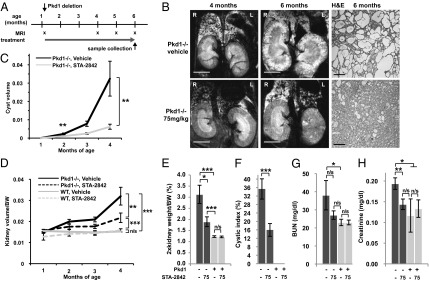
STA-2842 effectively inhibits the early stages of cystogenesis in Pkd1−/− mice. (A) Schedule of dosing and MRI observation of Pkd1−/− and control mice. (B) (Left and Center) MRI images of drug- (Lower) or vehicle-treated (Upper) Pkd1−/− mice typical of the most severe cystic phenotype observed in the treatment group at the indicated time points. (Right) Corresponding H&E-stained kidney sections. (Scale bars: 0.5 cm for MRIs and 200 μm for H&E-stained sections. (C and D) Quantification of (C) cyst volume and (D) ratio of kidney volume in cubic centimeters to body weight (BW) in grams over the term of treatment, based on quantification of MRI images. (E) Effect of STA-2842 on the ratio of kidney:body weight. (F) Cystic index of mice treated with 75 mg/kg STA-2842 compared with vehicle-treated mice. Effect of STA-2842 on BUN (G) and plasma creatinine (H) in Pkd1−/− and control mice. n = 6 for WT mice (exception: for MRI, 4 of 6 WT mice) and n = 16–17 for Pkd1−/− mice. *P ≤ 0.05, **P ≤ 0.01, ***P ≤ 0.005, n/s, not significant. Data are expressed as mean ± SEM.
We next addressed whether inhibiting HSP90 with STA-2842 could reduce the cystic burden in animals with established PKD and also further explored the effective dose range of STA-2842. For this purpose, deletion of Pkd1 was induced as before, but drug treatment was delayed until month 4 and was administered on a weekly schedule for 10 wk (Fig. 3A). Comparable analysis by MRI and immunohistochemistry of mice treated with 50 or 100 mg/kg of STA-2842 showed that STA-2842 treatment delayed the progression of established cysts and limited kidney weight and volume (Fig. 3 B–F and Fig. S6 A and B). For these measures, both dose levels of STA-2842 performed comparably; however, measurement of BUN indicated a dose-dependent response, with 100 mg/kg reducing BUN scores to normal levels (Fig. 3G). Ki-67 analysis indicated that the proliferation rate of cells was higher in the cystic epithelium in adult Pkd1−/− mice than in the renal tubular epithelium of WT mice (4.7% versus undetectable), a finding that is in line with previous reports for this model, and that STA-2842 treatment reduced proliferation by 30% compared with vehicle-treated animals. (Fig. 3H and Fig. S6C). Notably, the proliferation rate showed a highly significant correlation (P = 0.003) with cyst volume across all animal groups, collectively. STA-2842 treatment did not affect animal weight significantly over the course of dosing in either of the study groups (Fig. S7 A and B). No increase in apoptotic index or signs of toxicity were detected in liver sections (Fig. S7C), and liver weight also was reduced by drug treatment (Fig. S7D).
Fig. 3.
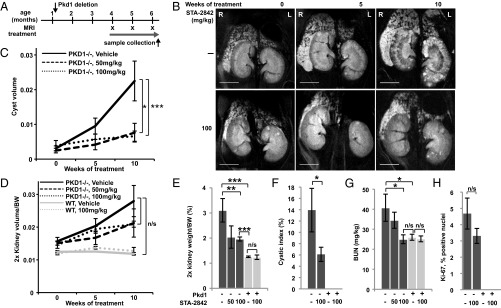
STA-2842 effectively inhibits progression of later stages of cystogenesis and renal growth in Pkd1−/− mice. (A) Schedule of dosing and MRI observation of Pkd1−/− and control mice. (B) Representative MRI images of drug- or vehicle-treated Pkd1−/− mice at the indicated time points (see also Fig. S6 A and B). (Scale bar, 0.5 cm.) (C and D) Quantification of cyst volume (C) and ratio of kidney volume in cubic centimeters to body weight in grams (D), based on MRI imaging. (E) Effect of STA-2842 on kidney: body weight ratio. (F) Cystic index of 100 mg/kg STA-2842 treated mice compared with control mice. (G) Effect of STA-2842 on BUN in Pkd1−/− and control mice. n = 5 for WT mice and n = 6–8 for Pkd1−/− mice (with the only exception that only 3 out of 5 WT mice were used to assess kidney volume based on MRI). (H) Representative kidney sections of Pkd1−/− and control mice treated with 100 mg/kg STA-2842 versus vehicle were stained for Ki-67 (see also Fig. S6C) and quantified. n = 2 WT mice and n = 7 Pkd1−/− mice. *P ≤ 0.05, **P ≤ 0.01, ***P ≤ 0.005, n/s, not significant. Data are expressed as mean +/− SEM.
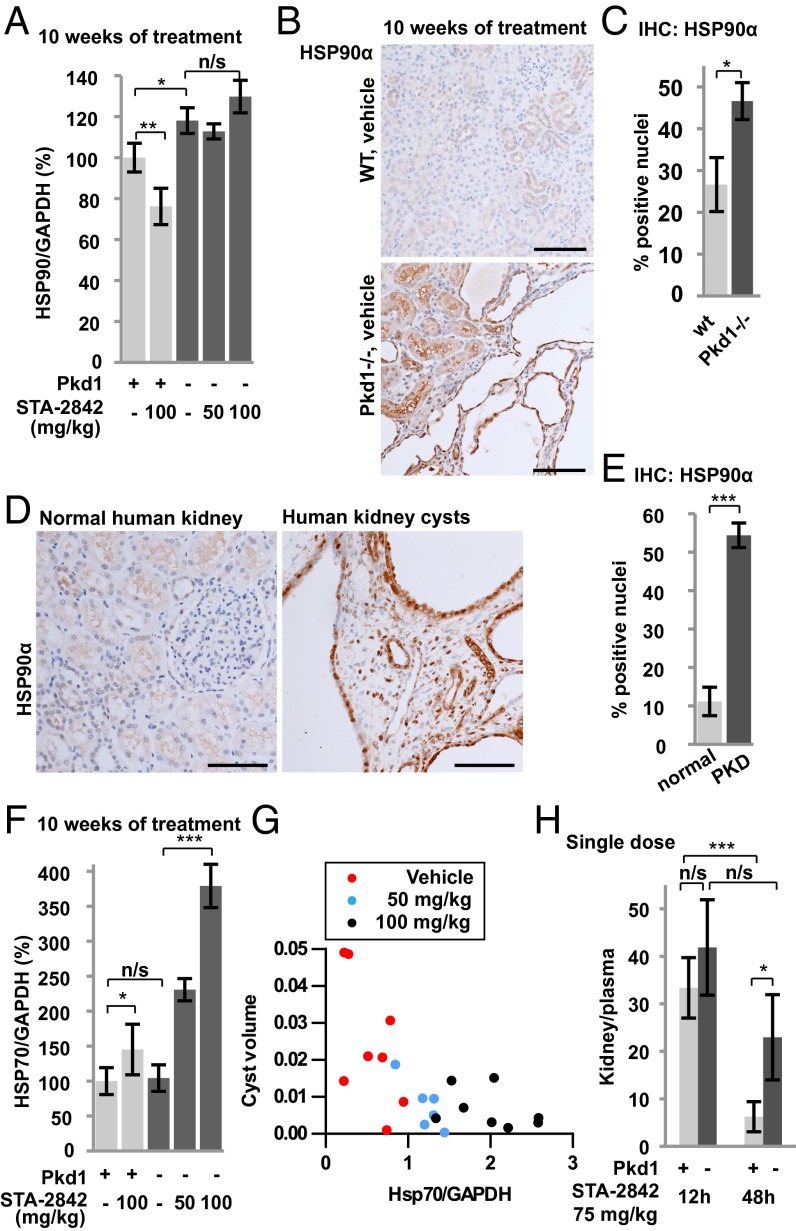
Cancer cells use HSP90 to protect a large set of mutated and overexpressed proteins from misfolding and degradation (16). HSP90 levels are higher in tumors than in normal tissue (e.g., ref. 17), and HSP90 undergoes changes in conformation (18). Together, these differences result in an improved therapeutic window resulting from the concentration of HSP90 inhibitors with their protein target (14). Given the significant anti-cyst activity observed with HSP90 inhibition in the Pkd1−/− animals, we compared the levels of the chaperone in WT and Pkd1−/− animals. Western analysis indicated higher basal levels of HSP90α in Pkd1−/− mouse kidneys than in WT controls (Fig. 4A and Fig. S8A). Elevation of HSP90α was observed specifically in the epithelial cells lining dilated tubules and renal cysts in Pkd1−/− mice (Fig. 4 B and C). Similar elevation of HSP90α was seen in human kidney cysts obtained from PKD patients (Fig. 4 D and E).
Fig. 4.
HSP90α is overexpressed in human and murine PKD-associated kidney cysts. (A) Quantification of expression levels of HSP90α determined from Western analysis; n = 5–8 for each group. (B and C) Immunohistochemical analysis of HSP90α expression in epithelial cells lining dilated tubules and cysts in kidneys from mice of indicated genotypes (B) with quantification index (C); n = 5 for each group. (D and E) Immunohistochemical analysis of HSP90α expression in human kidney tissue from PKD patients (D), with quantification index (E); n = 6–7 for each group. (F) Quantification of expression levels of HSP70 determined from Western analysis; n = 5–8 for each group. (G) Association between cyst volume and HSP70 expression. Dots represent individual mice of the indicated treatment groups. P < 0.001. (H) Ratio of kidney to plasma concentration of STA-2842 12 and 48 h after a single dose of STA-2842 (75 mg/kg) in 5-mo-old female Pkd1−/− and control mice. n = 3 WT mice; n = 5–6 Pkd1−/− mice. *P ≤ 0.05, **P ≤ 0.01, ***P ≤ 0.005; n/s, not significant. Data are expressed as mean ± SEM. (Scale bars, 100 μm.)
Inhibition of HSP90 with ATP competitive inhibitors releases the heat shock factor 1 (HSF-1) transcription factor from the HSP90 complex, resulting in HSF-1–dependent activation of heat shock protein 70 (HSP70) and other heat shock genes (19). We found that levels of HSP70 were comparable under basal conditions in Pkd1−/− and control mice but were elevated fourfold in Pkd1−/− kidney lysates after 10 wk of STA-2842 treatment (Fig. 4F and Fig. S8A). A similar but weaker trend toward elevation of heat shock protein 27 (HSP27) expression in mice treated with 100 mg/kg STA-2842 was observed (Fig. S8 A and B). In individual mice, elevated expression of HSP70 negatively correlated with cyst volume (P < 0.001) (Fig. 4G). These results were compatible with the idea of increased retention of HSP90-targeting drugs in cystic versus normal tissue. Indeed, direct measurement showed a prolonged elevated concentration of STA-2842 in cystic kidney tissue relative to plasma at 48 h after treatment compared with a highly significant reduction of STA-2842 between 12 and 48 h in the control group (Fig. 4H and Fig. S8C).
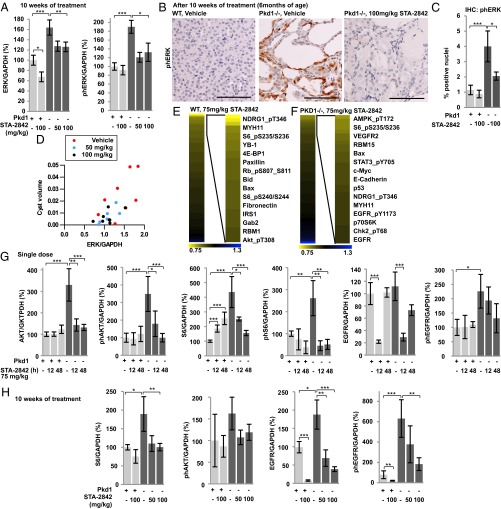
To confirm further the inhibitory actions of STA-2842 on HSP90, we analyzed lysates prepared from the kidneys of Pkd1−/− and control mice treated with 100 mg/kg STA-2842 and assessed the expression and activity of ERK1/2, a canonical PKD1 effector, regulated by multiple HSP90 targets (Fig. 5A and Fig. S8A). Levels of total and activated ERK1/2 were elevated in Pkd1−/− mice receiving vehicle versus control mice but were reduced in Pkd1−/− mice treated with STA-2842 (Fig. 5A). This observation was confirmed by immunohistochemical analysis of renal cysts, which showed ERK1/2 activated in cysts lining epithelia in Pkd1−/− kidney sections but reduced nearly to baseline by STA-2842 treatment (Fig. 5 B and C). Further, statistical analysis of individual Pkd1−/− animals using generalized linear models indicated ERK levels were highly associated with cyst size (P = 0.001) (Fig. 5D).
Fig. 5.
Signaling consequences of short- and long-term inhibition of HSP90 in vivo. (A) Results of total and T202/Y204-phosphorylated-ERK1/2 determined from Western analysis were quantified and normalized to GAPDH; n = 5–8 for each group. (B) Representative photomicrographs of T202/Y204-phosphorylated-ERK1/2 staining of kidney sections and quantification (C); n = 5 WT mice and n = 8 Pkd1−/− mice. (D) Associations between cyst volume and total ERK1/2 expression. Dots represent individual mice of the indicated treatment groups. P = 0.001. (E and F) Heatmap indicates protein species identified by RPPA analysis of kidney lysates of (E) WT or (F) Pkd1−/− mice as showing greatest decrease following treatment with 75 mg/kg STA-2842 versus vehicle for 12 h (n = 4 for each group). Colors represent fold change of protein expression in 75 mg/kg STA-2842– versus vehicle-injected animals. (Full data are in Dataset S1.) (G) Quantification of expression levels of the indicated proteins determined by Western blot analysis in animals receiving a single injection of STA-2842 or vehicle. n = 3 for each WT group and n = 6–7 for each Pkd1−/− group. *P ≤ 0.05, **P ≤ 0.01, ***P ≤ 0.005. Data are expressed as mean ± SEM. (H) Quantification of expression levels of the indicated proteins determined by Western blot analysis in mice injected with 50 or 100 mg/kg STA-2842 or vehicle over a 10-wk period; n = 5–8 for each group.
To explore further and systematically the signaling pathways influenced by HSP90 inhibition in vivo, we again used RPPA analysis to probe kidney lysates from 5-mo-old WT and Pkd1−/−mice 12 h after a single injection of 75 mg/kg STA-2842 or vehicle (Fig. 5 E and F; complete data are given in Dataset S1). Proteins most strongly affected by inhibition of HSP90 included components of the mTOR signaling pathway, 4E-BP1, p70S6K, AKT, GRB2-associated binding protein 2, EGFR, and STAT3 (Fig. S6). The nonequivalent results seen with WT and Pkd1−/− animals likely reflect the different cellular composition of normal versus cystic tissue. Western blot analysis of some of these proteins at 12 or 48 h after single dosing confirmed that the overexpression and elevated activity of AKT, S6, and EGFR in Pkd1−/− versus WT mice were reduced to levels comparable to control after a single-dose exposure to STA-2842 (Fig. 5G and Fig. S8D). Similar results were obtained in mice treated for 10 wk with STA-2842 (Fig. 5H and Fig. S8A), and reduced expression of HSP90 effectors was associated with lower cyst volumes (Fig. S8E).
Discussion
These results demonstrate that HSP90 activity supports cyst formation and growth and provide proof of concept for the use of HSP90 inhibitors in treating ADPKD. Importantly, the impact of HSP90 inhibition was observed at both early and late stages of cyst development and was accompanied by HSP70 induction and reduced activity of HSP90 clients and their effector, ERK, which are biomarkers for HSP90 inhibition. Both in primary kidney cells and in the kidneys of Pkd1−/− mice, STA-2842 treatment down-regulates a broad range of HSP90 clients and effectors that mediate the pathological changes that occur in ADPKD. Encouragingly, STA-2842 concentrates specifically in the cystic kidney. This effect likely reflects the elevated expression of HSP90 in epithelial cells lining dilated tubules and cysts during cystogenesis, which parallels the elevation of HSP90 in the more commonly studied conditions of pathological cell growth, such as the formation of solid tumors (14). However, it also may reflect an altered conformation of HSP90 and the formation of a complex between HSP90 and other cochaperones, resulting in a protein that binds its inhibitor more actively (18). Although STA-2842 currently is at the stage of preclinical development, it is part of a panel of second-generation HSP90 inhibitors that includes ganetespib, which generally has been well tolerated in more than 700 cancer patients treated to date, with some patients on treatment for more than 2 y (20). Although in cancer treatment HSP90 inhibitors act as sensitizers in combination therapies with chemotherapeutics or as a single agent in tumors driven by a specific mutation, there also is a growing body of evidence for activity in chronic inflammatory and neurodegenerative disease (21–23). Subsequent analysis of STA-2842 should include a longer course of drug administration in additional models for ADPKD, accompanied by thorough evaluation of pharmacokinetics, pharmacodynamics, and potential toxicities. To the extent that HSP90 inhibitors can find additional use in treatment of ADPKD and other diseases currently lacking efficient management strategies, this approach could yield significant benefit to general public health.
Materials and Methods
Mouse Strains and Drug Treatment.
All experiments involving mice were approved by the Institutional Animal Care and Use Committee of Fox Chase Cancer Center. Conditional Pkd1−/− mice using the Cre-flox regulatory system for targeted inactivation of the Pkd1 gene in vivo were kindly provided by Gregory Germino (National Institute of Diabetes and Digestive and Kidney Diseases, National Institutes of Health, Bethesda, MD) (12, 15). Pkd1fl/fl;Cre/Esr1+ (herein referred to as Pkd1−/−) and control (Pkd1fl/fl;Cre/Esr1−) mice were injected intraperitoneally with tamoxifen (250 mg/kg body weight, formulated in corn oil) on two sequential postnatal days (P37 and P38) to induce Pkd1 deletion in the test group. Both male and female animals were used for all experiments, and comparable experimental results were obtained with each sex.
The HSP90 inhibitor STA-2842 is fully synthetic (unlike the ansamycin inhibitors such as 17-AAG), has a low molecular weight, and lacks the benzoquinone moiety responsible for the liver toxicity associated with many other HSP90 inhibitors. For details about drug formulation, dosage, and treatment schedule, see SI Materials and Methods.
Tissue Preparation, Histology, Immunohistochemical Analysis, Cystic Index, and BUN.
Immunohistochemistry was performed by standard protocols; details of procedures and antibodies are provided in SI Materials and Methods. Immunostained slides were scanned using an Aperio ScanScope CS scanner (Aperio). Scanned images then were viewed with Aperio's image viewer software (ImageScope). Selected regions of interest were outlined manually by a pathologist (K.Q.C.). Expression levels of pERK and Hsp90α were measured in the kidney cortex using the Aperio Positive Pixel Count V9 algorithm, and the proliferative index (ki-67) was quantified using the Aperio Nuclear V9 algorithm. For cystic index analysis, a grid was placed over representative images of H&E-stained kidney sections, and the cystic index was calculated as the percentage of grid intersection points that bisected cystic or noncystic areas, as described previously (5). BUN and plasma creatinine levels were determined by using a clinical laboratory service (ANTECH Diagnostics, www.antechdiagnostics.com).
Fox Chase Cancer Center Institutional Review Board consent was obtained for the use of human tissue samples, sections of formalin-fixed, paraffin-embedded kidney tissue from either normal human kidneys or from patients diagnosed with ADPKD and archived at the National Disease Resource Interchange (as described in ref. 24). Information about PKD1 versus PKD2 mutational status is unavailable, but, based on disease prevalence, the majority of the cases likely reflect mutations in PKD1. Samples analyzed were obtained from eight independent patients.
Primary Kidney Cells, Cell Culture, and Drug Treatment.
Primary epithelial kidney cells were derived from Pkd1−/− and WT mice at age 10 d and were maintained in low-calcium medium containing 5% (vol/vol) chelated horse serum. These cell populations were not immortalized to avoid oncogene-associated changes in signaling pathways, and only cells between passages 3 and 8 were used for experiments. Cell viability was quantified using the alamarBlue Assay 72 h after the indicated drug treatment.
Protein Expression Analysis Using RPPAs and Western Blotting.
Cells were treated with 250 nM STA-2842 or STA-9090 for 24 h and then were harvested and lysed. Mouse kidneys used in the experiments described above were fresh frozen and lysed for analysis by Western blot or RPPA as previously described (25, 26). Data were visualized using the MultiExperiment Viewer (MeV) program (www.tm4.org/mev/). Western blotting, and signal visualization were performed by standard protocols; details of procedures and antibodies are provided in SI Materials and Methods.
Supplementary Material
Acknowledgments
We thank Jennifer Cracchiolo, Sonya Wexler, Zachary Smithline, Samantha Hurley, Anthony Lerro, Andres Klein-Szanto, Petr Makhov, and Luisa Shin Ogawa for technical assistance with data generation for this study; Gregory Germino (National Institute of Diabetes and Digestive and Kidney Diseases) for providing mice; the National Resource Center for providing with human PKD tissue; and Catherine and Peter Getchell and the Bucks County Chapter of the Fox Chase Board of Associates for financial support. This work was supported further by National Institutes of Health (NIH) Grant R01 CA63366, Department of Defense Peer Reviewed Medical Research Program Grant W81XWH-12-1-0437/PR110518, and the Fox Chase Kidney Keystone program (to E.A.G.), by the German Research Foundation Grant SE2280/1 (to T.S-N.), and by NIH Core Grant CA06927 (to the Fox Chase Cancer Center).
Footnotes
The authors declare no conflict of interest.
This article is a PNAS Direct Submission.
This article contains supporting information online at www.pnas.org/lookup/suppl/doi:10.1073/pnas.1301904110/-/DCSupplemental.
References
- 1.Harris PC, Torres VE. Polycystic kidney disease. Annu Rev Med. 2009;60:321–337. doi: 10.1146/annurev.med.60.101707.125712. [DOI] [PMC free article] [PubMed] [Google Scholar]
- 2.Grantham JJ, Nair V, Winklhoffer F. Cystic diseases of the kidney. In: Brenner BM, editor. Brenner & Rector's The Kidney. Vol 2. Philadelphia: WB Saunders; 2000. pp. 1699–1730. [Google Scholar]
- 3.Torres VE, Harris PC. Mechanisms of Disease: Autosomal dominant and recessive polycystic kidney diseases. Nat Clin Pract Nephrol. 2006;2(1):40–55, quiz 55. doi: 10.1038/ncpneph0070. [DOI] [PubMed] [Google Scholar]
- 4.Sweeney WE, Jr, von Vigier RO, Frost P, Avner ED. Src inhibition ameliorates polycystic kidney disease. J Am Soc Nephrol. 2008;19(7):1331–1341. doi: 10.1681/ASN.2007060665. [DOI] [PMC free article] [PubMed] [Google Scholar]
- 5.Shillingford JM, et al. The mTOR pathway is regulated by polycystin-1, and its inhibition reverses renal cystogenesis in polycystic kidney disease. Proc Natl Acad Sci USA. 2006;103(14):5466–5471. doi: 10.1073/pnas.0509694103. [DOI] [PMC free article] [PubMed] [Google Scholar]
- 6.Astsaturov I, et al. Synthetic lethal screen of an EGFR-centered network to improve targeted therapies. Sci Signal. 2010;3(140):ra67. doi: 10.1126/scisignal.2001083. [DOI] [PMC free article] [PubMed] [Google Scholar]
- 7.Berns K, et al. A functional genetic approach identifies the PI3K pathway as a major determinant of trastuzumab resistance in breast cancer. Cancer Cell. 2007;12(4):395–402. doi: 10.1016/j.ccr.2007.08.030. [DOI] [PubMed] [Google Scholar]
- 8.Taipale M, et al. Quantitative analysis of HSP90-client interactions reveals principles of substrate recognition. Cell. 2012;150(5):987–1001. doi: 10.1016/j.cell.2012.06.047. [DOI] [PMC free article] [PubMed] [Google Scholar]
- 9.Porter JR, Fritz CC, Depew KM. Discovery and development of Hsp90 inhibitors: A promising pathway for cancer therapy. Curr Opin Chem Biol. 2010;14(3):412–420. doi: 10.1016/j.cbpa.2010.03.019. [DOI] [PubMed] [Google Scholar]
- 10.Grantham JJ. Polycystic kidney disease: Neoplasia in disguise. Am J Kidney Dis. 1990;15(2):110–116. doi: 10.1016/s0272-6386(12)80507-5. [DOI] [PubMed] [Google Scholar]
- 11.Taipale M, Jarosz DF, Lindquist S. HSP90 at the hub of protein homeostasis: Emerging mechanistic insights. Nat Rev Mol Cell Biol. 2010;11(7):515–528. doi: 10.1038/nrm2918. [DOI] [PubMed] [Google Scholar]
- 12.Piontek K, Menezes LF, Garcia-Gonzalez MA, Huso DL, Germino GG. A critical developmental switch defines the kinetics of kidney cyst formation after loss of Pkd1. Nat Med. 2007;13(12):1490–1495. doi: 10.1038/nm1675. [DOI] [PMC free article] [PubMed] [Google Scholar]
- 13.Torres VE, Harris PC. Autosomal dominant polycystic kidney disease: The last 3 years. Kidney Int. 2009;76(2):149–168. doi: 10.1038/ki.2009.128. [DOI] [PMC free article] [PubMed] [Google Scholar]
- 14.Ying W, et al. Ganetespib, a unique triazolone-containing Hsp90 inhibitor, exhibits potent antitumor activity and a superior safety profile for cancer therapy. Mol Cancer Ther. 2012;11(2):475–484. doi: 10.1158/1535-7163.MCT-11-0755. [DOI] [PubMed] [Google Scholar]
- 15.Piontek KB, et al. A functional floxed allele of Pkd1 that can be conditionally inactivated in vivo. J Am Soc Nephrol. 2004;15(12):3035–3043. doi: 10.1097/01.ASN.0000144204.01352.86. [DOI] [PubMed] [Google Scholar]
- 16.Neckers L. Hsp90 inhibitors as novel cancer chemotherapeutic agents. Trends Mol Med. 2002;8(4) Suppl:S55–S61. doi: 10.1016/s1471-4914(02)02316-x. [DOI] [PubMed] [Google Scholar]
- 17.Cheng Q, et al. Amplification and high-level expression of heat shock protein 90 marks aggressive phenotypes of human epidermal growth factor receptor 2 negative breast cancer. Breast Cancer Res. 2012;14(2):R62. doi: 10.1186/bcr3168. [DOI] [PMC free article] [PubMed] [Google Scholar]
- 18.Trepel J, Mollapour M, Giaccone G, Neckers L. Targeting the dynamic HSP90 complex in cancer. Nat Rev Cancer. 2010;10(8):537–549. doi: 10.1038/nrc2887. [DOI] [PMC free article] [PubMed] [Google Scholar]
- 19.Zou J, Guo Y, Guettouche T, Smith DF, Voellmy R. Repression of heat shock transcription factor HSF1 activation by HSP90 (HSP90 complex) that forms a stress-sensitive complex with HSF1. Cell. 1998;94(4):471–480. doi: 10.1016/s0092-8674(00)81588-3. [DOI] [PubMed] [Google Scholar]
- 20.Socinski MA, et al. A multicenter Phase II study of ganetespib monotherapy in patients with genotypically-defined advanced non-small cell lung cancer. Clin Cancer Res. 2013;19(11):3068–3077. doi: 10.1158/1078-0432.CCR-12-3381. [DOI] [PMC free article] [PubMed] [Google Scholar]
- 21.Luo W, et al. Roles of heat-shock protein 90 in maintaining and facilitating the neurodegenerative phenotype in tauopathies. Proc Natl Acad Sci USA. 2007;104(22):9511–9516. doi: 10.1073/pnas.0701055104. [DOI] [PMC free article] [PubMed] [Google Scholar]
- 22.Luo W, Sun W, Taldone T, Rodina A, Chiosis G. Heat shock protein 90 in neurodegenerative diseases. Mol Neurodegener. 2010;5:24. doi: 10.1186/1750-1326-5-24. [DOI] [PMC free article] [PubMed] [Google Scholar]
- 23.Shimp SK, 3rd, et al. Heat shock protein 90 inhibition by 17-DMAG lessens disease in the MRL/lpr mouse model of systemic lupus erythematosus. Cell Mol Immunol. 2012;9(3):255–266. doi: 10.1038/cmi.2012.5. [DOI] [PMC free article] [PubMed] [Google Scholar]
- 24.Plotnikova OV, Pugacheva EN, Golemis EA. Aurora A kinase activity influences calcium signaling in kidney cells. J Cell Biol. 2011;193(6):1021–1032. doi: 10.1083/jcb.201012061. [DOI] [PMC free article] [PubMed] [Google Scholar]
- 25.Iadevaia S, Lu Y, Morales FC, Mills GB, Ram PT. Identification of optimal drug combinations targeting cellular networks: Integrating phospho-proteomics and computational network analysis. Cancer Res. 2010;70(17):6704–6714. doi: 10.1158/0008-5472.CAN-10-0460. [DOI] [PMC free article] [PubMed] [Google Scholar]
- 26.Acquaviva J, et al. Targeting KRAS-mutant non-small cell lung cancer with the Hsp90 inhibitor ganetespib. Mol Cancer Ther. 2012;11(12):2633–2643. doi: 10.1158/1535-7163.MCT-12-0615. [DOI] [PubMed] [Google Scholar]
Associated Data
This section collects any data citations, data availability statements, or supplementary materials included in this article.


