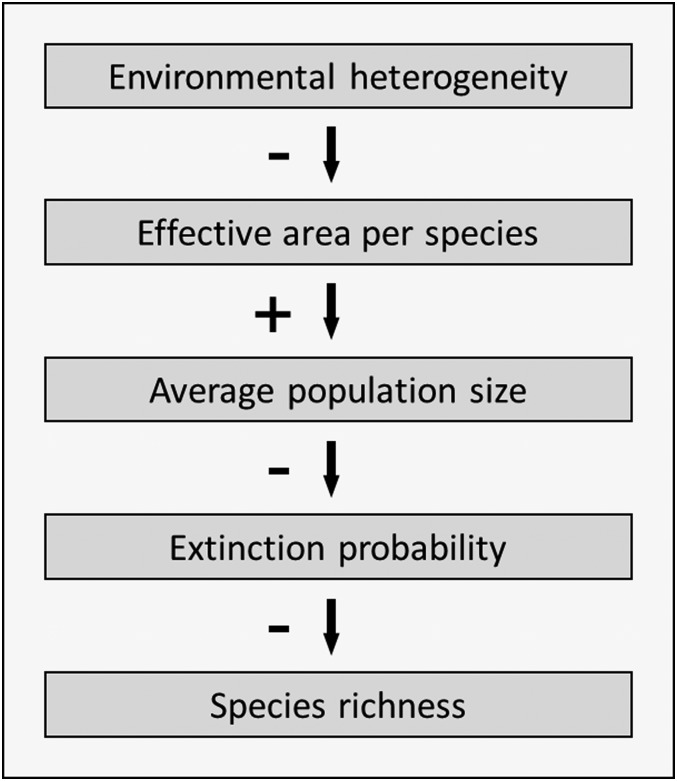
The area-heterogeneity tradeoff (AHTO) implies that increasing environmental heterogeneity reduces the amount of effective area available for individual species (ref. 1 and Fig. 1). Theoretical models show that this tradeoff leads to a positive effect of heterogeneity on extinction rates and a unimodal effect on species richness (1–3). Our analysis of bird distribution in Catalonia using altitude range as a measure of heterogeneity (3) was consistent with both predictions.
Fig. 1.
Main mechanisms of the AHTO. The population size of a species and its extinction risk are affected by the amount of suitable habitat available in the study area (the effective area). As heterogeneity increases, the proportion of some habitats might increase, but the average area of habitats decreases, leading, on average, to increased risk of extinction and a related decrease in species richness.
Carnicer et al. (4) argue that our results were largely driven by differences in sampling effort. However, in the supporting information appendix of ref. 3, we demonstrate that correcting for sampling effort did not change the observed patterns and that even if all sites with differences in sampling effort (50% of the data) were removed from the analysis, all patterns remained highly significant (supporting information appendix, figures S1 and S2 and tables S4–S6 in ref. 3). Carnicer et al. report that a model combining the effects of altitude range and sampling effort on extinction rates reduces the significance level of altitude range to 0.067, but such analysis ignores the potential effects of spatial autocorrelation and confounding factors like temperature and elevation, which were found to affect species distribution in the area (3). When such factors are incorporated in the analysis, the effect of altitude range is highly significant (Table 1).
Table 1.
Results of a simultaneous autoregressive (SAR) model explaining extinction rates of breeding birds in Catalonia
| Variable | t | P |
| Constant | 1.95 | 0.052 |
| x | −2.372 | 0.018 |
| y | −1.942 | 0.053 |
| x2 | −0.983 | 0.326 |
| xy | 2.352 | 0.019 |
| E2 | −1.47 | 0.143 |
| T2 | 2.08 | 0.038 |
| ΔSE | −11.82 | <0.001 |
| H | 3.123 | 0.002 |
Results of a SAR model for the effect of altitude range (H), the difference in sampling effort between the two periods (ΔSE), geographical coordinates (x, y, x2, y2, xy), mean absolute elevation (E), mean annual temperature (T), mean annual rainfall (R), and their squared values (E2, T2, and R2) on extinction rates of breeding birds in Catalonia. See ref. 2 for calculation of the environmental variables. Variables shown are those selected by the best model from all possible combinations of the independent variables using the Akaike information criterion. Accounting for spatial autocorrelation in the data using a binary connectivity matrix with a threshold distance of 30 km improved R2 from 0.453 to 0.579. Note the significant positive effect of altitude range on extinction risk, even when the effect of sampling effort is included in the analysis. Ordinary least squares: R2 = 0.453; SAR: R2 = 0.579.
Carnicer et al. (4) also claim that our results might be biased by nonrandom distribution of habitats along the heterogeneity gradient. To support this claim, they show that different groups of species respond differently to heterogeneity, depending on the relative abundance of their preferred habitats along the heterogeneity gradient (figure 1 in ref. 4). In fact, this result supports rather than contradicts the AHTO. The AHTO predicts that different groups of species should show different responses to heterogeneity depending on the availability of their preferred habitats (“effective” area), and the results presented by Carnicer et al. are fully consistent with this prediction (Fig. 1).
The AHTO predicts that responses of species richness to heterogeneity should depend on niche width of the component species. In general, negative responses are predicted for species characterized by very narrow niches, unimodal responses for species with intermediate niche widths, and positive responses for species with very broad niches (3). Carnicer et al. (4) categorize species into specialists vs. generalists based on their preference to forest vs. open habitats and find that responses of the different groups to altitude range do not match this prediction. However, when testing the predictions of the AHTO, one should use the same variable to quantify environmental heterogeneity and niche width. Carnicer et al. quantified niche width using the preference of species to forest vs. open habitats and environmental heterogeneity using altitude range, which makes the interpretation of their results difficult.
The AHTO is a fundamental geometric constraint with important ecological implications (Fig. 1). However, empirical tests of its predictions require extra care because of spatial autocorrelation and the potential correlation of heterogeneity with environmental factors. We hope this correspondence will facilitate and improve future studies designed to test these predictions.
Footnotes
The authors declare no conflict of interest.
References
- 1.Kadmon R, Allouche O. Integrating the effects of area, isolation, and habitat heterogeneity on species diversity: A unification of island biogeography and niche theory. Am Nat. 2007;170(3):443–454. doi: 10.1086/519853. [DOI] [PubMed] [Google Scholar]
- 2.Allouche O, Kadmon R. A general framework for neutral models of community dynamics. Ecol Lett. 2009;12(12):1287–1297. doi: 10.1111/j.1461-0248.2009.01379.x. [DOI] [PubMed] [Google Scholar]
- 3.Allouche O, Kalyuzhny M, Moreno-Rueda G, Pizarro M, Kadmon R. Area–heterogeneity tradeoff and the diversity of ecological communities. Proc Natl Acad Sci USA. 2012;109(43):17495–17500. doi: 10.1073/pnas.1208652109. [DOI] [PMC free article] [PubMed] [Google Scholar]
- 4.Carnicer J, Brotons L, Herrando S, Sol D. Improved empirical tests of area-heterogeneity tradeoffs. Proc Natl Acad Sci USA. 2013;110:E2858–E2860. doi: 10.1073/pnas.1222681110. [DOI] [PMC free article] [PubMed] [Google Scholar]


