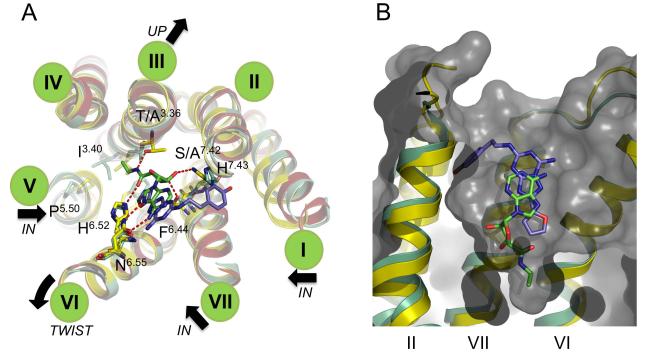
Figure 9. Activation mechanism of the adenosine A2A receptor.
(a) Close-up of the ligand binding sites of the A2AR structures superposed and coloured as in Figure 8 (ECL regions have been omitted for clarity). Only the ZM241385 and NECA ligands are shown in blue and green stick representation respectively. Specific hydrogen bonds made between A2AR-GL31 and NECA are marked as dashed red lines. Residues implicated in ligand binding and transmission of conformational changes through the receptor are labelled and only shown for 3PWH and 2YDV. Transmembrane helices are denoted by green discs. The black arrows show transmembrane helical movements occurring upon activation. In summary, agonist binding leads to inward shifts of TM1, 5 and 7, an upward movement (towards the extracellular side of the receptor) of TM3 and a rigid body rotation of TM4. (b) Superposition of A2AR-GL31-NECA (yellow cartoon and ligand in green stick representation) and A2A-StaR2-ZM241385 (green cartoon and ligand in blue stick representation) TM’s 2, 6 and 7 labelled. Only the A2AR-GL31 is depicted as a grey surface, cut away to reveal the NECA agonist binding deeper in the receptor ligand binding pocket compared to the ZM241385 inverse agonist.

