

Abstract
There are many ways to present antigens to the immune system. We have used a repetitive antigen display technology that relies on the self-assembly of 60 protein chains into a spherical self-assembling protein nanoparticle (SAPN) to develop a vaccine against Plasmodium falciparum malaria. The protein sequence contains selected B- and T-cell epitopes of the circumsporozoite protein of P. falciparum (PfCSP) and, when assembled into a nanoparticle induces strong, long-lived and protective immune responses against the PfCSP. Here we describe the conditions needed for promoting self-assembly of a P. falciparum vaccine nanoparticle, PfCSP-KMY-SAPN, and note pitfalls that may occur when determining conditions for other SAPN vaccines. Attention was paid to selecting processes that were amenable to scale up and cGMP manufacturing.
Keywords: malaria, nanoparticles, vaccine, P. falciparum, circumsporozoite protein
1.0 Introduction
Over the past few years we have reported the use of a repetitive antigen display vaccine construct that was made by the self-assembly of 60 copies of a uniquely designed protein into spherical particles of about 40 nm in diameter [1–4]. The protein contains a sequence of amino acids that, under the correct conditions, form strong, rigid trimeric and pentameric coiled-coil domains separated by a flexible linker region [5]. These coiled coils formed the scaffold of the final SAPN. In one such particle, PfCSP-KMY-SAPN, we incorporated four units (NANP)4 of the repeat region of PfCSP as the B-cell epitope, the pan-allelic CD4+ T-cell epitope PADRE (AKFVAAWTLKAAA) [6], and three different PfCSP CD8+ T-cell epitopes (KPKDELDY, MPNDPNRNV, YLNKIQNSL) into the protein sequence (Fig. 1). The protein chain contains only 147 amino acids with a relative molecular weight (MWr) of 17.23 kDa and a pI of 7.03. After refolding, the B-cell and the CD8+ T-cell epitopes are displayed on the surface of the particle while the CD4+ T-cell epitope PADRE is engineered into the core of the particle and hence is internal [2]. The nanoparticle served as a repetitive antigen display delivery platform that induced strong humoral and CD8+ T-cell immune responses in mice. This protected them from an otherwise lethal sporozoite challenge of live transgenic P. berghei parasites expressing the full-length P. falciparum CSP [2].
Figure 1.

The color coding of the amino acid sequence of PfCSP-KMY-SAPN identifies unique regions of the protein. The pentameric (green) and trimeric (blue) oligomeric domains form 5-stranded and 3-stranded coiled coils, respectively, which serve as the scaffold of the nanoparticle. Presented in an ordered array are B-cell (red) and CD8 T-cell (orange) epitopes of the P. falciparum CSP.
In order to make a vaccine that can be administered to humans, certain biological criteria and scalability in manufacturing issues have to be addressed. For example, the uses of the penicillin-based antibiotics and animal product-based media components have to be avoided during growth. Likewise, all protein purification, particle refolding, and concentration protocols need to allow scale-up in manufacturing while at the same time maintaining final costs at a minimum. Finally, long term storage and stability issues have to be addressed.
Here, we provide detailed experimental methods of our work with the PfCSP-KMY-SAPN, in order to develop a scalable process to manufacture a vaccine capable of being used in human volunteers. Not all SAPNs will refold or purify under the same conditions. As amino acids in the scaffold or in the epitopes are changed, the ionic strength and pH requirements needed to correctly assemble monomers into particles will change as well. The methods outlined here will address how to determine those refolding conditions and how to monitor the effects of those changes. Scalability and cost will be considered as transition occurs to cGMP manufacturing.
2. Description of methods
2.1 Plasmid transformation
Clone the gene sequence needed to express the nanoparticle protein monomer into the plasmid pET24 and transform it into Escherichia coli strain BL21(DE3) Tuner strain cells following the manufacturer’s recommendations (Novagen, EMD Chemicals Inc.). Transformants are selected on Luria Broth (LB) medium agar plates containing kanamycin sulfate (50 µg/mL). The amino acid sequence encoding the protein used in this study, PfCSP-KMY-SAPN, is given in Fig. 1.
2.2 Protein expression
Multiple individual bacterial colonies from the transformation agar plate are selected, streaked on master plates and grown to check for protein expression levels.
Add 10 mL LB medium and kanamycin sulphate (50 µg/mL final concentration) in four different cell culture tubes. Inoculate each tube with a different medium sized colony from the selection LB agar plate. Grow the cultures overnight in a shaker (Gyromax 767r, Amerex Instruments, Inc.) at 37°C and 180 rpm.
Inoculate four new individual cell culture tubes containing 9 mL of LB medium and kanamycin sulphate with 1 mL overnight cultures (10% v/v). Check the Optical Density (OD) at 600 nm (OD600) of the individual cultures every 30–60 min so as not to miss the bacterial concentration point at which to induce the culture at an OD600 = 0.8. Before induction collect a non-induced sample (500 µL) and store on ice. Induce the cultures with isopropyl β-D-1-thiogalactopyranoside (IPTG) (0.3mM final concentration). After 2 hrs of induction place the tubes on ice. Remove 500 µL from each culture and centrifuge at 9000×g for 1 min. Re-suspend the cell pellet in 50 µl of TES buffer (50 mM Tris-HCl, 5 mM EDTA, 5 mM NaCl, pH 8.0) and then place the tightly capped tubes in a boiling water bath for 10 min.
Spin the tubes for 10 min at 9000×g. Avoiding viscous DNA at the bottom of the tube remove from the top15 µL of sample to a new microfuge tube and add 50 µL SDS-PAGE loading buffer. Heat at 80°C for 10 min. Analyze 15 µL of each sample by SDS-PAGE. High protein expression cultures can be identified (Fig. 2.). From this analysis select the best culture. Go back to original pick master plates. Make frozen stocks before proceeding.
Figure 2.
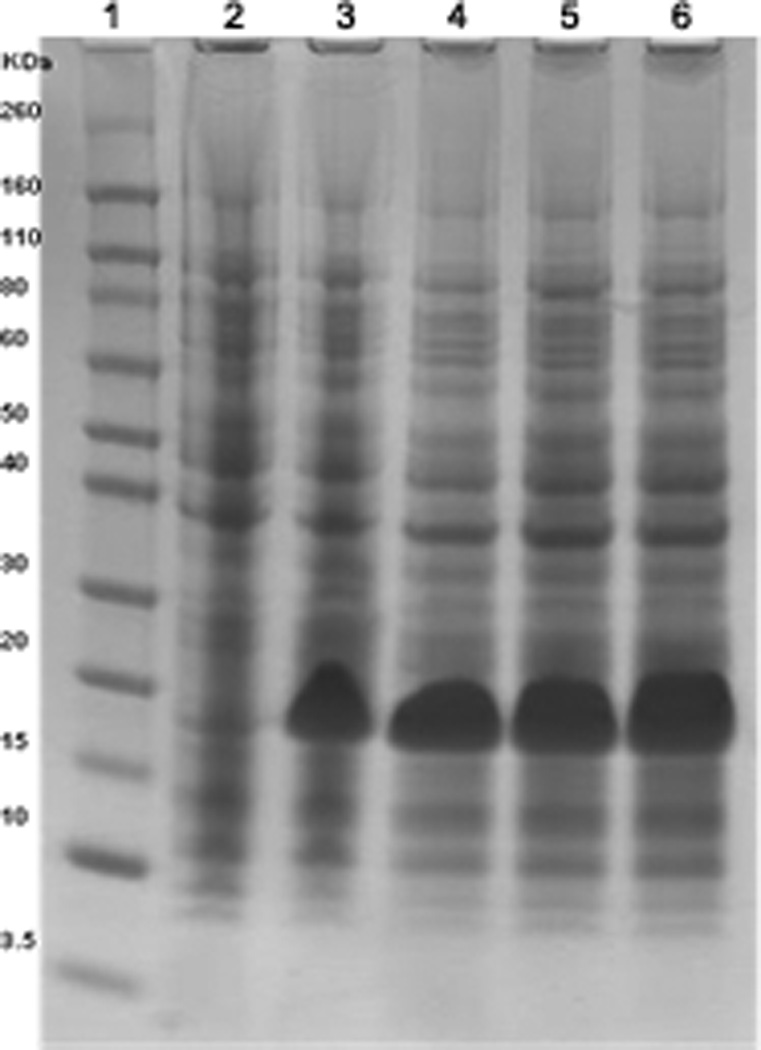
Coomassie Blue stained SDS-PAGE of total cell lysate of four different colonies picked from transformation of BL-21 (DE3) cells. Lane 1: MWr markers. Lane 2: uninduced culture. Lanes 3 to 6: four separately induced cultures. A high protein expression band is seen at 17.2 KDa.
2.3. Cell culture – fermentation
Cells are grown in fermentors to obtain higher yields than can be obtained in shake flasks. The bacterial cell culture are first grown in a 1.5 L fermentor and then scaled up to a 10 L fermentor (New Brunswik Scientific & Co., Bioflow 310).
Batch Fermentation: Autoclave the growth medium in the fermentor with a ~30% head space. Attach the fermentor to the system and maintain rotor agitation at 200 rpm, temperature at 37°C, air inflow at 100%, and adjust and maintain to pH 7.3 using 1 M phosphoric acid and 2 N sodium hydroxide. Once the above parameters are obtained, add kanamycin sulphate (final 50 µg/mL), antifoam 204-Sigma Aldrich (1 mL/L) and inoculate the medium with a shake flask seed culture (10% v/v). Monitor the OD600 and induce the culture in the late log phase with IPTG (0.3 mM final concentration). After 2 hrs of induction, harvest cells by centrifuging the culture at 9000xg, 4°C for 30 min. The cell paste is stored at −80°C in plastic ziplock freezer bags until further use. This allows small sections to be broken off and weighed so downstream processing buffer volumes can be proportionately equated to wet cell paste weight.
2.4. Cell culture – determination of growth medium
Because the final vaccine product is intended for use in humans potential prion protein containing animal-based media has to be avoided. Therefore, the transformed E.coli is tested for growth in various plant-based culture mediums. Media were compared on the basis of the highest cell density obtained, time taken for cell growth, protein yield and cost (Table 1).
Cells were grown in a fermentor (Batch Method - 1.5L) in Hyper Broth (HB), Superior Prime Broth (SPB), Turbo Prime Olate (TPO), Turbo Prime Broth (TPB), Power Broth (PB) or Super Broth-Alternate Protein Source (SB-APS). The growth curve was determined for each plant-based medium (Table 1). Induced culture samples were collected and compared by using SDS-PAGE to check protein yield (Fig. 3).
Table 1.
Comparison of Different Growth Media
| Growth Medium | Hyper Broth |
Turbo Prime Broth |
Power Broth |
Super Broth- Alternate Protein Source |
Superior Prime Broth |
Turbo Prime Olate |
|---|---|---|---|---|---|---|
| Primary Carbon Source | Glucose | Glycerol | Glycerol | Glycerol | Glucose | Glycerol |
| Autoclavable | Partially | Yes | Yes | Yes | Yes | No |
| Animal Product Free | Yes | Yes | Yes | Yes | Yes | Yes |
| Cost for 10 L media | $36.49 | $52.36 | $56.00 | $49.69 | $38.50 | $60.99 |
| Batch Fermentation | ||||||
| Maximum O.D. reach in log phase | 4.1 | 4.43 | 3.8 | 4.62 | 2.5 | 1.5 |
| Time (hr) taken to reach maximum O.D. | 6.5 | 6 | 7.5 | 6.5 | 4.5 | 4 |
| Protein Expression | Low | High | High | High | High | High |
Figure 3.

Coomassie Blue stained SDS-PAGE of total cell lysate of induced BL21 (DE3) tuner cell cultures in different animal product free growth mediums (in duplicates). All culture samples were taken and diluted to an OD600 = 1. Lanes 1, 12: MWr marker. Lanes 2, 3: Hyper Broth. Lanes 4, 5: Turbo Prime Broth. Lanes 6, 7: Turbo Prime Olate. Lanes 8, 9: Super Broth. Lanes 10, 11: Superior Prime Broth. Lanes 13, 14: Power Broth.
2.5. Cell cracking
It is important to keep the protein in denaturing buffer conditions that prevent self-assembly. Initial cracking buffer contains 6 M guanidine hydrochloride and more downstream processes contain 8 M urea.
Resuspend 2 g (wet cell paste weight) of the E. coli pellet in 50 ml of Extraction Buffer (6 M Guanidine hydrochloride, 20 mM Tris-HCl, 100 mM NaH2PO4, pH 8.0). It is important to resuspend the bacterial pellet completely, especially if it has been frozen. For small amounts a hand-operated dounce homogenizer works well, but for larger amounts of cells an IKA T-50 Ultra-Turrax Homogenizer is used.
To break or crack bacterial cells sonication works well for small test samples. A more reliable and scalable cracking of cells is done with a microfluidizer (Microfluidizer Corp., Microfluidizer 110Y) keeping the ratio of wet cell pellet weight to Extraction Buffer constant (1 g/25 mL). Crack the cells by passing the sample twice through the microfluidizer at 800 psi. Collect the cracked cell suspension in a flask on ice. Centrifuge the sample at 20000×g, 4°C for 30 min. Store the supernatant on ice and discard the cell debris pellet.
2.6. Initial protein purification by Ni-NTA
Nickel affinity resin (Ni-NTA) and ion exchange resin (SP-Sepharose) containing columns are attached to an AKTA purifier FPLC (GE Healthcare) and the purification processes are monitored by the UV absorption of the protein at OD280 using the Unicorn software.
Pack a Triton X-10 column (GE Healthcare) with 5 ml Ni-NTA fast flow resin. Run at a flow rate of 5ml/min, and maintain pressure below 10 psi. Equilibrate the column with 6 column volumes (CV) of Ni-Buffer A (8 M urea, 20 mM Tris-HCl, 100 mM NaH2PO4, 10 mM imidazole, pH 8.0). Add imidazole (final 10 mM) to the cell lysate supernatant and load the sample onto the column at 3 mL/min.
To reduce non-specific binding, wash the column sequentially with 6 CV of Ni-Buffer A followed by 10 CV of Ni-Buffer B (8 M urea, 20 mM Tris-HCl, 100 mM NaH2PO4, 50 mM imidazole, pH 8.0), then 10 CV of Ni-Buffer C (8 M urea, 100 mM NaH2PO4, pH 6.0). Elute the linear protein with Ni-Buffer D (8 M urea, 20 mM Tris-HCl, 100 mM NaH2PO4, 250 mM imidazole, pH 8.0). Follow the elution of the monomeric protein and check for purity using SDS-PAGE (Fig. 4).
Figure 4.

Purification profile of PfCSP-KMY-SAPN by SDS-PAGE. Nickel-NTA Column Purification. Lane 1: MWr markers. Lane 2: non-specifically bound impurities washed out by Nickel-Buffer B, Lanes 3 to 7: protein eluted by Nickel-Buffer D. SP Column Purification. Lane 8: flow through of SP column, SP-Buffer A at pH 6. Lanes 9 to 12: elution with SP-Buffer E at pH 7.5. Q Column Purification. Lane 13: Sample flow through in Q-Buffer A at pH 7.9.
2.7. Secondary purification by ion exchange chromatography
There are many bacterial proteins that contain high histidine content and so Ni-NTA affinity chromatography will rarely, on its own, yield a protein that can be used for vaccine studies. Therefore, purification by ion exchange chromatography is needed to reduce these contaminating proteins as well as remove residual endotoxin. For the PfCSP-KMY-SAPN the cationic resin SP-Sepharose was used as a first cleanup after Ni-NTA chromatography and a “polishing” ion exchange chromatography on Q-Sepharose was used to remove the endotoxin LPS.
Pack a Triton X-10 column with SP–Sepharose resin, final bed volume of 5ml and equilibrate the resin with 6 CV of SP-Buffer A (8 M urea, 100 mM NaH2PO4, pH 6.0). Combine the protein-containing fractions from the Nickel affinity purification and adjust the sample to pH 6.0, approximately 1 pH unit below the pI of the protein. Apply the sample onto the SP-Sepharose column at a flow rate of 2.5 mL/min. Wash the column sequentially with 6 CV of SP-Buffer A, 6 CV of SP175 Buffer B (8 M urea, 100 mM NaH2PO4, pH 4.0), 10 CV of SP-Buffer C (8 M urea, 100 mM NaH2PO4, 300 mM NaCl, pH 4.0); 6 CV of SP-Buffer B, followed by 6 CV of SP-Buffer D (8 M urea, 100 mM NaH2PO4, pH 6.5). Elute the protein by using SP–Buffer E (8 M urea, 20 mM Tris-HCl, 100 mM NaH2PO4, pH 7.5). Following the elution of the protein check the purity using SDS-PAGE. Most E. coli host proteins are removed by this step but the endotoxin level in the sample is still between 50 – 70 EU/µg of protein. The sample purity is good enough to perform test refoldings (see Section 2.8) to determine the best pH and salt concentrations needed to form good nanoparticles.
For Q-Sepharose chromatography pack a column with 10 ml of Q-Sepharose resin and equilibrate with 6 CV of Q-Buffer A (8 M urea, 20 mM Tris-HCl, 100 mM NaH2PO4, pH 7.9). Adjust the pH of the elution from the SP-Sepharose column to 7.9 and add the eluted protein to the Q-Sepharose column at a flow rate of 1.5 ml/min. Alternatively, a gravity drip column can be employed for small test samples. In a denaturing buffer such as 8 M urea at pH 7.9, the LPS tightly binds to the Q-Sepharose while the monomeric protein flows through.
2.8 Self-assembly of monomeric protein into protein nanoparticles
Once the monomeric protein is purified, the denaturant (urea) is removed by dialysis or rapid dilution (see below) and the particles are allowed to self-assemble. The self-assemble process is mainly driven by the hydrophobic and non-covalent interactions between the side chains of the amino acids along the hydrophobic seam of the coiled coils. These interactions are heavily influenced by the pH of the solution and its salt concentration. Therefore, the conditions needed to allow self-assembly of a newly designed protein needs to be determined. This is done first on a small scale using dialysis cassettes to select an approximate condition that allows assembly. But since cassette dialysis is not a scalable procedure, a larger scale method, approximating the conditions chosen by dialysis, is developed using a direct dilution of the monomer by rapid buffer addition.
Small scale dialysis method. Adjust the concentration of the purified protein to about 25 µg/ml (about OD280=0.1) in SP-Buffer D or Q-Buffer A. Inject 0.5 ml into a small Slide-A-Lyzer cassette (Thermo Scientific, Rockford, IL, Cat# 66330). Dialyze against 250 ml of Assembling Buffer containing as a base a buffer that is optimal for the desired pH range (such as HEPES, Tris-HCl, or NaH2PO4) while also varying ionic strength with 0 to 100 mM NaCl. It is important to keep glycerol at 5% (v/v) throughout these processes. The pH range of the dialysis buffer is chosen to be between zero and one pH unit above the pI of the protein. For example, the pI of PfCSP-KMY-SAPN is 7.03. We initially tested dialysis at pH 7.0, 7.5 and 8.0 using Tris-HCl as buffer. Each was made with 0 mM, 50 mM and 100 mM NaCl. All buffers contained 5% glycerol. Dialysis was allowed to proceed for 8 hrs or overnight at 4°C. The particle self-assembly was monitored by dynamic light scattering (DLS) to measure the hydrodynamic diameter of the particles and by transmission electron microscopy to examine uniform particle formation. The optimal assembling buffer for PfCSP-KMY-SAPN was determined to be 20 mM Tris-HCl, 5% Glycerol, pH 7.5.
Large scale direct dilution method. For larger amounts of SAPNs direct self-assembly can be achieved by rapid dilution of the urea. Most proteins are in a high concentration following elution from SP-Sepharose or after passing through Q-Sepharose but if necessary, concentrate the monomeric protein after the last ion exchange chromatography step to an OD280 > 2.5 using a 10K MWr cut off Amicon filter (Millipore Amicon Ultra, product# UFC901024). Place the concentrated protein in a bottle with a stir bar and gently stir while adding the best dilution buffer determined from small scale dialysis. Add the buffer with a pump at 50 ml/min until the protein concentration reaches an OD280 = 0.1 or ~25ug/ml. Continue to stir for 10 min. At this point in the purification process if downstream processing involves lyophilization substitute the best-determined excipient for glycerol. For PfCS-KMY-SAPN we substituted 5% sucrose for 5% glycerol (20 mM Tris-HCl, 5% sucrose, pH 7.5). Nanoparticle formation is monitored by DLS and TEM. This direct buffer dilution method, however, still leaves some urea in the solution and this is further reduced by ultra-filtration.
2.9. Ultra-filtration to exchange buffer and concentrate nanoparticles
Ultra-filtration using a Hollow Fiber Filter (HFF) is a scalable procedure to change buffers and concentrate particles. For example, while the best assembling buffer for the PfCSP-KMY-SAPN contained no NaCl this buffer condition tended to promote sticking of the SAPN to the HFF core. Also, because glycerol could not be lyophilized it was exchanged with 5% sucrose. Therefore, before ultra-filtration NaCl was added to the nanoparticle solution (final 100mM NaCl) and the HFF Exchange Buffer was formulated with sucrose (20 mM Tris-HCl, 100 mM NaCl, 5% sucrose, pH 7.5). The ultra-filtration system was assembled using silicon tubing (size 24), a Hollow Fiber Cartridge (GE Heath Care, product# UFP-30=E=4A), two pumps (Cole-Parmer, Masterflex L/S, Model 77200-62), a sample reservoir and a pressure gauge. Initially, one pump adds fresh HFF Exchange Buffer from a buffer reservoir to the sample reservoir at a rate needed to maintain the initial concentration of SAPN; the other pump forces the nanoparticle containing solution into the HFF system at 15±2 psi. The permeate is collected in a waste reservoir while the filtration is continued with fresh buffer being added to the sample reservoir until any remaining urea in the retentate solution is effectively reduced to less than 1 mM. To concentrate the SAPNs the addition of fresh sample buffer is stopped. The retentate is monitored until the protein concentration reaches the desired level. One problem with the use of the HFF to concentrate is that the tubing and column retentate volume is usually about 100 mL, so to achieve higher concentration of nanoparticles in smaller volumes additional concentration techniques, such as a 30K MW cut off Amicon filter (Millipore Amicon Ultra, product# UFC903024), needs to be employed.
2.10. Sterile filtration of nanoparticles
Finally the sample is filtered through a 0.2 µm filter to sterilize it. This filtration step also removes larger aggregates of nanoparticles. DLS shows a uniform peak, indicating a particle diameter about 25–45 nm depending on particle design. PfCSP-KMY-SAPN had a diameter of about 37 nm (Fig. 5). TEM shows minimum aggregation of particles (Fig. 6).
Figure 5.

Profile of DLS scan of PfCSP-KMY-SAPN after assembly following Q-Sepharose ion exchange chromatography. For this product the diameter of 100% of the particles is 37.29 nm with a polydispersity index (PDI) =0.16. Shown are three consecutive plots of the DLS size determination; each plot is the average of 10 run determinations done automatically by the instrument.
Figure 6.

Individual nanoparticles are visualized using transmission electron microscopy. The bar represents 100 nm.
2.11 Final yield
All the above procedures are optimized to obtain the highest amount of purified final product as possible. The procedures are amenable to large scale (>300 L) production in a GMP facility. This has not been done at this time but four laboratory scale (1.5, 5 or10 L) production runs in the laboratory have routinely yield between 80 –140 mg of final folded PfCSP-KMY-SAPN per liter of initial culture media. If one assumes the a dose of vaccine uses 50 µg of final product then the above processes will yield between 1600 to 2800 doses per liter of starting culture.
2.12. Storage and stability
Sterile filtered samples can be stored for at least 1 month at 4°C or for more than 1 year at −80°C. Stability of the SAPN is be determined by DLS and TEM.
2.13. Endotoxin analysis
The level of endotoxin is measured using a Limulus Amebocyte Lysate assay pyrochrome kit (Associates of Cape Cod, Falmouth, MA, product# C1500) according to company instruction. Samples are read at 405 nm in a DioTek analyzer plate reader using Gen5 software, version 1.09.
2.14. Size analysis
The diameter of the particles is determined by dynamic light scattering (DLS) using a Malvern Zetasizer Nano S equipped with a 633 nm laser. The measurements are made at RT. Particle diameter is usually only determined by volume distribution and as shown in Figure 5 is 37.29 nm. The Malvern Zetasizer Nano S also allows determination by intensity distribution. Using this option the diameter is reported to be 55.40 nm. When comparing different particle constructs it is important to be consistent when choosing a method. The volume distribution method more accurately agrees with the size determined by TEM.
Transmission electron microscopy (TEM) is used to visualize the uniformity and shape of particle formation and measure particle size. Procedures are as described previously [1, 2].
3. Conclusions
Our research aim was to design and manufacture a protein that would self-assemble into a repetitive antigen display of immunogenic B- and T-cell epitopes from the CSP of P. falciparum. This platform can be used to display epitopes from other pathogens. The procedures for the purification of the PfCSP-KMY-SAPN are given here but exact conditions for the assembly of other protein constructs will have to be empirically determined. Steps a t which salt and pH variations could be tested are noted in each relevant section. A more detailed analysis of the effects of changes in salt, pH, temperature, and glycerol concentration on the self-assembly of different proteins is given by Yang [7]. Not all designs are expected to yield proteins that can be easily assembled into spherical particles. For example, those containing very hydrophobic amino acids or ones with cysteine residues, which can lead to disulfide bridge cross-linking, may be problematic. However, once the conditions for refolding are established, a stable, immunogenic nanoparticle can reproducibly be made.
We have focused here on the development of procedures that are scalable and amenable to cGMP process development. We used a bacterial expression plasmid that required kanamycin as a selectable antibiotic to express the proteins in the BL21 (DE3) Tuner strain bacteria and grew it in a medium containing no animal products. Not all bacterial strains grow the same in different growth media so it is important to screen several to choose one that fits your system. While we selected to use Super Broth-Alternate Protein Source for the PfCSP-KMY-SAPN expression, for other constructs, in different cell lines we have selected different media after performing similar screenings. The final yield of product per liter of starting culture is dependent on how dense the bacteria will grow in the selected culture media so selection of a media and determination of culture conditions that will allow optimal growth of bacteria has an important impact on final yield of product. Other plasmids with different antibiotic selection markers that are suitable for the manufacturing of human use products can be used. The use of other bacterial strains and even expression systems like plants, yeast or eukaryotic cells are also possible, though for human use products, the cell line needs to be acceptable to the appropriate regulatory agencies.
Acknowledgments
Material has been reviewed by the Walter Reed Army Institute of Research. There is no objection to its presentation and/or publication. The opinions or assertions contained herein are the private views of the authors, and are not to be construed as official, or as reflecting true views of the Department of the Army or the Department of Defense. Work was funded by the Military Infectious Disease Research Program (MIDRP) and the NIH Grant 1R01AI068761. PB has an interest in the company Alpha-O Peptides that has patents or patents pending on the technology.
Footnotes
Publisher's Disclaimer: This is a PDF file of an unedited manuscript that has been accepted for publication. As a service to our customers we are providing this early version of the manuscript. The manuscript will undergo copyediting, typesetting, and review of the resulting proof before it is published in its final citable form. Please note that during the production process errors may be discovered which could affect the content, and all legal disclaimers that apply to the journal pertain.
References
- 1.Kaba SA, Brando C, Guo Q, Mittelholzer C, Raman S, Tropel D, Aebi U, Burkhard P, Lanar DE. Journal of Immunology. 2009;183:7268–7277. doi: 10.4049/jimmunol.0901957. [DOI] [PMC free article] [PubMed] [Google Scholar]
- 2.Kaba SA, McCoy ME, Doll TAPF, Brando C, Guo Q, Dasgupta D, Yang Y, Mittelholzer C, Spaccapelo R, Crisanti A, Burkhard P, Lanar DE. PloS ONE. 2012;7 doi: 10.1371/journal.pone.0048304. [DOI] [PMC free article] [PubMed] [Google Scholar]
- 3.Pimentel TAPF, Yan Z, Jeffers SA, Holmes KV, Hodges RS, Burkhard P. Chemical Biology & Drug Design. 2009;73:53–61. doi: 10.1111/j.1747-0285.2008.00746.x. [DOI] [PMC free article] [PubMed] [Google Scholar]
- 4.Schroeder U, Graff A, Buchmeier S, Rigler P, Silvan U, Tropel D, Jockusch BM, Aebi U, Burkhard P, Schoenenberger CA. Journal of Molecular Biology. 2009;386:1368–1381. doi: 10.1016/j.jmb.2008.11.023. [DOI] [PubMed] [Google Scholar]
- 5.Raman S, Machaidze G, Lustig A, Aebi U, Burkhard P. Nanomedicine. 2006;2:95–102. doi: 10.1016/j.nano.2006.04.007. [DOI] [PubMed] [Google Scholar]
- 6.Alexander J, Oseroff C, Dahlberg C, Qin MS, Ishioka G, Beebe M, Fikes J, Newman M, Chesnut RW, Morton PA, Fok K, Appella E, Sette A. Journal of Immunology. 2002;168:6189–6198. doi: 10.4049/jimmunol.168.12.6189. [DOI] [PubMed] [Google Scholar]
- 7.Yang Y, Ringler P, Mueller SA, Burkhard P. Journal of Structural Biology. 2012;177:168–176. doi: 10.1016/j.jsb.2011.11.011. [DOI] [PMC free article] [PubMed] [Google Scholar]