Abstract
The vast majority of L1 insertions are 5′ truncated and thus inactive. Yet, the mechanism of 5′ truncation is unknown. To examine whether the frequency of L1 retrotransposition is directly correlated with the length of genomic L1 insertions, we used a cell culture assay to measure retrotransposition frequency and a PCR-based assay to measure L1 insertion length. We tested five full-length human L1 elements that retrotranspose at different frequencies: LRE3, L1RP, L1.3, L1.2A and L1.2B. Our data suggest that L1 insertion length correlates with L1 retrotransposition frequency for insertions >1 kb in length. For two elements, L1RP and L1.2A, we found that swapping the reverse transcriptase domains had little effect. Instead, we found that genomic insertion length and retrotransposition frequency are substantially affected by amino acid substitutions at positions 363, 1220 and 1259 in ORF2. We suggest that the region containing residues 1220 and 1259 may be important in the binding of ORF2p to L1 RNA to facilitate reverse transcription.
INTRODUCTION
The plasticity and expansion of the human genome are due, in part, to the replicative activity of mobile genetic elements (1), the most active of which is the L1 retrotransposon (2,3). L1 (LINE-1 or long interspersed element) is an autonomous non-long terminal repeat (non-LTR) retrotransposon that makes up 17% of the genome, distributing DNA copies of itself to new genomic locations (2,4,5). A functional human L1 element is ∼6 kb in length and has two open reading frames (ORF1 and ORF2) that encode proteins required for its mobilization (6–9). Retrotransposition involves transcription, reverse transcription and integration into a new genomic location. Reverse transcription and integration are coupled in a target primed reverse transcription reaction that takes place on genomic DNA (10,11). In addition to their own replication, L1s may shuffle exons by carrying genomic flanking sequences with them when they move (12–14). They can also provide the machinery for processed pseudogene formation and mobilization of Alu elements, further diversifying the genome (15–18).
A study of 5′ truncation is relevant to L1 biology and important for our understanding of genome evolution. Over 95% of genomic L1 sequences and approximately two-thirds of recent L1 insertions are 5′ truncated (19–24). The mechanistic basis for 5′ truncation is unknown. One commonly offered explanation is that the L1 reverse transcriptase (RT) enzyme disengages from the L1 RNA template before completing the full-length cDNA sequence (21). However, premature termination of reverse transcription cannot in and of itself account for the fact that genomic L1s form a bimodal distribution of insertion lengths with short (<1 kb) and full-length (6 kb) insertions encountered most often (22–26).
The extent to which an L1 element truncates during retrotransposition limits its ability to successfully colonize the host genome. Because L1 proteins act preferentially to mobilize the RNA that encoded them (cis-preference), a truncated genomic L1 insertion will not efficiently be mobilized in trans (5,15,16,27,28). Since essentially only full-length L1 insertions are capable of retrotransposition (16,27–29), L1 elements that produce a higher number of full-length copies are less susceptible to extinction. Should a parental L1 be subjected to a lethal, inactivating mutation, its previously disseminated, full-length progeny can continue its genetic legacy. Conversely, full-length insertions may be counter-selected over evolutionary time for their deleterious effects on the expression of neighboring genes (30). By studying de novo L1 insertions in cultured cells, we can characterize insertions without the confounding influence of negative selection over evolutionary time. Lastly, an improved understanding of why 5′ truncation occurs may facilitate the design of more active L1 elements for biomedical research. Highly active L1 elements could be harnessed as insertional mutagens, cell lineage markers or gene delivery vehicles (31–33).
In this study, we characterized the retrotransposition activity and insertion lengths of a series of cloned human L1 elements. We found that human L1 elements with higher activity in a cultured cell assay of retrotransposition produce longer genomic insertions. Surprisingly, we also found that three amino acid changes within the ORF2 protein, outside of the RT domain, contribute significantly to insertion length.
MATERIALS AND METHODS
Plasmids
All of the human L1 elements that were used in these assays were swapped into the RJD99-RP-Neo plasmid using Not1 (which cuts just upstream of the L1 5′UTR) and BstZ17i (which cuts in the L1 3′UTR just upstream of the neomycin resistance gene cassette). RJD99 is a derivative of pCEP4 (Invitrogen) that lacks the CMV promoter-containing BglII fragment. RJD99-RP-Neo was constructed as described previously (29). The RT domains were excised from L1.2A and L1RP using EcoRV and swapped by subcloning the elements into pBluescript (Stratagene). The derivations of the various mutants are as follows: L1.2A I1220/S1259: L1RP Spe1-BstZ17i fragment plus L1.2A BstZ17i-Spe1; L1.2A I1220: L1RP Spe1-Nco1 fragment plus L1.2A Nco1-Spe1; L1.2A S1259: L1RP Nco1-BstZ17i fragment plus L1.2A BstZ17i-Nco1; L1RP M1220/L1259: L1.2A Spe1-BstZ17i fragment plus L1RP BstZ17i-Spe1; L1RP M1220: L1.2A Spe1-Nco1 fragment plus L1RP Nco1-Spe1; L1RP L1259: L1.2A Nco1-BstZ17i fragment plus L1RP BstZ17i-Nco1.
LRE 3 was cloned as detailed in Brouha et al. (34) and sub-cloned into RJD 99.
Site-directed mutagenesis
ORF2 residue 363 in L1RP and L1.2 were mutated using the QuikChange mutagenesis kit (Stratagene) and the following primer sets: L1RP G363 sense, 5′-AAT CAA TGA ATC CGG GAG CTG GTT TTT TGA AAG G-3′; anti-sense, 5′-AAC CAG CTC CCG GAT TCA TTG ATT TTT TGA AGG G-3′; L1.2 R363 sense, 5′-AAT CAA TGA ATC CAG GAG CTG GTT TTT TGA AAG G-3′; anti-sense, 5′-AAC CAG CTC CTG GAT TCA TTG ATT TTT TGA AGG G-3′. Sequence analysis of a ∼700 bp region flanking the insertion confirmed the presence of the desired mutation. Four independent clones of each mutant were run in the cultured cell assay to compensate for any potential PCR errors outside of the sequenced region.
Cultured cell assay of L1 retrotransposition
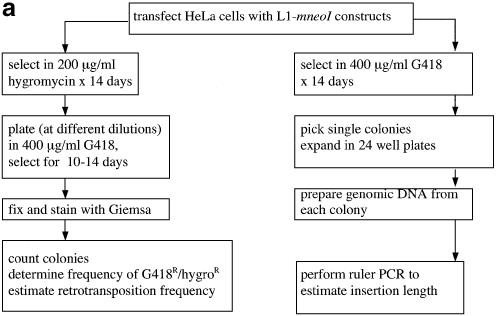
HeLa cells (human cervical carcinoma cell line) were cultured and transfected with L1 constructs as described previously (6,35). Details of the cell culture conditions are given in Figure 1a.
Figure 1.
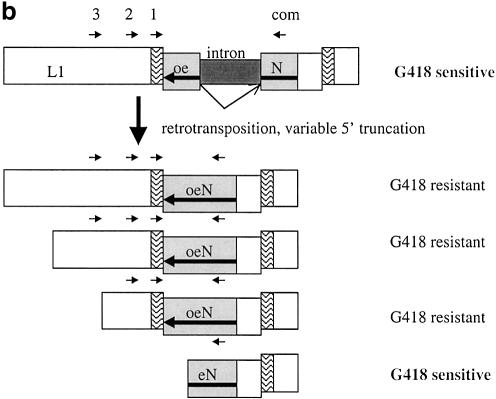
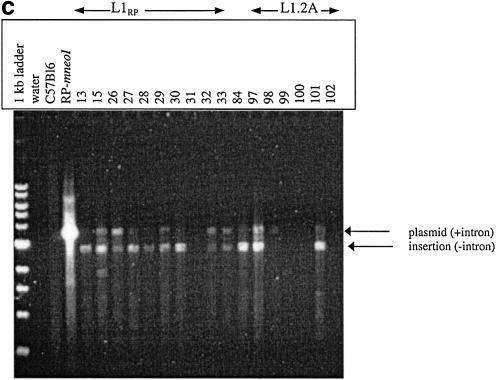
(a) Overview of assay system to measure L1 retrotransposition frequency and insertion length in cultured cells. Transfection and selection of HeLa cells containing neomycin-tagged L1 constructs (L1-mneoI) were carried out as described previously (6,35). Two parallel assay systems were established to measure retrotransposition frequency and estimate L1 insertion length (see text). (b) L1 retrotransposition cassette and predicted results for variable 5′ truncation of L1 insertions. When L1-mneoI undergoes retrotransposition, the intron in the anti-sense neomycin resistance gene (mneoI) is spliced out, yielding mneo and conferring resistance to the antibiotic G418. The parental L1-mneoI construct is sensitive to G418 because the intron cannot be spliced out of the anti-sense mneoI transcript. Similarly, insertions that lack the full-length spliced neomycin resistance gene are sensitive to G418. The map positions of the ruler PCR primers are as follows: 3 kb primer (position 3961 in L1), 2 kb primer (4819), 1 kb primer (5892) and com (reverse primer in the mneoI gene, beyond the intron, position 7819). Predicted amplicon sizes for spliced products using the primer com and primers 3, 2 and 1, are 2949, 2091 and 1018 bp, respectively. Insertions of different lengths will be positive for one or more of these ruler PCRs. Sequence analysis of the spliced and unspliced amplicons was performed to validate each of the ruler PCRs. (c) Three kilobase ruler PCR on G418R HeLas transfected with L1-mneoI constructs. Three kilobase ruler PCR was performed using primers 3 kb and com. The plasmid, L1-mneoI, gives a band at 3858 bp, while the L1-mneo insertion, L1-mneo, gives a band at 2949 bp. Lanes contain a 1 kb ladder (New England Biolabs), distilled water, C57Bl6 (wild-type mouse DNA), RP-mneoI (retrotransposition plasmid) and genomic DNA samples from G418R clones transfected with L1RP (clones 13, 15, 26–33), L1RP with L1.2RT (clone 84) or L1.2A (clones 97–102).
Ruler PCR assays to measure L1 insertion length
G418 resistant clones were expanded in duplicate 24 well plates in 400 µg/ml G418 (Gibco/LTI) and genomic DNA was prepared as described previously (36). AmpliTaq-Gold polymerase (Roche) was used for reactions under 1 kb. For all other amplifications, FailSafeR PCR enzyme mix was used (Epicentre Technologies). Each reaction contained 250 ng of genomic DNA, 100–200 ng of each primer, 1× reaction buffer (either buffer A with 15 mM MgCl2 from Roche for amplifications with Taq Gold or buffers D, E or F for FailSafeR amplifications), 0.2 mM dNTPs (when using the Taq buffer; dNTPs are included in the FailSafe buffer) and 1.5–2.0 U of polymerase in a volume of 50 µl. Typical amplification conditions were: 94°C, 15 min; (94°C, 30 s; 54–62°C, 30 s; 72°C, 1 min per kilobase) × 35–40 cycles; 72°C, 10 min; 4°C hold on a Peltier thermocycler (Hybaid or MJ research). Oligonucleotides used for PCR included the following: com (Neo anti-sense anchor, 7819), 5′-ATT GAA CAA GAT GGA TTG CAC GC-3′; 1 kb sense (nucleotide 5892), 5′-ATA GCA TTG GGA GAT ATA CC-3′; 2 kb sense (nucleotide 4819), 5′-AGA AAG CTG AAA CTG GAT CCC-3′; 3 kb sense (nucleotide 3961), 5′-CAG GGA TGC CCT CTC TCA CCG-3′.
Nucleotide positions of the oligonucleotides are based on the sequence of L1RP (GenBank accession no. AF148856) and the sequence of the L1RP-mneoI cassette (29). PCR assays were validated by sequence analysis of the spliced and unspliced L1-mneoI amplicons.
Southern blotting
Ten micrograms of genomic DNA from selected NeoR clones was digested overnight with AseI or EcoRI (New England BioLabs) and prepared for Southern hybridization using standard methods. The probe for hybridization was a 1370 bp BamH1–EcoR1 fragment containing the neomycin phosphotransferase exon (gift of John Moran).
RESULTS
To determine if there is a correlation between the activity of an L1 element and the length of the insertions that it generates, we relied on two parallel assays (Fig. 1a). In one, we performed a retrotransposition assay in which cells were selected for stable expression of the hygromycin resistance gene on the pCEP4 plasmid that contains the L1-mneoI retrotransposition cassette (6). Then, hygromycin resistant cells were subjected to G418 selection. The fraction of G418 resistant (G418R) cells divided by the number of hygromycin resistant cells gave an estimate of retrotransposition frequency. In the second assay, we performed a transient retrotransposition assay (without hygromycin selection) (37). The transient assay was used to obtain clones with L1 insertions rapidly.
The ruler PCR assay (Fig. 1b) measures the minimum length of the L1-mneo insertion. (Hereafter we refer to the intron-containing retrotransposition construct as L1-mneoI and the insertion as L1-mneo.) The assay uses a reverse primer anchored in the neomycin phosphotransferase gene (mneoI, beyond the intron) and a series of forward primers that reside in different locations within the L1 element. For an insertion to be positive in this assay, it must be at least as long as the neomycin resistance gene. We include the neomycin marker in our estimates of the insertion length. The 1 kb sense L1 primer resides at nucleotide position 5892 (using L1RP as a reference) (29) in the L1 3′UTR, within 50 bp of the mneoI cassette. In combination with the neomycin cassette, this PCR amplifies a ∼1 kb product. Greater than 95% of the G418R clones with sufficient DNA were positive for the L1-mneo (spliced intron) product in this 1 kb ruler PCR assay (n = 816 clones). All of the clones typed by this ruler PCR assay for 2 or 3 kb insertions are positive for the 1 kb insertion.
If a clone is positive in a ruler PCR assay, we conclude that it has an insertion that truncates upstream of the L1 sense strand primer. In some cases it is possible to further ‘size’ the insertion. For example, an insertion that truncates between the first and the second kilobase of L1-mneo sequence will be positive in the 1 kb PCR, but negative in the 2 kb PCR. On the other hand, an insertion that is positive in all of the PCR assays is at least 3 kb in length. A gel of the 3 kb ruler PCR assay is shown in Figure 1c. This gel shows that 9/10 L1RP-mneo clones and 2/6 L1.2A-mneo clones have insertions that are at least 3 kb in length. It also shows that several of the clones have a weak band corresponding to the plasmid template (which contains L1-mneoI). In multiple experiments, the fraction of clones that had a plasmid band was not correlated with the fraction of clones that had an insert band. For example, in one 3 kb ruler PCR experiment, L1.2A had 5/64 positive clones and 38 of these 64 (59%) clones had a plasmid band, while L1RP had 19/22 positive clones and 14 of these clones (64%) had the plasmid band (data not shown). In general, the plasmid amplicon is disfavored in these assays because (i) antibiotic selection was not maintained for the plasmid and (ii) the extension time was kept short in order to reduce amplification of the plasmid relative to the insertion. Since all of the clones shown in Figure 1c were positive in the 2 kb ruler PCR assay (data not shown), the lack of amplification in clones 31, 99, 100 and 102 is not due to poor DNA quality.
Figure 1c suggests that G418R clones from L1RP have longer insertions than G418R clones from L1.2A. Since L1RP is approximately 40–60 times more active in the cultured cell assay than L1.2A (29), these results suggest that L1 insertion length and retrotransposition activity are positively correlated. However, an alternative explanation is a copy number bias towards more insertions per clone with L1RP. If a single HeLa clone had multiple L1 insertions, the ruler PCR assay would preferentially detect the longest. Thus, an L1RP clone with a large number of insertions would be more likely to have a long insertion than a L1.2A clone with one or two insertions, even if the frequency distributions of insertion lengths for L1RP and L1.2A were identical. We examined the possibility of a copy number bias by Southern blot (see Materials and Methods). The Southern blots revealed that L1RP and L1.2A clones had approximately equal numbers of insertions (between one and two insertions per clone on average; data not shown). Using the same transient cultured cell assay, Wei and colleagues have also observed that G418R clones often have more than one L1 insertion (37).
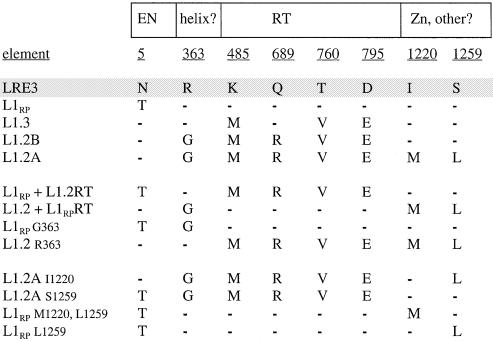
Having preliminary evidence for a correlation between L1 retrotransposition frequency and insertion length, we next sought to determine whether this correlation held for more than two human L1 elements (Fig. 2). Five cloned human L1 elements were chosen for these studies: LRE3 (34), L1.2A (38), L1.2B (38), L1RP (29) and L1.3 (39). Although they had very similar nucleic acid sequences (see Fig. 2), these elements were known to exhibit very different levels of mobility in the cultured assay of retrotransposition (LRE3 > L1RP > L1.3 ∼ L1.2B > L1.2A). All five elements are members of the youngest group of the Ta subset (40), Ta-1d (24).
Figure 2.
Alignment of ORF2 sequences of active human L1 elements surveyed for insertion length and frequency. Shown in the boxed regions are the known functional domains of the L1 ORF2 protein. These include the endonuclease domain (EN) and the RT domain. In between the EN and RT domains is a region that contains alternating basic and uncharged residues that may form alpha helices spanning amino acids 313–365. Residue 363 is located in a putative alpha helix. In the very 3′ end of the ORF2p, beyond the putative zinc knuckle motif, is a region with intermittently placed basic residues that includes residues 1220 and 1259. L1 constructs are given in the first column. Amino acid residues, numbered from the N- to C-terminal portion of the ORF2p, are underlined. Amino acid sequences are aligned relative to LRE3 (shaded). Residues that are identical to the corresponding residue in LRE3 are denoted by dashes. Five human L1 elements were studied: LRE3, L1RP, L1.3, L1.2B and L1.2A. Derivative constructs include RT domain swaps (L1RP with the RT domain of L1.2 and vice versa) and various site-directed mutants (see text).
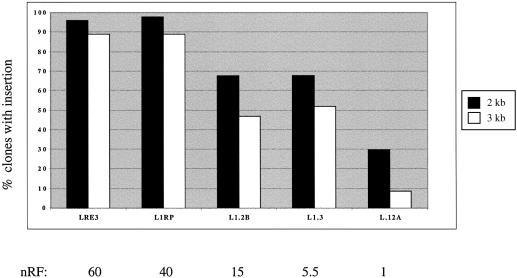
Insertion lengths correlated with retrotransposition frequencies for these five elements (Fig. 3). Because of the inherent variation between retrotransposition assays, we restricted comparisons of the retrotransposition frequencies to elements tested within the same experiment (see Supplementary Material). To allow for comparisons between experiments, we derived a normalized retrotransposition frequency (nRF). The nRF uses the absolute retrotransposition frequency of the least active element in our series, L1.2A, as a basis for comparison. For example, in Figure 3, the absolute frequency for L1.2A is 1/838, which corresponds to a nRF of 1.0. The absolute frequency of L1RP is 1/21, corresponding to a nRF of 40. Other experiments performed with the same L1 elements have produced consistent nRFs (see Figs 4–6 and Supplementary Material).
Figure 3.
More active human L1 elements produce longer insertions in HeLa cells. Plotted are the percentages of G418R HeLa clones that are positive for the 2 kb ruler PCR (dark bars) or the 3 kb ruler PCR (light bars) for each of the five wild-type human L1 elements. Shown below the graph are the nRFs, using the retrotransposition frequency of the least active element, L1.2A as a basis for comparison. The absolute retrotransposition frequency for L1.2A in this experiment was 1/838. The following numbers of clones were typed for each element: LRE3 (94 clones), L1RP (46 clones), L1.2B (19 clones), L1.3 (31 clones) and L1.2A (54 clones). All 244 clones were positive in the 1 kb ruler PCR.
Figure 4.
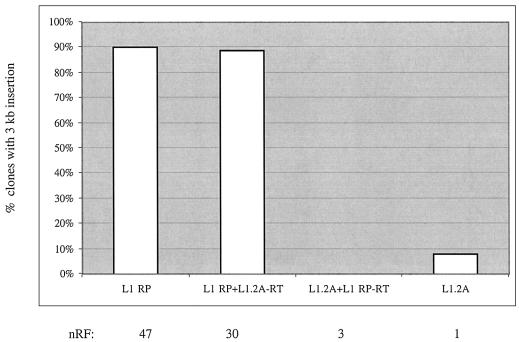
The RT domain does not account for the difference in insertion lengths of L1.2A versus L1RP. Plotted are the percentages of G418R HeLa clones that are positive for the 3 kb ruler PCR for the wild-type elements L1RP and L1.2A and the RT swapped elements (see Materials and Methods) L1RP with L1.2A-RT and L1.2A with L1RP-RT. None of the L1.2A+L1RP-RT clones was positive in the 3 kb PCR. Shown below the graph are the nRFs, using the retrotransposition frequency of the least active element, L1.2A, as a basis for comparison. The absolute retrotransposition frequency of L1.2A in this experiment was 1/2113. The numbers of clones typed for each element are as follows: L1RP (48 clones), L1RP+L1.2RT (47 clones), L1.2A+L1RP-RT (32 clones) and L1.2A (37 clones). All 164 clones were positive for the 1 kb insertion product.
Figure 6.
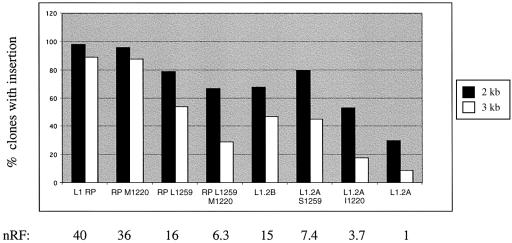
Reciprocal effects of ORF2 amino acids 1220 and 1259 on insertion length and retrotransposition frequency in L1RP and L1.2A. Plotted are the percentages of G418R HeLa clones that are positive for the 2 and the 3 kb ruler PCRs for the wild-type elements L1RP and L1.2A and various permutations at positions 1220 and 1259 in ORF2. L1.2B is identical to L1.2A with I1220 and S1259 (see Fig. 2). Shown below the graph are the nRFs, using the retrotransposition frequency of the least active element, L1.2A, as a basis for comparison. The absolute retrotransposition frequency of L1.2A in this experiment was 1/838. The numbers of clones typed for each element are as follows: L1RP (46 clones), RP M1220 (24 clones), RP L1259 (24 clones), RP M1220 L1259 (21 clones), L1.2B (19 clones), L1.2A S1259 (20 clones), L1.2A I1220 (17 clones) and L1.2A (54 clones). All 225 clones were positive for the 1 kb insertion product.
Based on proposed models of retrotransposition, we wondered if the difference in L1RP and L1.2A insertion length resided in the RT domain. To test this hypothesis, the RT domains of L1RP and L1.2A were swapped using flanking EcoRV sites (EcoRV sites are found at nucleotides encoding residues 399–400 and 1111–1112 in the L1 ORF2p). Surprisingly, we found that swapping the RT domains between L1RP and L1.2A did not have a significant effect on retrotransposition frequency or insertion length (Fig. 4).
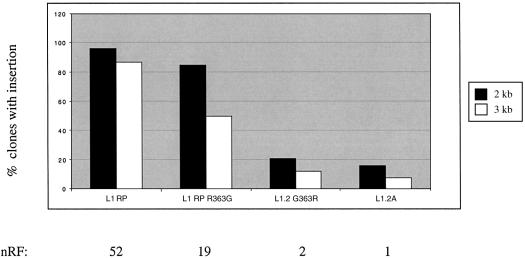
Another potential source of the lower retrotransposition frequency and shorter insertions associated with L1.2A is glycine 363 of ORF2. This highly conserved residue is located between the endonuclease and RT domains. Sequences neighboring residue 363 are conserved among active human L1 elements, and residue 363 is conserved evolutionarily as a basic residue. Human, mouse and rabbit L1s encode an arginine, while rat, medaka and slow loris (a prosimian) have a lysine residue at position 363. We used site-directed mutagenesis to create L1.2 R363 and L1RPG363 (Fig. 5). Residue 363 has a 2–3-fold effect on the retrotransposition frequency of L1.2A and a small effect on insertion length (Fig. 5). However, the data did demonstrate a statistically significant linear regression for the relationship between nRF and the fraction of insertions >3 kb (P < 0.005).
Figure 5.
Residue 363 has a small but significant effect on retrotransposition frequency and insertion length. Plotted are the percentages of G418R HeLa clones that are positive for the 2 and the 3 kb ruler PCRs for the wild-type elements L1RP, L1.3 and L1.2A and variants of L1RP and L1.2A at position 363 in ORF2. Shown below the graph are the nRFs, using the retrotransposition frequency of the least active element, L1.2A, as a basis for comparison. The absolute retrotransposition frequency of L1.2A in this experiment was 1/3590. The numbers of clones typed for each element are as follows: L1RP (38 clones), RP G363 (60 clones), L1.2 R363 (43 clones) and L1.2A (64 clones). All 205 clones were positive for the 1 kb insertion product.
Given the relatively small contributions of the RT domain and residue 363 of ORF2p, we searched for other sequence differences among the elements that could account for their differences in retrotransposition frequencies and insertion lengths. Since L1.2A and L1.2B differ by only two amino acids (at positions 1220 and 1259 at the COOH terminus of ORF2p) yet vary by ∼15-fold in retrotransposition frequency, we sought to determine the individual contributions of these amino acids. As with the more active L1.2 element (L1.2B), all other highly active elements in our panel (L1RP, L1.3 and LRE3) have an isoleucine at position 1220 and a serine at position 1259 (Fig. 2). To assess the individual contributions of these two amino acid residues to L1 retrotransposition frequency and insertion length, an allelic series of mutants was generated and tested in the cell culture assay and by ruler PCR. We found that both amino acids 1220 and 1259 contribute to retrotransposition frequency and insertion length, with reciprocal effects on L1RP and L1.2A (Fig. 6). When serine 1259 of L1RP is mutated to leucine (S1259L), the retrotransposition frequency drops to ∼40% of L1RP levels. S1259L accounts for two-thirds of the effect of the double mutant (S1259L/M1220I) on insertion length (Fig. 6). Conversely, changing the leucine at 1259 in L1.2A to a serine increases retrotransposition frequency and insertion length. The L1259S mutation is at least twice as effective in increasing both the nRT and insertion length as the M1220I substitution (Fig. 6). Thus, both residues affect retrotransposition frequency and insertion length, their effects are additive, and approximately two-thirds of their effect appears to be due to residue 1259.
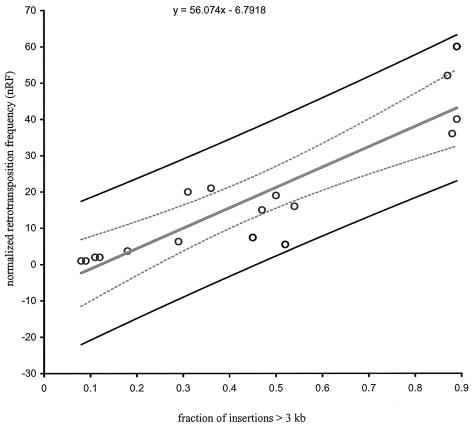
We then carried out a linear regression analysis of the combined data of Figures 5 and 6 (Supplementary Material, experiments 2 and 3). The direct relationship of nRF with the fraction of insertions >3 kb was statistically significant (P < 0.0001, r2 = 0.80; Fig. 7).
Figure 7.
Linear regression analysis of nRF as a function of insertion length. A linear regression analysis was performed using the data of experiments 2 and 3 (see Supplementary Material). The nRF is plotted on the y-axis and the fraction of insertions >3 kb in length is plotted on the x-axis. The analysis was performed using Microsoft Excel. The curved lines represent 95% confidence limits where n = 17, R2 = 0.8 and P < 0.0001.
DISCUSSION
We analyzed five active, young human L1 retrotransposons for their retrotransposition frequency and insertion lengths in a cultured cell assay (Fig. 1). There is a positive correlation between insertion length and retrotransposition frequency (Fig. 3). Over 85% of insertions of highly active elements (with retrotransposition frequencies greater than one event in every 50 transfected cells) are over 3 kb in length. On the other hand, fewer than 20% of insertions of elements with lower retrotransposition frequencies (approximately 1 in 500–2000 transfected cells) are >3 kb in length. All told, five natural L1s and nine mutant constructs show a general correlation between retrotransposition frequency and insertion length. One exception is L1.2B, which has a higher retrotransposition frequency than L1.3, but approximately the same proportion of clones with 2 and 3 kb insertions (Fig. 3).
We considered four potential sources of bias in our data on L1 insertion length. First, the basis for the correlation is not simply a higher copy number of L1 insertions in cells with the more active element. Rather, the copy numbers of insertions in cells containing a highly active element, L1RP, versus a less active element, L1.2A, were similar.
Secondly, our assay system minimizes the detection of insertions with 3′ transduction events. 3′ Transduction arises due to the use of downstream polyadenylation signals in flanking DNA sequences. Since the ruler PCR is rooted in the neomycin resistance gene, the lengths of any insertions that carry downstream flanking sequences due to 3′ transduction will be underestimated. However, we believe that very few, if any, of the insertions we characterized contained 3′ transduced sequences because all of the L1 elements studied were cloned into a mammalian expression vector (pCEP4) that has a very strong polyadenylation signal (SV40 late poly A) just downstream of L1. Indeed, no 3′ transductions beyond the SV40 poly A have been observed in over 80 characterized insertions in cultured cells when the SV40 poly A signal was present (6,41,42).
Thirdly, our assay is biased against the detection of inversions. Approximately 20% of L1 Ta insertions have inversions, the majority of which begin in the 3′-most kilobase of L1 sequence (43). If inversions arise in a similar location in L1-mneo insertions, they will likely disrupt the neomycin resistance gene. We looked for inversions in G418R clones that failed to amplify in the 1 kb ruler PCR (n = 12). No evidence of inversion was obtained using the reverse complementary primer sequence to the 1, 2 and 3 kb primers and the same anti-sense neomycin primer (data not shown). These assays do not address the possibility of insertions in the vast majority of clones that do amplify in the 1 kb ruler PCR.
Fourthly, we noted that our measurement of L1 insertion length is biased against very short insertions (<1 kb in length) because they do not confer resistance to G418 (Fig. 1b). Yet, in one survey of the human genome, L1 Ta insertions <1 kb were common, accounting for 29% of insertions (24). These findings are consistent with data on 5′ truncation of insertions in a cultured cell assay of retrotransposition in which over half were more than 80% truncated (42). Thus, by imposing G418 selection, we are missing 30–50% of the potential insertions. Since this study focuses on the distribution of insertions that exceed 1 kb, we have no data on whether the distributions of very short insertions are different in active versus less active L1 elements.
Our data are consistent with other studies of L1 insertions in cultured cells (6,41,42). Previously, we characterized four insertions of L1.2A in cell culture that were G418R and found that all were under 2.5 kb in length (6). Gilbert et al. found that, using L1.3, 40% of insertions of at least 2329 bp (due to the size of their retrotransposition marker) were longer than 3 kb (41). Furthermore, Symer et al. found that of L1.3 integrants longer than 1 kb, 60% were longer than 2 kb, and that 45% of the latter were longer than 3 kb (42). These data are comparable with our data for L1.3 in which ∼50% of inserts longer than 2 kb are also longer than 3 kb.
Several recent studies have documented an unexpectedly high fraction (∼30%) of full-length L1 insertions among the Ta subfamily of L1 elements (23–26). The proportion of full-length elements decreases with increasing age of the L1 subfamily (22–24). This is suggestive of a more general correlation between L1 retrotransposition frequency and insertion length. Although substitution of L for S at 1259 of ORF2p reduces both retrotransposition frequency and insertion length, it is unlikely that this substitution accounts in a simple way for the 5′ truncation typical of L1 elements in the genome. This is because nearly all of the truncated insertions over the past 40 million years were generated by L1s with S1259 (44). We speculate that a more active L1 element can generate a higher fraction of full-length copies, and thereby have a greater chance of colonizing the genome. However, it is also possible that highly active L1s are counter-selected due to the increased risk that their insertions will cause damaging mutations (30). One could also argue that there is a bias favoring the detection of full-length Ta1 sequences over the (shorter) period of time that Ta-1s have existed compared with Ta-0s.
To explore the basis for the correlation between insertion length and retrotransposition frequency, we adopted a molecular approach. First, we swapped the RT domains of L1RP and L1.2A, but found little effect on retrotransposition frequency or insertion length (Fig. 4). In support of this, previous studies with Ty1-L1ORF2 fusion constructs in yeast did not reveal an obvious correlation between RT activity and retrotransposition frequency (19,45).
Since most of the difference in insertion length and retrotransposition frequency between L1RP and L1.2A did not appear to reside in the RT domain, we focused on conserved residues because their conservation among active elements may indicate functional importance. This approach is simplistic because it ignores differences in more variable residues (which may, nevertheless, be functionally important) and nucleic acid sequences (which may be important for RNA secondary structure). We narrowed our search to three candidate residues in ORF2p: 363, 1220 and 1259 (Fig. 2).
The R363G substitution in ORF2p contributes to retrotransposition activity and insertion length (Fig. 5). This previously uncharacterized residue and the adjacent amino acid sequence may constitute a novel structural domain in the human L1 element. When the L1 sequences are analyzed in secondary structure prediction programs, specifically COILS (46) and PHD (47), the output consistently indicates the presence of a helically rich region spanning amino acids 313–365. Interestingly, the region from amino acids 313 to 365 is 35% identical to HoxB1 and homology modeling using a HoxB1 template and Modeller (48) has a root mean squared deviation of <1 Å.
The contributions of residues M1220 and S1259 of ORF2p to both retrotransposition frequency and insertion length are both striking and unexpected (Fig. 6). Although both residues lie outside of the RT domain, it is possible that they affect RT function. We speculate that these residues facilitate the interaction of the C-terminal region of ORF2p with L1 RNA during reverse transcription. In order to affect both retrotransposition frequency and insertion length, these residues may promote both the initiation of binding and the continued interaction or anchoring of ORF2p with L1 RNA. Alternatively or in addition, they may stabilize the L1 RNA or possibly an RNA–DNA hybrid structure in conjunction with the zinc knuckle domain of ORF2p (49). Finally, this region could be important in protecting the ORF2p from degradation during the reverse transcription process.
SUPPLEMENTARY MATERIAL
Supplementary Material is available at NAR Online.
Acknowledgments
ACKNOWLEDGEMENTS
We thank John Moran and members of the Kazazian and Luning Prak laboratories for their thoughtful comments on the manuscript. We thank the reviewers of this work for helpful suggestions and Chatima Noi Talchi for statistical analyses. This work was supported in part by NIH K08 CA83977 to E.L.P., a Nassau Fund grant to A.F. and RO1 GM45398 to H.K.
REFERENCES
- 1.Luning Prak E. and Kazazian,H.H. (2000) Mobile elements and the human genome. Nature Rev. Genet., 1, 134–144. [DOI] [PubMed] [Google Scholar]
- 2.International Human Genome Sequencing Consortium (2001) Initial sequencing and analysis of the human genome. Nature, 409, 860–920.11237011 [Google Scholar]
- 3.Fanning T.G. and Singer,M.F. (1987) LINE-1: a mammalian transposable element. Biochim. Biophys. Acta, 910, 203–212. [DOI] [PubMed] [Google Scholar]
- 4.Smit A.F. (1999) Interspersed repeats and other mementos of transposable elements in mammalian genome. Curr. Opin. Genet. Dev., 9, 657–663. [DOI] [PubMed] [Google Scholar]
- 5.Moran J.V. and Kazazian,H.H.,Jr (1998) The impact of L1 retrotransposons on the human genome. Nature Genet., 19, 19–24. [DOI] [PubMed] [Google Scholar]
- 6.Moran J.V., Holmes,S.E., Naas,T.P., DeBerardinis,R.J., Boeke,J.D. and Kazazian,H.H.,Jr (1996) High frequency retrotransposition in cultured mammalian cells. Cell, 87, 917–927. [DOI] [PubMed] [Google Scholar]
- 7.Feng Q., Moran,J.V., Kazazian,H.H. and Boeke,J.D. (1996) Human L1 retrotransposon encodes a conserved endonuclease required for retrotransposition. Cell, 87, 905–916. [DOI] [PubMed] [Google Scholar]
- 8.Kolosha V.O. and Martin,S.L. (2003) High-affinity, non-sequence-specific RNA binding by the open reading frame 1 (ORF1) protein from long interspersed nuclear element 1 (LINE1). J. Biol. Chem., 278, 8112–8117. [DOI] [PubMed] [Google Scholar]
- 9.Martin S.L. and Bushman,F.D. (2001) Nucleic acid chaperone activity of the ORF1 protein from the mouse LINE-1 retrotransposon. Mol. Cell Biol., 21, 467–475. [DOI] [PMC free article] [PubMed] [Google Scholar]
- 10.Luan D.D., Korman,M.H., Jakubczak,J.L. and Eickbush,T.H. (1993) Reverse transcription of R2Bm RNA is primed by a nick at the chromosomal target site: a mechanism for non-LTR retrotransposition. Cell, 72, 595–605. [DOI] [PubMed] [Google Scholar]
- 11.Cost G.J., Feng,Q., Jacquier,A. and Boeke,J.D. (2002) Human L1 element target-primed reverse transcription in vitro. EMBO J., 21, 5899–5910. [DOI] [PMC free article] [PubMed] [Google Scholar]
- 12.Moran J.V., DeBerardinis,R.J. and Kazazian,H.H. (1999) Exon shuffling by L1 retrotransposition. Science, 283, 1530–1534. [DOI] [PubMed] [Google Scholar]
- 13.Pickeral O.K., Makalowski,W., Boguski,M.S. and Boeke,J.D. (2000) Frequent human genomic DNA transduction driven by LINE-1 retrotransposition. Genome Res., 10, 411–415. [DOI] [PMC free article] [PubMed] [Google Scholar]
- 14.Goodier J.L., Ostertag,E.M. and Kazazian,H.H. (2000) Transduction of 3′ flanking sequences is common in L1 retrotransposition. Hum. Mol. Genet., 9, 653–657. [DOI] [PubMed] [Google Scholar]
- 15.Dewannieux M., Esnault,C. and Heidmann,T. (2003) LINE-mediated retrotransposition of marked Alu sequences. Nature Genet., 35, 41–48. [DOI] [PubMed] [Google Scholar]
- 16.Wei W., Gilbert,N., Ooi,S.L., Lawler,J.F., Ostertag,E.M., Kazazian,H.H., Boeke,J.D. and Moran,J.V. (2001) Human L1 retrotransposition: cis preference versus trans complementation. Mol. Cell. Biol., 21, 1429–1439. [DOI] [PMC free article] [PubMed] [Google Scholar]
- 17.Boeke J.D. (1997) LINEs and Alus—the polyA connection. Nature Genet., 16, 6–7. [DOI] [PubMed] [Google Scholar]
- 18.Deininger P.L. and Batzer,M.A. (1999) Alu repeats and human disease. Mol. Genet. Metab., 67, 183–193. [DOI] [PubMed] [Google Scholar]
- 19.Sassaman D.M., Dombroski,B.A., Moran,J.V., Kimberland,M.L., Naas,T.P., DeBerardinis,R.J., Gabriel,A., Swergold,G.D. and Kazazian,H.H.,Jr (1997) Many human L1s are capable of retrotransposition. Nature Genet., 16, 37–43. [DOI] [PubMed] [Google Scholar]
- 20.Grimaldi G., Skowronski,J. and Singer,M.F. (1984) Defining the beginning and end of KpnI family segments. EMBO J., 3, 1753–1759. [DOI] [PMC free article] [PubMed] [Google Scholar]
- 21.Voliva C.F., Jahn,C.L., Comer,M.B., Hutchison,C.A. and Edgell,M.H. (1983) The L1 Md long interspersed repeat family in the mouse: almost all examples are truncated at one end. Nucleic Acids Res., 11, 8847–8850. [DOI] [PMC free article] [PubMed] [Google Scholar]
- 22.Pavlicek A., Paces,J., Zika,R. and Hejnar,J. (2002) Length distribution of long interspersed nuclear elements (LINEs) and processed pseudogenes of human endogenous retroviruses: implications for retrotransposition and processed pseudogene detection. Gene, 300, 189–194. [DOI] [PubMed] [Google Scholar]
- 23.Ovchinnikov I., Rubin,A. and Swergold,G.D. (2002) Tracing the LINEs of human evolution. Proc. Natl Acad. Sci. USA, 99, 10522–10527. [DOI] [PMC free article] [PubMed] [Google Scholar]
- 24.Boissinot S., Chevret,P. and Furano,A.V. (2000) L1 (LINE-1) retrotransposon evolution and amplification in recent human history. Mol. Biol. Evol., 17, 915–928. [DOI] [PubMed] [Google Scholar]
- 25.Myers J.S., Vincent,B.J., Udall,H., Watkins,W.S., Morrish,T.A., Kilroy,G.E., Swergold,G.D., Henke,J., Henke,L., Moran,J.V., Jorde,L.B. and Batzer,M.A. (2002) A comprehensive analysis of recently integrated human Ta L1 elements. Am. J. Hum. Genet., 71, 312–326. [DOI] [PMC free article] [PubMed] [Google Scholar]
- 26.Salem A.H., Myers,J.S., Otieno,A.C., Watkins,W.S., Jorde,L.B. and Batzer,M.A. (2003) LINE-1 pre-Ta elements in the human genome. J. Mol. Biol., 326, 1127–1146. [DOI] [PubMed] [Google Scholar]
- 27.Esnault C., Maestre,J. and Heidmann,T. (2000) Human LINE retrotransposons generate processed pseudogenes. Nature Genet., 24, 363–367. [DOI] [PubMed] [Google Scholar]
- 28.Swergold G.D. (1990) Identification, characterization and cell specificity of a human LINE-1 promoter. Mol. Cell. Biol., 10, 6718–6729. [DOI] [PMC free article] [PubMed] [Google Scholar]
- 29.Kimberland M.L., Divorky,V., Prchal,J., Schan,U., Berger,W. and Kazazian,H.H.,Jr (1999) Full-length human L1 insertions retain the capacity for high frequency retrotransposition in cultured cells. Hum. Mol. Genet., 8, 1557–1560. [DOI] [PubMed] [Google Scholar]
- 30.Boissinot S., Entezam,A. and Furano,A.V. (2001) Selection against deleterious LINE-1-containing loci in the human lineage. Mol. Biol. Evol., 18, 926–935. [DOI] [PubMed] [Google Scholar]
- 31.Soifer S.H., Kazazian,H.H., Moran,J.V. and Kasahara,N. (2001) Stable integration of transgenes delivered by a retrotransposon-adenovirus hybrid vector. Hum. Gene Ther., 12, 1417–1428. [DOI] [PubMed] [Google Scholar]
- 32.Ostertag E.M., DeBerardinis,R.J., Goodier,J.L., Zhang,Y., Yang,N., Gerton,G.L. and Kazazian,H.H. (2002) A mouse model of human L1 retrotransposition. Nature Genet., 32, 655–660. [DOI] [PubMed] [Google Scholar]
- 33.LuningPrak E., Dodson,A.W., Farkash,E.A. and Kazazian,H.H. (2003) Tracking an embryonic L1 retrotransposition event. Proc. Natl Acad. Sci. USA, 100, 1832–1837. [DOI] [PMC free article] [PubMed] [Google Scholar]
- 34.Brouha B., Meischl,C., Ostertag,E., de Boer,M., Zhang,Y., Neijens,H., Roos,D. and Kazazian,H.H. (2002) Evidence consistent with human L1 retrotransposition in maternal meiosis I. Am. J. Hum. Genet., 71, 327–336. [DOI] [PMC free article] [PubMed] [Google Scholar]
- 35.Ostertag E.M., Luning Prak,E.T., DeBerardinis,R.J., Moran,J.V. and Kazazian,H.H. (2000) Determination of L1 retrotransposition kinetics in cultured cells. Nucleic Acids Res., 28, 1418–1423. [DOI] [PMC free article] [PubMed] [Google Scholar]
- 36.Luning Prak E.T., Traunstine,M., Huszar,D. and Weigert,M. (1994) Light chain editing in kappa-deficient animals: a potential mechanism of B cell tolerance. J. Exp. Med., 180, 1815–1815. [DOI] [PMC free article] [PubMed] [Google Scholar]
- 37.Wei W., Morrish,T.A., Alisch,R.S. and Moran,J.V. (2000) A transient assay reveals that cultured human cells can accommodate multiple LINE-1 retrotransposition events. Anal. Biochem., 284, 435–438. [DOI] [PubMed] [Google Scholar]
- 38.Dombroski B.A., Mathias,S.L., Nanthakumar,E., Scott,A.F. and Kazazian,H.H.,Jr. (1991) Isolation of an active human transposable element, Science, 254, 1805–1807. [DOI] [PubMed] [Google Scholar]
- 39.Dombroski B.A., Scott,A.F. and Kazazian,H.H.,Jr. (1993) Two additional potential retrotransposons isolated from a human L1 subfamily that contains an active retrotransposable element. Proc. Natl Acad. Sci. USA, 90, 6513–6517. [DOI] [PMC free article] [PubMed] [Google Scholar]
- 40.Skowronski J. and Singer,M.F. (1986) The abundant LINE-1 family of repeated DNA sequences in mammals: genes and pseudogenes. Cold Spring Harbor Symp. Quant. Biol., 51, 457–464. [DOI] [PubMed] [Google Scholar]
- 41.Gilbert N., Lutz-Prigge,S. and Moran,J.V. (2002) Genomic deletions created upon LINE-1 retrotransposition. Cell, 110, 315–325. [DOI] [PubMed] [Google Scholar]
- 42.Symer D.E., Connelly,C., Szak,S.T., Caputo,E.M., Cost,G.J., Parmigiani,G. and Boeke,J.D. (2002) Human L1 retrotransposition is associated with genetic instability in vivo. Cell, 110, 327–337. [DOI] [PubMed] [Google Scholar]
- 43.Ostertag E.M. and Kazazian,H.H.,Jr (2001) Twin priming: a proposed mechanism for the creation of inversions in L1 retrotransposition. Genome Res., 11, 2059–2065. [DOI] [PMC free article] [PubMed] [Google Scholar]
- 44.Smit A.F., Toth,G., Riggs,A.D. and Jurka,J. (1995) Ancestral, mammalian-wide subfamilies of LINE-1 repetitive sequences. J. Mol. Biol., 246, 401–417. [DOI] [PubMed] [Google Scholar]
- 45.Mathias S.L., Scott,A.F., Kazazian,H.H.,Jr and Boeke,J.D. (1991) Reverse transcriptase encoded by a human transposable element. Science, 254, 1808–1810. [DOI] [PubMed] [Google Scholar]
- 46.Lupas A., VanDyke,M. and Stock,J. (1991) Predicting coiled coils from protein sequences. Science, 252, 1162–1164. [DOI] [PubMed] [Google Scholar]
- 47.Rost B. and Sander,C. (1993) Prediction of protein secondary structure at better than 70% accuracy. J. Mol. Biol., 232, 584–599. [DOI] [PubMed] [Google Scholar]
- 48.Sali A. and Blundell,T.L. (1993) Comparative protein modeling by satisfaction of spatial restraints. J. Mol. Biol., 234, 779–815. [DOI] [PubMed] [Google Scholar]
- 49.Augustin M.A., Huber,R. and Kaiser,J.T. (2001) Crystal structure of a DNA-dependent RNA polymerase (DNA primase). Nature Struct. Biol., 8, 57–61. [DOI] [PubMed] [Google Scholar]
Associated Data
This section collects any data citations, data availability statements, or supplementary materials included in this article.


