

Abstract
Searching spectral libraries in tandem mass spectrometry (MS/MS) is an important new approach to improving the quality of peptide and protein identification. The idea relies on the observation that ion intensities in an MS/MS spectrum of a given peptide are generally reproducible across experiments, and thus, matching between spectra from an experiment and the spectra of previously identified peptides stored in a spectral library can lead to better peptide identification compared to the traditional database search. However, the use of libraries is greatly limited by their coverage of peptide sequences: even for well-studied organisms a large fraction of peptides have not been previously identified. To address this issue, we propose to expand spectral libraries by predicting the MS/MS spectra of peptides based on the spectra of peptides with similar sequences. We first demonstrate that the intensity patterns of dominant fragment ions between similar peptides tend to be similar. In accordance with this observation, we develop a neighbor-based approach which first selects peptides that are likely to have spectra similar to the target peptide and then combines their spectra using a weighted K-nearest neighbor method to accurately predict fragment ion intensities corresponding to the target peptide. This approach has the potential to predict spectra for every peptide in the proteome. When rigorous quality criteria are applied, we estimate that the method increases the coverage of spectral libraries available from the National Institute of Standards and Technology by 20–60%, although the values vary with peptide length and charge state. We find that the overall best search performance is achieved when spectral libraries are supplemented by the high quality predicted spectra.
1. Introduction
Liquid chromatography (LC) coupled with tandem mass spectrometry (MS/MS) is a widely used platform for high-throughput identification and quantification of proteins in biological samples [1, 2]. In addition to experimental steps in the pipeline, computational and statistical procedures play important roles in determining the content of the complex proteome sample. However, even with the best analytical platforms and modern software, only about 10–30% of spectra are identified in a typical experiment [3, 4]. In most situations this results in a large fraction of identified proteins (more than 50%) being covered by a single identified peptide, which weakens the confidence of protein identification [5–7].
There are several reasons for low identification coverage, involving biological, analytical and also computational factors. Biological samples may contain genomic variants, contaminants or enzymes with incompletely understood specificity and cleavage patterns. They may also contain a number of post-translationally modified proteins, some with yet unknown modifications. Analytical platform variations, e.g. the differences in sample preparation or the inherently stochastic nature of peptide elution, ion current variation in ionization sources, or the ability of a peptide to ionize and fragment well, are another notable source of variation. Analytical techniques can also introduce chemical modifications of several residues, e.g. oxidation of methionine and histidine, or cysteine alkylation. Similarly, a large number of peptides may be truncated before even reaching the mass spectrometer, resulting in the spectra of unexpectedly short peptides [8]. Most of these sources are aggregated via the concept of peptide detectability [9, 10] or the proteotypic property of peptides [11]. Finally, development of computational approaches for accurate identification of tandem mass spectra, estimating the false discovery rates of peptide-spectrum matches [12, 13], or inferring the identity and quantity of proteins [14], is still an open challenge. Among these, improving the quality and confidence of peptide-spectrum matching has the potential to directly impact biological discoveries.
There are two main strategies used for assigning peptide sequences to experimental MS/MS spectra. Depending on whether the reference protein sequences of the organism(s) under study are already known, these approaches are referred to as database searching or de novo sequencing [15]. Database searching strategies match experimental spectra with theoretical spectra corresponding to the peptides available in the database (for sequenced organisms), whereas de novo algorithms attempt to infer peptide sequences directly from experimental spectra; implicitly assuming that the search space contains all possible peptides within the mass/charge tolerance of the experimental spectra. In database search, it is expected that allowing for different fragment ion intensities in a theoretical spectrum will result in improved search outcomes. These intensities may be determined ad-hoc, as in SEQUEST [16], or using computational approaches that predict experimental spectra directly from peptide sequence [17–20]. One recently introduced approach, extending the ideas of small molecule identification, is that of spectral libraries [21–25], where the spectra of all identified peptides from previous experiments are aggregated into a library of consensus spectra corresponding to the identified peptides. Several approaches indicated that searching spectral libraries has the potential to identify more peptide sequences given the same database size. These studies resulted in hybrid algorithms that utilize spectral libraries for previously identified peptides and conventional database searches on the remaining spectra [26–28]. Recently, new algorithms have been developed to exploit differential ion intensities in matching experimental and theoretical spectra [29].
Since spectral libraries cover a relatively small fraction of peptide sequences, an alternative solution has been to in silico predict the fragment spectra. Several algorithms have been developed ranging from the kinetic models of peptide fragmentation [17, 18] to fully data-driven algorithms [19, 20, 30–32]. Recently, Li et al. investigated the variability of tandem mass spectra of identical peptides and showed that spectral reproducibility in the same experiment (i.e. in the same run) is significantly higher than over different experiments (i.e. over different runs and different labs), even for the same analytical procedure [20]. They also concluded that algorithms such as MassAnalyzer [17, 18] and PeptideART [20] provide predictions that consistently exceed 70% of the correlation level achieved by the spectral reproducibility of identified peptides. Venable and Yates have also shown that the variance of peptide-spectrum match scores is dependent on both the peptide sequence and its quantity [33].
In this work, we study ion intensity patterns in CID spectra from similar peptides. We show that the intensities of fragment ions can be accurately predicted using a weighted average of the spectra from peptides of the same length and similar (neighboring) sequences whose consensus spectra were already collected in spectral libraries. We then compare this neighbor-based approach with both database search and spectral library methods that rely on predicted intensities of fragment ions [17, 18] and demonstrate that our approach provides an improvement in peptide identification.
2. Methods
2.1. Tandem mass spectrometry data
We used peptide tandem mass spectral libraries provided by the National Institute of Standards and Technology (NIST; http://peptide.nist.gov/). These libraries are comprised of consensus spectra that were obtained by processing individual spectra from multiple samples and experiments. NIST currently provides spectral libraries for nine species (H. sapiens, M. musculus, D. melanogaster, C. elegans, S. cerevesiae, E. coli, D. radiodurans, M. smegmatis and R. norvegicus) from ion trap platforms. The matched spectra were annotated by labeling conventional product ions, along with the immonium ions, internal ions and common neutral loss ions. In cases of ambiguous peak assignments (NIST allows up to two different ion types per peak), we picked the top annotation. The library also contains post-translationally modified peptides; however, in this work only unmodified peptides were considered. Peptides with cysteine carbamidomethylation were excluded as only a subset of cysteine-containing peptides were modified. Basic statistics of the NIST Library are summarized in Table 1.
Table 1.
NIST spectral library statistics.
| Species | Number of spectra | Spectra +2 | Spectra +3 |
|---|---|---|---|
| H. sapiens | 159,664 | 113,323 | 46,341 |
| M. musculus | 75,856 | 56,463 | 19,393 |
| D. melanogaster | 55,009 | 39,458 | 15,551 |
| C. elegans | 48,432 | 34,029 | 14,403 |
| S. cerevesiae | 41,533 | 31,165 | 10,368 |
| E. coli | 31,953 | 23,197 | 8,756 |
| D. radiodurans | 5,106 | 3,988 | 1,118 |
| M. smegamatis | 3,107 | 1,908 | 1,199 |
| R. norvegicus | 12,582 | 8,839 | 3,743 |
| Total spectra (unique peptides) | 312,370 (283,122) | 120,872 (112,564) |
We converted the original consensus spectra stored in the .msp files into vectors of annotated ion intensities, referred to here as standard spectra. Given any peptide of length l and a particular charge state, a standard spectrum corresponds to a fixed-length vector representation of the intensities of the particular types of fragment ions. A standard spectrum for a doubly charged precursor ion contains the peaks of the following product ions: b, y, b–18, y–18, b–17, y–17, b–35, y–35, b+18, a, b++, [b–18]++, [b–17]++, [b+18]++, y++, [y–18]++, [y–17]++, b–43, b–44, b–45, b–46, [b–43]++, [b–44]++, [b–45]++, [b–46]++, y–43, y–44, y–45, y–46, [y–43]++, [y–44]++, [y–45]++, [y–46]++ for each fragmentation site and prec–18, prec–17, prec–35, prec–36, prec–45, prec–46 for the neutral loss ions derived from the precursor ion. Ions that were absent from the original spectra were assigned zero intensity in the standard spectrum. For a triply charged precursor, fragment ions b+++, y+++, [b–18]+++, [y–18]+++, [b–17]+++, [b–43]+++, [b–44]+++, [b–45]+++, [b–46]+++ were also considered. Therefore, for charge +2, the dimension of the standard spectrum vector was 33·(l – 1) + 6; for charge +3, the dimension of the vector was 42·(l –1) + 6, where l is the peptide length. If the same peptide was found in multiple species/libraries, the consensus spectrum with the most peaks was used. In this work, l ∈ {7, 8, …, 20} for +2 precursors and l ∈ {12, 13, …, 25} for +3 precursors.
Mosquito data set
The Aedes albopictus C6/36 cell line was cultured under appropriate conditions (1xMEM supplemented with 10% fetal bovine serum, non-essential amino acids, L-glutamine and antibiotic/antimycotic solution in the presence of 5% CO2) prior to subcellular fractionation into nuclear, cytoplasmic and membranous fractions via mechanical disruption and centrifugation. Membrane fractions, normalized to cell number, were resolved using SDS-PAGE preceding gel excision. Gel slices were treated with Solution I (25mM ammonium bicarbonate prepared in 50% acetonitrile) prior to desiccation and rehydration with Solution II (25mM ammonium bicarbonate) and in gel trypsin digestion overnight at 37°C. Peptide fragments were eluted using Solution III (50% acetonitrile and 5% formic acid) via sonication prior to sample concentration via vacuum drying.
Digested samples were diluted with 20 microliters of LC solvent A (98% water, 2% acetonitrile, 0.1% formic acid). Four microliters of each sample was analyzed by nanoLC-MS/MS on an Eksigent nanoLC-2D coupled to a Thermo LTQ-orbitrap XL. A 60-minute gradient from 95% solvent A to 60% solvent B (acetonitrile with 0.1% formic acid) was used that provided separation of the peptides. The mass spectrometer was set up to capture one MS scan followed by MS/MS spectra for the top five precursor ions. Dynamic exclusion was employed such that if the same precursor m/z is selected twice within 15 seconds it is excluded from selection for 30 seconds. Overall, the data set contained 85,016 doubly and 67,568 triply charged MS/MS spectra.
2.2. Problem formulation and classification model
Given a spectral library
 = {(pi, si)}, where pairs (pi, si) represent peptides with their standard consensus spectra (peptide-spectrum pairs; PSPs), our goal is to predict the spectrum s that corresponds to any previously unseen peptide p. We seek to express the predicted spectrum ŝ of p as a weighted average of a subset of spectra from
that are expected to be most similar to s. More specifically, the prediction is made using a weighted K-nearest neighbor formulation as
= {(pi, si)}, where pairs (pi, si) represent peptides with their standard consensus spectra (peptide-spectrum pairs; PSPs), our goal is to predict the spectrum s that corresponds to any previously unseen peptide p. We seek to express the predicted spectrum ŝ of p as a weighted average of a subset of spectra from
that are expected to be most similar to s. More specifically, the prediction is made using a weighted K-nearest neighbor formulation as
| (1) |
where K is a positive integer, {wk} is a set of weights, and {sk} is a set of K spectra in
that are most similar to s. Because s is unknown, it is necessary to find {sk} and determine weights {wk} based on the sequence of peptide p and a set of peptides from
that have the same length as p.
To determine the parameters from Eq. (1), we first define a measure of similarity between standard spectra. The spectral similarity ρ between spectra si and sj corresponding to some equal-length peptides is measured using the cosine function. That is,
where 〈 u,v 〉 is a dot product between two vectors and is a Euclidean norm of vector u. Because all elements of a standard spectrum are non-negative, it holds that 0 ≤ ρ(si,s j ) ≤ 1.
Generally, each weight wk in Eq. (1) should be proportional to ρ(s,sk ). To achieve this, we constructed a classification model to approximate the spectral similarity function from peptide sequences only. This procedure enabled us to select the K spectra that were expected to be most similar to s as well as the set of weights {wk}. Formally, given two equal-length peptides pi and pj, a classification model was trained to provide a similarity score ρ( pi, p j ) between spectra si and sj corresponding to pi and pj, respectively.
The scoring function σ was learned using a training set {(xi, yi )}, where xi was a vector encoding a pair of peptide sequences and . The class label was set to y = +1 if and yi = −1 if . That is, the positive set and negative set were comprised of pairs of peptides with very similar and very dissimilar spectra. Setting ρhigh = ρlow would utilize all data points (pairs of peptides of the same length). Vector xi was constructed using peptide sequences only. Considering that both peptides were of length l, another string of length l could be constructed over an extended alphabet corresponding to the pairs of amino acid symbols that were found at each position (there are 210 such symbols, e.g. AA, AC, AD, etc.). Vector xi represented a binary encoding of this string as well as the Hamming distance (normalized by l) between and ; it results in a sparse vector of dimension 210·l +1 (except for the normalized Hamming distance, only l elements in each data point xi were set to 1, while the remaining elements were 0). Note that the order of the two amino acids is not relevant; that is, AD and DA correspond to the same symbol in the extended alphabet.
We trained Support Vector Machines (SVMs) using the SVMlight software [34]. We used default SVMlight parameters on a balanced data set of positive and negative data points (note that a separate classifier was trained for each peptide length l). To minimize the chance of overfitting, we used the linear kernel function. The output of a trained SVM was further mapped to a 0–1 interval using the sigmoid function [35]. Thus, the similarity function ρ was approximated using the soft outputs of a classification model.
The weight wk associated with sk was determined by the rank rk of the SVM score σ (p, pk ) among the top K scoring PSPs (those with the highest scores σ). Here we used an exponentially decaying function
where rk ∈{1,2,…K}. We also define a confidence score reflecting the reliability of the prediction ŝ as the average of the SVM scores of the nearest neighbors of peptide p. That is,
| (2) |
where {pk} is a set of K peptides in
with highest SVM scores σ (p, pk ) relative to the target peptide. This confidence score is expected to be higher for more similar peptides and was used to determine the quality of the predicted spectrum.
2.3. Performance evaluation
The performance of the classification model and spectrum prediction was evaluated using 10-fold cross-validation. Specifically, the set of PSPs
= {(pi, si)} was split into ten disjoint partitions. Then, in each step of the process the accuracy of the spectrum prediction was evaluated on PSPs in one (test) partition using the scoring function trained on pairs of PSPs from the other nine partitions (training). However, the neighbors for constructing a spectrum were selected from the entire spectral library. The classifier performance was estimated using the area under the ROC curve. On the other hand, the performance of the spectrum prediction was evaluated using the spectral similarity between the observed spectrum s and the predicted spectrumŝ, i.e. ρ(s,ŝ), as well as spectral library search.
To assess the performance of the predicted spectra in an actual proteomics search, we created two duplicate NIST libraries where all peptide sequences were kept but the original consensus spectra were replaced by the predicted spectra. The first duplicate library (NISTKNN) was constructed using the weighted K-nearest neighbor approach using the training and test sets (to avoid overfitting) from the 10-fold cross-validation described above. The second duplicate library (NISTMA) was generated using MassAnalyzer [17, 18] with the default parameters, and was used to evaluate whether the neighbor-based approach provides advantages compared to the kinetic model for prediction of peak intensities. All libraries were separated by precursor charge and contained 283,122 PSPs for charge +2 and 112,564 for charge +3. Spectral searches were then performed on a human cell line data set [3] to evaluate the performance of NIST, NISTKNN, and NISTMA libraries. For this purpose, we used the SpectraST software [24] with the default parameters.
For each library, an equal-size decoy library was generated using SpectraST’s create mode, which first annotates each peak in each peptide-spectrum pair, and then shuffles the corresponding peptide sequence and repositions the peaks according to the shuffled sequence [36]. The query spectra were searched against a combined target/decoy library. The false discovery rate (FDR) was estimated using the decoy count method; that is,
where FP is the number of hits to decoy and TP is the number of hits to the target library.
As an additional comparison, we performed a sequence database search using InsPecT [37] on the same query spectra. Two sequence databases in the FASTA format were created for charge +2 (length 7 to 20) and +3 (length 12 to 25) separately, in which each peptide sequence from the corresponding target spectral library was represented as an entry. A corresponding equal-size decoy database was created by shuffling each peptide in the target database, but keeping K, R and P in their original positions to maintain the number of tryptic termini. To ensure each peptide sequence was considered as a single candidate we set the protease option to trypsin and RequireTermini option to 2. Default parameters were used except that the precursor mass tolerance (PMTolerance) was set to 3 and 4.5 Da for charges +2 and +3, respectively, to match SpectraST’s 1.5 Da/e precursor m/z tolerance. Note that we removed all peptides with missed cleavage sites from all libraries/databases to ensure that the search space between spectral and sequence search were equal. This resulted in 223,392 doubly and 62,600 triply charged spectra in the final data set.
3. Results
3.1. Peptides with similar sequence have similar standard spectra
Because fragmentation of peptides is highly dependent on amino acid sequence [38], peptides with similar sequences can be expected to have similar standard spectra. To test this hypothesis we examined all pairs of equal-length peptides and calculated the spectral similarity between their standard spectra as a function of the number of amino acid mismatches (Hamming distance) between peptides. In Figure 1A we show that the average spectral similarity monotonically decreases with the Hamming distance between peptides, suggesting that sequence similarity is indeed predictive of spectral similarity. This result also justifies the inclusion of multiple sequence neighbors in the candidate set in increasing order of the Hamming distance between two peptides (similarity of spectra for peptides with one mismatch has been recently studied by Hu et al. [39]). Figure 1B shows that values of spectral similarity follow an extreme value-like distribution, with the majority of peptide pairs having moderately low (0.3 to 0.4) similarity values. We note that Figure 1 corresponds to the doubly charged peptides of length 20 (8,934 peptides); however, similar trends were observed for all other lengths and charge states (Figure S1; Supplementary Materials).
Figure 1.

The spectral similarity of standard spectra corresponding to all pairs of doubly charged peptides of length 20. (A) Spectral similarity between standard spectra, averaged over pairs with Hamming distance d, where d ∈ {1, 2, …, 20}; (B) Histogram of all spectral similarity values.
3.2. Evaluation of the spectral similarity scoring function
As illustrated in Figure 1, simple sequence-based features such as the Hamming distance are predictive of spectral similarity between peptides. Other studies have also shown that the frequency of a peptide bond’s fragmentation in CID depends on the identity of amino acids N- or C-terminal to it [30, 40]. A standard example is the preference of proline (P) on the C-terminal side of the fragmentation site, which suggests that the presence of proline induces an intense peak corresponding to the peptide bond fragmentation N-terminal from the proline. Consequently, a strong peak may be lost due to a P-to-non-P substitution. Another observation, illustrated in Figure S2 (Supplementary Materials), is that the most influential amino acids on the similarity between two spectra are generally located in the middle of the sequence for longer peptides, and towards N-terminus for shorter peptides. This may be a consequence of the fact that the ions of particular lengths account for most of the overall intensity (Figure S3; Supplementary Materials).
Although these relatively simple empirical rules offer clues as to how the fragmentation spectrum is influenced by the composition of amino acids and their location along the peptide sequence, they are difficult to combine in the presence of multiple changes. Rather than manually selecting features that potentially are predictive of spectral similarity (e.g. the number of substitutions, the presence/absence of a P-to-non-P substitution), a similarity function was learned. The sparse binary data representation was selected to incorporate both amino acid differences and their locations in the pairs of peptides.
We assessed the performance of the scoring function and spectrum prediction using a cross-validation approach as described in Section 2.3. The parameters ρhigh and ρlow were set so that each model used top 5% and bottom 5% of the available data. The areas under the ROC curves (AUCs) for all models are shown in Table S1 (Supplementary Materials). Various properties of the predictors in terms of spectral similarity were also analyzed and presented in Figure 2.
Figure 2.
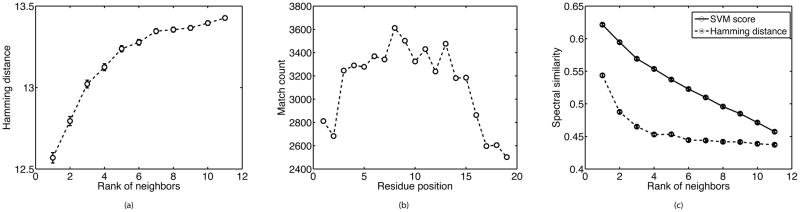
For each target peptide p (with standard spectrum s) of length 20, the similarity scores σ (p, pk ) between p and a top neighbors pk (with standard spectra sk) were predicted; k ∈ {1, 2, …, K}. We consider K = 11 and precursor ion charge of +2. (A) The Hamming distance between p and pk, averaged over all p’s, as a function of the rank of pk ’s predicted similarity. Note that because the majority of peptides do not have close neighbors, the average Hamming distance is generally high for all top-scoring peptides; (B) The number of times p and its nearest neighbor (with largest predicted similarity) have an identical amino acid at position i (match count) where i ∈ {1,2, …, 19}; position 20 is ignored because it is either K or R. Match count is summed over all p’s ; (C) The spectral similarity between s and sk, averaged over all p’s, as a function of the rank of pk ’s predicted similarity (solid line), or as a function of the rank of pk ’s Hamming distance in ascending order (dashed line).
As shown in Figure 2A, neighbors with higher SVM scores have on average smaller Hamming distance relative to their target. Figure 2B shows that the distribution of influential amino acids along the alignment between each target peptide and its highest scoring neighbor (i.e. peptide with the largest predicted SVM score) has the same trend as observed in Figure S2. In addition, as depicted in Figure 2C, the spectral similarity between a target’s and a neighbor’s standard spectrum is on average higher for neighbors with higher SVM scores, suggesting that the learned scoring function provides an effective estimate of the spectral similarity between two peptides. Although similar trends are observed by using only the Hamming distance as a feature, the learned scoring function is more predictive of the spectral similarity than the Hamming distance alone.
We further studied how well the predicted SVM score σ ( p1, p2) agrees with the actual spectral similarity ρ(s1,s2 ). A heat map depicting these two quantities is shown in Figure S4 (Supplementary Materials), indicating that the predicted similarity score positively correlates with the actual similarity (Pearson correlation coefficient: 0.43).
3.3 Evaluation of spectrum prediction
We calculated the average spectral similarity between predicted and true standard spectra for peptides with different lengths and charges (Table S1; Supplementary Materials). The accuracy of predicting the spectrum of a target peptide depends not only on the discriminating power of the classification model, but also on the neighbors that can be found in a spectral library and used to synthesize a target spectrum. In particular, the target sequences for which a better set of neighbors can be found should be expected to have better predictions of their standard spectra. To verify this, we calculated the confidence score for each target peptide as described in Methods, in addition to evaluating the prediction accuracy. The relationship between these two quantities is shown in Figure S5 (Supplementary Materials), indicating that prediction accuracy can be inferred from the confidence score. For example, the average spectral similarity for the subsets of predictions with confidence scores greater than 10th, 50th, and 90th percentile of the distribution were 0.751, 0.782, and 0.814, respectively. We believe that the low spectral prediction quality for some target peptides is due to the lack of good quality neighbors in spectral libraries (e.g. for target sequences not similar to any sequence in a library), which suggests that the neighbor-based approach may not be appropriate for predicting spectra of these peptides.
We also investigated the influence of parameter K, which controls the number of neighbors used in the construction of the predicted spectrum and estimating the confidence of prediction. The average spectral similarity between predicted and observed spectra as a function of K (Figure S6; Supplementary Materials), however, did not show significant variation. Thus, we determined that K = 11 provided a good balance between speed and accuracy of prediction for all lengths and charges.
3.4. Assessment of predicted spectra in spectral library searches
The usefulness of predicted spectra was evaluated in two different spectral library and database searches. We first used a large set of spectra derived from a human cell line and searched it against three spectral libraries (NIST, NISTKNN, and NISTMA) and a sequence database. The sample comes from an extract of the human erythroleukemia cell line K562, where trypsin-digested peptides were eluted by a multistage gradient (Agilent 1100 Series HPLC) into electrospray ionization source of an LCQ ion trap mass spectrometer [3]. This set of identified spectra had already been included in the NIST spectral library; thus, the NIST library had an unfair advantage over its counterparts that used predicted spectra. However, it remained useful for estimating the empirical upper limits of identification.
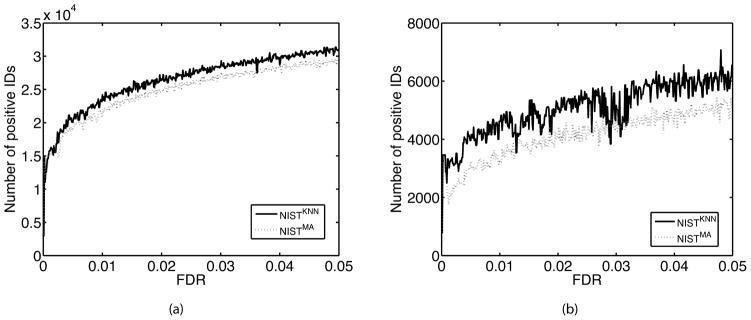
Figure 3A–B shows that both predicted spectral libraries outperformed the sequence database search. This is probably because SpectraST’s scoring function [24] has utilized information of well-predicted peak intensities to improve the scores for the correct PSPs. We also compared the unique peptide identifications between predicted and real libraries at 1% FDR estimated by using a target-decoy search approach. The Venn diagrams in Figure 3C–D show that the predicted and real libraries have a large number of overlapping unique peptide identifications, while the real (NIST) library still has most unique identifications.
Figure 3.

Comparing sensitivity of spectral library search (NIST, NISTKNN, and NISTMA) and sequence database search (InsPecT). The number of positive identifications plotted as a function of FDR for charge +2 (A) and +3 (B). Venn diagrams corresponding to the unique peptide identifications for charge +2 (C) and +3 (D).
We then investigated the nature of the set of unique peptides that were identified in the NIST library but missed by the NISTKNN library. As shown in Table S2 (Supplementary Materials), the average spectral similarity between predicted and real standard spectra was higher for peptides identified in both NISTKNN and NIST than for peptides identified only in NIST. In addition, the average confidence scores for the peptides identified only by NIST were comparatively lower (Table S2), which suggests that confidence scores can be used to select high quality predicted spectra. To evaluate this, we searched the same query spectra against smaller spectral libraries consisting of subsets of predicted spectra with high confidence scores (we used the 50%, 40%, 30%, 20% and 10% of spectra with the highest confidence scores). As shown in Figure 4, spectral search against these smaller NISTKNN libraries resulted in noticeably more identifications than against NISTMA libraries with the same search space.
Figure 4.
Comparing sensitivity of spectral search on NISTKNN and NISTMA with equal search space corresponding to the 20% of the most confident predictions in NISTKNN for (A) charge +2 and (B) charge +3 precursor ions. This resulted in 56,642 out of 283,122 peptides ions for charge +2 and 22,528 out of 112,564 peptide ions for charge +3. The same set of peptide ions were then selected from the NISTMA for the parallel spectral search. To minimize the impact of decoy library (randomly shuffled peptide sequences) on small target libraries, we generated 50 decoy libraries using SpectraST and performed 50 independent searches in which the target library was appended with each decoy library. The numbers of positive IDs at each FDR cutoff were averaged over all 50 runs.
The increase in coverage of three well-studied proteomes for the situations when high-confidence predicted libraries can be created is shown in Table 2. These results indicate that the approach is practically useful for improving peptide identification.
Table 2.
The number of peptides in various proteomes additionally covered with high-confidence spectral predictions of the neighbor-based approach. Three thresholds for the confidence level were considered: top 10%, top 20% and top 30% of predicted spectra.
| Table 2A | |||||
|---|---|---|---|---|---|
| Human | |||||
| +2 | Length | Covered by NIST | Covered by the neighbor approach | ||
| Top 10% | Top 20% | Top 30% | |||
| 7–20 | 113,323 | 23,176 | 50,479 | 80,117 | |
| 7–10 | 37,939 | 9,289 | 21,953 | 36,654 | |
| 11–15 | 50,857 | 9,478 | 18,974 | 28,324 | |
| 16–20 | 24,527 | 4,409 | 9,552 | 15,139 | |
| +3 | Length | Covered by NIST | Covered by the neighbor approach | ||
| Top 10% | Top 20% | Top 30% | |||
| 12–25 | 46,341 | 10,629 | 23,118 | 37,618 | |
| 12–15 | 15,666 | 3,974 | 8,094 | 13,374 | |
| 16–20 | 18,878 | 5,329 | 11,805 | 18,469 | |
| 21–25 | 11,797 | 1,326 | 3,219 | 5,775 | |
| Table 2B | |||||
|---|---|---|---|---|---|
| Fly | |||||
| +2 | Length | Covered by NIST | Covered by the neighbor approach | ||
| Top 10% | Top 20% | Top 30% | |||
| 7–20 | 39,458 | 3,200 | 8,436 | 20,216 | |
| 7–10 | 11,490 | 2,069 | 5,158 | 8,820 | |
| 11–15 | 18,580 | 2,500 | 4,954 | 7,384 | |
| 16–20 | 9,388 | 1,175 | 2,570 | 4,012 | |
| +3 | Length | Covered by NIST | Covered by the neighbor approach | ||
| Top 10% | Top 20% | Top 30% | |||
| 12–25 | 15,551 | 2,450 | 5,423 | 8,817 | |
| 12–15 | 4,256 | 822 | 1,713 | 2,903 | |
| 16–20 | 6,594 | 1308 | 2,959 | 4,579 | |
| 21–25 | 4,701 | 320 | 751 | 1,335 | |
| Table 2C | |||||
|---|---|---|---|---|---|
| Yeast | |||||
| +2 | Length | Covered by NIST | Covered by the neighbor approach | ||
| Top 10% | Top 20% | Top 30% | |||
| 7–20 | 31,165 | 4,185 | 10,736 | 26,552 | |
| 7–10 | 10,893 | 2,849 | 7,190 | 12,098 | |
| 11–15 | 13,866 | 3,142 | 6,360 | 9,476 | |
| 16–20 | 6,406 | 1,492 | 3,166 | 4,978 | |
| +3 | Length | Covered by NIST | Covered by the neighbor approach | ||
| Top 10% | Top 20% | Top 30% | |||
| 12–25 | 10,368 | 2,590 | 6,111 | 10,181 | |
| 12–15 | 3,100 | 875 | 1,928 | 3,336 | |
| 16–20 | 4,299 | 1,361 | 3,258 | 5,183 | |
| 21–25 | 2,969 | 354 | 925 | 1,662 | |
Finally, to evaluate spectral identification in less well studied organisms and using unequal search spaces we performed a spectral library search on the set of experimental spectra from an in-house mosquito sample (Section 2.1). As shown in Figure 5, at equal (but small) search space the NIST library resulted in slightly more peptide identifications than its predicted counterpart NISTKNN. However, the predicted libraries MosquitoKNN and MosquitoKNN-80% led to a significantly larger number of identifications than NIST even though they contain only predicted spectra. This suggests that a substantial expansion in search space compensates for the decrease in quality of predicted spectra. In particular, the 85-fold increase in the search space of the MosquitoKNN library resulted in three times more identifications at 1% FDR compared to NIST, whereas MosquitoKNN-80% almost doubled the number of identifications with only a 14-fold increase in search space. This is possibly because MosquitoKNN-80% contains a higher quality predicted spectra than MosquitoKNN and thus it achieves a better trade-off between the search space size and spectral quality. We also observe that the search of a hybrid library, which contained real spectra of NIST-covered peptides and predicted spectra of the remaining mosquito peptides, resulted in even larger number of identifications than the search of MosquitoKNN.
Figure 5.

Comparison of spectral library searches with unequal search space. The numbers of positive identifications are plotted as a function of FDR for each of the seven libraries; the same types of lines indicate the same search space between groups of libraries. NIST and NISTKNN are spectral libraries described in Section 2.3. MosquitoKNN contained predicted spectra of all tryptic peptides (length 7–20 for charge +2 and 12–25 for +3) from the set of A. aegypti proteins in Swiss-Prot, and MosquitoKNN-80% was a subset of MosquitoKNN in which the predicted spectra had confidence scores greater than the 80th percentile threshold. MosquitoMA and MosquitoMA-80% were counterparts of MosquitoKNN and MosquitoKNN-80%, respectively, but the spectra were generated using MassAnalyzer. Hybrid was a library in which NIST spectral library was combined with MosquitoKNN; if a peptide sequence was present in both libraries, the spectrum from NIST was retained. In total, the set of A. aegypti peptides contained 395,213 tryptic peptides, of which 4,685 were present in NIST. MosquitoKNN-80% and MosquitoMA-80% each contained 65,346 peptides.
4. Discussion
In this study we present evidence that similar peptides generally produce fragmentation spectra with similar ion intensities of the corresponding product ions. We then exploit this observation to develop a novel neighbor-based method for predicting peak intensities of the product ions in a CID fragmentation spectrum. Finally, we demonstrate that the spectral libraries built from the predicted spectra can be used to improve peptide identification over a standard sequence database search.
The analysis of similarities of standard spectra corresponding to peptides of various lengths revealed some interesting findings. For example, we noticed that most short peptides (l ∈ {7, 8}) have very similar standard spectra regardless of the peptide sequence. Such peptides usually have higher peaks corresponding to the b2 and yl−2 ions for +2 and ions for +3 precursors (Figure S3). This effect, however, diminishes for longer peptides (l ≥ 12 for +2 and l ≥ 23 for +3 precursor ions; Figure S3).
Current approaches addressing the prediction of ion intensities in MS/MS spectra are based on two strategies: modeling of the basic chemistry of peptide fragmentation and data-driven strategies in which machine learning is used to train predictors from a large collection of peptide-spectrum pairs. While accurate, both of these approaches encounter problems, stemming from either incomplete understanding of chemistry of peptide ionization and fragmentation or because they rely on de novo learning of the rules of peptide fragmentation in a data-driven manner. The neighbor-based approach presented here exploits experimental spectra of previously identified peptides and, importantly, has the ability to estimate the accuracy of prediction based on the types of neighbors it utilized for prediction. Thus, our method extends spectral library-based search algorithms beyond previously identified spectra.
Previous studies provided evidence that spectral library searching was superior to a traditional database search and that the use of the kinetic model for predicting fragmentation spectra provided only minor advantages over the traditional database search [41, 42]. The results of our study, however, suggest that the prediction of intensities of fragment ions does improve peptide identification at equal search space (Figure 3), although we note that the methods for spectral library search and database search use different methods for estimating FDR.
While real and predicted spectral libraries provide better performance than conventional database search at equal search space, it is of greater interest to compare their performance in a more realistic application scenario. Our results suggest that for well-studied organisms with high spectral coverage of all detectable peptides, spectral library searches should be expected to outperform conventional database searches (Figure 3). On the other hand, for organisms with low coverage, the peptide identification process can significantly benefit if a high quality predicted library can be generated (Figure 5). In such situations, our results show that the best performance is achieved using hybrid libraries, i.e. libraries where a real spectral library available for an organism is complemented with high quality predicted spectra for the remaining peptides. We also suggest that the estimated quality of predicted spectra may be useful for developing more powerful peptide-spectrum matching algorithms. Generally, such approaches should lead to improved peptide and protein identification with impacts on studies ranging from fundamental biology to human disease intervention.
Supplementary Material
Acknowledgments
We thank the three anonymous reviewers for their constructive comments that improved the quality of this work and its presentation. We also thank Wyatt Clark for proofreading the manuscript. This work was supported by the National Institutes of Health Grants R01 RR024236-01A1 and R01 AI0090007, as well as the National Cancer Institute Grant U24 CA126480-01.
Footnotes
Software and data: www.informatics.indiana.edu/predrag/files/knnspectra.zip
References
- 1.Aebersold R, Mann M. Mass spectrometry-based proteomics. Nature. 2003;422(6928):198–207. doi: 10.1038/nature01511. [DOI] [PubMed] [Google Scholar]
- 2.Cravatt BF, Simon GM, Yates JR., 3rd The biological impact of mass-spectrometry-based proteomics. Nature. 2007;450(7172):991–1000. doi: 10.1038/nature06525. [DOI] [PubMed] [Google Scholar]
- 3.Resing KA, Meyer-Arendt K, Mendoza AM, Aveline-Wolf LD, Jonscher KR, Pierce KG, Old WM, Cheung HT, Russell S, Wattawa JL, et al. Improving reproducibility and sensitivity in identifying human proteins by shotgun proteomics. Anal Chem. 2004;76(13):3556–3568. doi: 10.1021/ac035229m. [DOI] [PubMed] [Google Scholar]
- 4.Yen CY, Russell S, Mendoza AM, Meyer-Arendt K, Sun S, Cios KJ, Ahn NG, Resing KA. Improving sensitivity in shotgun proteomics using a peptide-centric database with reduced complexity: protease cleavage and SCX elution rules from data mining of MS/MS spectra. Anal Chem. 2006;78(4):1071–1084. doi: 10.1021/ac051127f. [DOI] [PubMed] [Google Scholar]
- 5.Resing KA, Ahn NG. Proteomics strategies for protein identification. FEBS Lett. 2005;579(4):885–889. doi: 10.1016/j.febslet.2004.12.001. [DOI] [PubMed] [Google Scholar]
- 6.States DJ, Omenn GS, Blackwell TW, Fermin D, Eng J, Speicher DW, Hanash SM. Challenges in deriving high-confidence protein identifications from data gathered by a HUPO plasma proteome collaborative study. Nat Biotechnol. 2006;24(3):333–338. doi: 10.1038/nbt1183. [DOI] [PubMed] [Google Scholar]
- 7.Li YF, Radivojac P. Computational approaches to protein inference in shotgun proteomics. BMC Bioinformatics. doi: 10.1186/1471-2105-13-S16-S4. in press. [DOI] [PMC free article] [PubMed] [Google Scholar]
- 8.Alves P, Arnold RJ, Clemmer DE, Li Y, Reilly JP, Sheng Q, Tang H, Xun Z, Zeng R, Radivojac P. Fast and accurate identification of semi-tryptic peptides in shotgun proteomics. Bioinformatics. 2008;24(1):102–109. doi: 10.1093/bioinformatics/btm545. [DOI] [PubMed] [Google Scholar]
- 9.Tang H, Arnold RJ, Alves P, Xun Z, Clemmer DE, Novotny MV, Reilly JP, Radivojac P. A computational approach toward label-free protein quantification using predicted peptide detectability. Bioinformatics. 2006;22(14):e481–e488. doi: 10.1093/bioinformatics/btl237. [DOI] [PubMed] [Google Scholar]
- 10.Li YF, Arnold RJ, Tang H, Radivojac P. The importance of peptide detectability for protein identification, quantification, and experiment design in MS/MS proteomics. J Proteome Res. 2010;9(12):6288–6297. doi: 10.1021/pr1005586. [DOI] [PMC free article] [PubMed] [Google Scholar]
- 11.Kuster B, Schirle M, Mallick P, Aebersold R. Scoring proteomes with proteotypic peptide probes. Nat Rev Mol Cell Biol. 2005;6(7):577–583. doi: 10.1038/nrm1683. [DOI] [PubMed] [Google Scholar]
- 12.MacCoss MJ. Computational analysis of shotgun proteomics data. Curr Opin Chem Biol. 2005;9(1):88–94. doi: 10.1016/j.cbpa.2004.12.010. [DOI] [PubMed] [Google Scholar]
- 13.Noble WS. How does multiple testing correction work? Nat Biotechnol. 2009;27(12):1135–1137. doi: 10.1038/nbt1209-1135. [DOI] [PMC free article] [PubMed] [Google Scholar]
- 14.Nesvizhskii AI, Aebersold R. Interpretation of shotgun proteomic data: the protein inference problem. Mol Cell Proteomics. 2005;4(10):1419–1440. doi: 10.1074/mcp.R500012-MCP200. [DOI] [PubMed] [Google Scholar]
- 15.Steen H, Mann M. The ABC’s (and XYZ’s) of peptide sequencing. Nat Rev Mol Cell Biol. 2004;5(9):699–711. doi: 10.1038/nrm1468. [DOI] [PubMed] [Google Scholar]
- 16.Yates JR, 3rd, Eng JK, McCormack AL, Schieltz D. Method to correlate tandem mass spectra of modified peptides to amino acid sequences in the protein database. Anal Chem. 1995;67(8):1426–1436. doi: 10.1021/ac00104a020. [DOI] [PubMed] [Google Scholar]
- 17.Zhang Z. Prediction of low-energy collision-induced dissociation spectra of peptides. Anal Chem. 2004;76(14):3908–3922. doi: 10.1021/ac049951b. [DOI] [PubMed] [Google Scholar]
- 18.Zhang Z. Prediction of low-energy collision-induced dissociation spectra of peptides with three or more charges. Anal Chem. 2005;77(19):6364–6373. doi: 10.1021/ac050857k. [DOI] [PubMed] [Google Scholar]
- 19.Elias JE, Gibbons FD, King OD, Roth FP, Gygi SP. Intensity-based protein identification by machine learning from a library of tandem mass spectra. Nat Biotechnol. 2004;22(2):214–219. doi: 10.1038/nbt930. [DOI] [PubMed] [Google Scholar]
- 20.Li S, Arnold RJ, Tang H, Radivojac P. On the accuracy and limits of peptide fragmentation spectrum prediction. Anal Chem. 2011;83(3):790–796. doi: 10.1021/ac102272r. [DOI] [PMC free article] [PubMed] [Google Scholar]
- 21.Yates JR, 3rd, Morgan SF, Gatlin CL, Griffin PR, Eng JK. Method to compare collision-induced dissociation spectra of peptides: potential for library searching and subtractive analysis. Anal Chem. 1998;70(17):3557–3565. doi: 10.1021/ac980122y. [DOI] [PubMed] [Google Scholar]
- 22.Craig R, Cortens JP, Beavis RC. The use of proteotypic peptide libraries for protein identification. Rapid Commun Mass Spectrom. 2005;19(13):1844–1850. doi: 10.1002/rcm.1992. [DOI] [PubMed] [Google Scholar]
- 23.Frewen BE, Merrihew GE, Wu CC, Noble WS, MacCoss MJ. Analysis of peptide MS/MS spectra from large-scale proteomics experiments using spectrum libraries. Anal Chem. 2006;78(16):5678–5684. doi: 10.1021/ac060279n. [DOI] [PubMed] [Google Scholar]
- 24.Lam H, Deutsch EW, Eddes JS, Eng JK, King N, Stein SE, Aebersold R. Development and validation of a spectral library searching method for peptide identification from MS/MS. Proteomics. 2007;7(5):655–667. doi: 10.1002/pmic.200600625. [DOI] [PubMed] [Google Scholar]
- 25.Lam H, Deutsch EW, Eddes JS, Eng JK, Stein SE, Aebersold R. Building consensus spectral libraries for peptide identification in proteomics. Nat Methods. 2008;5(10):873–875. doi: 10.1038/nmeth.1254. [DOI] [PMC free article] [PubMed] [Google Scholar]
- 26.Bern M. Peptide identification using both spectrum libraries and protein databases. Proceedings of the 8th Annual International Conference on Computational Systems Bioinformatics; 2009. pp. 117–126. [Google Scholar]
- 27.Ahrne E, Masselot A, Binz PA, Muller M, Lisacek F. A simple workflow to increase MS2 identification rate by subsequent spectral library search. Proteomics. 2009;9(6):1731–1736. doi: 10.1002/pmic.200800410. [DOI] [PubMed] [Google Scholar]
- 28.Cannon WR, Rawlins MM, Baxter DJ, Callister SJ, Lipton MS, Bryant DA. Large Improvements in MS/MS-Based Peptide Identification Rates using a Hybrid Analysis. J Proteome Res. 2011;10(5):2306–2317. doi: 10.1021/pr101130b. [DOI] [PubMed] [Google Scholar]
- 29.Li W, Ji L, Goya J, Tan G, Wysocki VH. SQID: an intensity-incorporated protein identification algorithm for tandem mass spectrometry. J Proteome Res. 2011;10(4):1593–1602. doi: 10.1021/pr100959y. [DOI] [PMC free article] [PubMed] [Google Scholar]
- 30.Arnold RJ, Jayasankar N, Aggarwal D, Tang H, Radivojac P. A machine learning approach to predicting peptide fragmentation spectra. Pac Symp Biocomput. 2006;11:219–230. [PubMed] [Google Scholar]
- 31.Barton SJ, Richardson S, Perkins DN, Bellahn I, Bryant TN, Whittaker JC. Using statistical models to identify factors that have a role in defining the abundance of ions produced by tandem MS. Anal Chem. 2007;79(15):5601–5607. doi: 10.1021/ac0700272. [DOI] [PubMed] [Google Scholar]
- 32.Klammer AA, Reynolds SM, Bilmes JA, MacCoss MJ, Noble WS. Modeling peptide fragmentation with dynamic Bayesian networks for peptide identification. Bioinformatics. 2008;24(13):i348–356. doi: 10.1093/bioinformatics/btn189. [DOI] [PMC free article] [PubMed] [Google Scholar]
- 33.Venable JD, Yates JR., 3rd Impact of ion trap tandem mass spectra variability on the identification of peptides. Anal Chem. 2004;76(10):2928–2937. doi: 10.1021/ac0348219. [DOI] [PubMed] [Google Scholar]
- 34.Joachims T. Learning to classify text using support vector machines: methods, theory, and algorithms. Kluwer Academic Publishers; 2002. [Google Scholar]
- 35.Platt JC. Probabilistic outputs for support vector machines and comparison to regularized likelihood methods. In: Smola AJ, Bartlett P, Scholkopf B, Schuurmans D, editors. Advances in large margin classifiers. MIT Press; 1999. pp. 61–74. [Google Scholar]
- 36.Lam H, Deutsch EW, Aebersold R. Artificial decoy spectral libraries for false discovery rate estimation in spectral library searching in proteomics. J Proteome Res. 2010;9(1):605–610. doi: 10.1021/pr900947u. [DOI] [PubMed] [Google Scholar]
- 37.Tanner S, Shu H, Frank A, Wang LC, Zandi E, Mumby M, Pevzner PA, Bafna V. InsPecT: identification of posttranslationally modified peptides from tandem mass spectra. Anal Chem. 2005;77(14):4626–4639. doi: 10.1021/ac050102d. [DOI] [PubMed] [Google Scholar]
- 38.Paizs B, Suhai S. Fragmentation pathways of protonated peptides. Mass Spectrom Rev. 2005;24(4):508–548. doi: 10.1002/mas.20024. [DOI] [PubMed] [Google Scholar]
- 39.Hu Y, Li Y, Lam H. A semi-empirical approach for predicting unobserved peptide MS/MS spectra from spectral libraries. Proteomics. 2011;11(24):4702–4711. doi: 10.1002/pmic.201100316. [DOI] [PubMed] [Google Scholar]
- 40.Huang Y, Triscari JM, Pasa-Tolic L, Anderson GA, Lipton MS, Smith RD, Wysocki VH. Dissociation behavior of doubly-charged tryptic peptides: correlation of gas-phase cleavage abundance with ramachandran plots. J Am Chem Soc. 2004;126(10):3034–3035. doi: 10.1021/ja038041t. [DOI] [PubMed] [Google Scholar]
- 41.Zhang X, Li Y, Shao W, Lam H. Understanding the improved sensitivity of spectral library searching over sequence database searching in proteomics data analysis. Proteomics. 2011;11(6):1075–1085. doi: 10.1002/pmic.201000492. [DOI] [PubMed] [Google Scholar]
- 42.Yen CY, Houel S, Ahn NG, Old WM. Spectrum-to-spectrum searching using a proteome-wide spectral library. Mol Cell Proteomics. 2011;10(7):M111 007666. doi: 10.1074/mcp.M111.007666. [DOI] [PMC free article] [PubMed] [Google Scholar]
Associated Data
This section collects any data citations, data availability statements, or supplementary materials included in this article.