Abstract
Background
Mapping functional areas of the brain is important for planning tumour resections. With the increased use of functional magnetic resonance imaging (fMRI) for presurgical planning, there is a need to validate that fMRI activation mapping is consistent with the mapping obtained during surgery using direct electrocortical stimulation (DECS).
Methods
A quantitative comparison of DECS and fMRI mapping techniques was performed, using a patient-specific conductivity model to find the current distribution resulting from each stimulation site. The resulting DECS stimulation map was compared to the fMRI activation map, using the maximal Dice similarity coefficient (MDSC).
Results
Our results show some agreement between these two mapping techniques – the stimulation site with the largest MOSC was the only site that demonstrated intra-operative effect.
Conclusions
There is a substantial effort to improve the techniques used to map functional areas, particularly using fMRI. It seems likely that fMRI will eventually provide a valid non-invasive means for functional mapping.
Keywords: fMRI, surgical planning, cortical stimulation
Introduction
Functional magnetic resonance imaging (fMRI) is a non-invasive tool for localizing brain activity. fMRI measures change in cerebral blood flow as a surrogate for neuronal activity. The most commonly used fMRI method measures blood oxygen level-dependent (BOLD) changes in the magnetic resonance signal. Neuronal activity results in increased blood flow through local capillaries. The increased perfusion outstrips the increased demand, resulting in an increase in the ratio of oxyhaemoglobin to deoxyhaemoglobin. Because of the different magnetic properties of deoxyhaemoglobin (paramagnetic) and oxyhaemoglobin (diamagnetic), these changes can be seen on MRI images as BOLD responses. Areas of the brain in which BOLD signal intensity correlates with the timing of an experimental task are said to be ‘activated’ by the task. Subjects typically perform these tasks in a block design paradigm, consisting of alternating blocks of rest and task; the tasks can include motor, memory, visual or language tasks.
For several years neuroscientists have used fMRI to help understand brain function in healthy subjects and in patients with neuropsychiatric diseases. Recently, fMRI has become a valuable source of information for neurosurgeons planning tumour resection. Functional area localization provides neurosurgeons with information about the location of eloquent tissue (tissue which is critical for the performance of key neurological functions, such as motor or language areas). By understanding the relationship of the lesion to these critical regions, the surgeon can minimize operative morbidity.
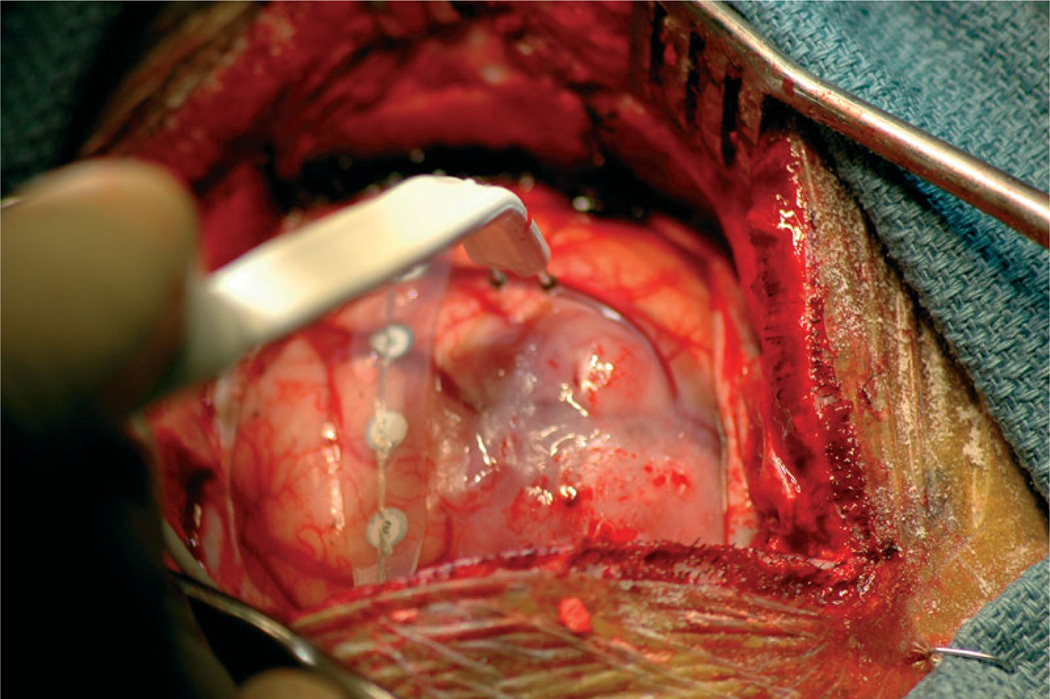
Until recently, surgeons have mapped presurgical spatial locations of the tumour and critical functional areas based solely on the anatomy of the brain. Anatomical images of the brain provide information about tumour location relative to structure, but they do not provide functional mapping. Localizing functional areas of the brain provides the surgeon with important information in planning for tumour resection. The gold standard for localizing functional areas is direct electrocortical stimulation (DECS), in which a surgeon stimulates the exposed cortex of the patient and marks the cortex according to patient response, a process that provides a mapping of functional regions on the cortical surface. As conventionally applied during surgery, after the craniotomy, the neurosurgeon stimulates the surface of the cortex in regions around the tumour with a bipolar stimulator injecting current pulses. The awake patient is able to communicate and perform tasks that are dependent on the regions near the tumour. In this context, the stimulation is an inactivation method simulating what would happen if that region of the brain were damaged during surgery. If the stimulation causes disruption of the patient’s task, the surgeon deems the region ‘eloquent’ and annotates that the site should be avoided during resection. The surgeon stimulates several sites and places labelled tags on the surface of the brain at each stimulation site. The labelled tags on the brain surface provide a functional mapping where annotations indicate patient response at each stimulation site. Figure 1 shows a photograph taken during surgery of the brain surface being stimulated.
Figure 1.
Photograph of the cortical surface during direct elctrocortical stimulation
Direct electrocortical stimulation is stressful for the patient and in some cases cannot be performed, due to clinical considerations. This is especially true for children. There is a substantial effort on the part of scientists and neurosurgeons to improve the techniques used to map tumour and functional area locations, particularly using fMRI. In principle, fMRI activation maps provide a functional mapping that surgeons use to plan for tumour resection. fMRI techniques provide a non-invasive means for functional mapping before the surgery. There is, however, a need to validate that fMRI data provides accurate functional maps.
Many publications have reported problems and sources of error that arise in trying to evaluate the agreement of the fMRI and DECS (1,2). One such problem is determining how to compare the voluntary task performed during the fMRI scan to the involuntary effect (either inhibitory or induced) caused by electrocortical stimulation (2). Additionally, surgeons do not normally stimulate within the depth of a sulcus (2) and therefore do not stimulate a large portion of the cortex. The inability to stimulate the sulcus results in an incomplete cortical mapping.
With the recent increase in the use of fMRI for presurgical planning, it is important to use DECS to establish the utility and validity of fMRI for accurate localization of eloquent brain regions. To our knowledge, all previous research has performed a qualitative comparison of functional mapping methods. Previous methods describe how functional regions seen on fMRI show functional effect in response to DECS. It is clear that there is a crucial missing link in previous work – a quantitative validation through statistical comparisons of spatial information whereby a correlation between fMRI and DECS is measured.
This research aims, ultimately, to validate fMRI for presurgical functional mapping. Providing surgeons with more information will help them plan for tumour resections. We have contributed to the validation of fMRI by developing a method for quantitative comparison of fMRI and DECS functional mapping techniques. Using patient-specific image datasets, including structural MRI and diffusion tensor imaging, we build a model to compare DECS to fMRI and show how fMRI can be used for surgical planning. Our computational methods integrate existing technologies to achieve this comparison, including registration of multimodal image sets and segmentation of the brain, tumour and ventricles (3). We also use existing meshing techniques (14) and existing finite element method (FEM)-solving software (18). Our contributions bring these technologies together to help surgeons validate fMRI for presurgical planning.
Materials and methods
We performed retrospective comparison of DECS and fMRI mapping techniques on data collected from a neurosurgical case (collected under informed consent). We used anatomical MRI data and diffusion tensor data to construct the patient-specific conductivity model. We used this model to find the current distribution map resulting from each stimulation site, using the intra-operative stimulation coordinates as model parameters. This resulted in the DECS stimulation map. Finally, we compared the DECS stimulation map to the functional MRI activation map.
Patient description
The patient suffered from complex partial, secondarily generalized seizure. The patient had some word-finding and other expressive language difficulties. The tumour was a large diffuse astrocytoma involving the frontal and temporal lobes in the dominant (left) hemisphere, the hemisphere responsible for language function. The surgeon performed a subtotal neurosurgical resection in an intra-operative MRI scanner via a frontotemporal craniotomy with awake language mapping, using cortical bipolar stimulation. The patient noted slight cognitive improvement postoperatively. Involvement with key language cortex and underlying white matter tracts limited the tumour resection.
Pre-operative data
The surgeon performed pre-operative planning using several pre-operative imaging datasets. These datasets included structural imaging, functional mapping and diffusion tensor imaging. Patients underwent the following MRI protocol on a General Electric (Milwaukee, WI, USA) 3 T Signa scanner, several days before their scheduled surgery.
Structural imaging
The patient underwent two pre-operative anatomical imaging protocols: (a) a whole brain axial 3D-SPGR (slice thickness, 1.5 mm; TE/TR, 6/35 ms; FA, 75°; FOV, 24 cm; matrix, 256 × 256); (b) an axial T2-weighted fast-spin-echo (slice thickness, 5 mm; TE/TR, 100/3000 ms; FOV, 24 cm; matrix, 256 × 192). We obtained ventricular system segmentation from the 3D-SPGR images using a curved surface evolution algorithm (3). We segmented the tumour manually using the T2-FSE images, which provide high tumour contrast. Using 3D-Slicer (4,5), we built three-dimensional (3D) anatomical models from the label maps generated from the segmentation. 3D-Slicer uses a marching cubes algorithm and a Gaussian smoothing algorithm to generate smooth surface models.
Functional mapping
The patient underwent functional imaging to map language areas. We obtained whole-head fMRI image volumes (TR/TE, 2000/50 ms; FA, 90°; FOV, 24 cm; matrix, 64 × 64; voxel size, 3.75 × 3.75 × 4 mm3). We mapped the language areas using a processing task that tested the patient’s level of semantic vs. perceptual judgment. The subject was shown 24 s blocks of either a fixation cross or words (six words presented for 4 s each). For the cross, the subject was told to focus on the cross. For the words, the subject was told to press a button if (a) the word was written in capital letters (e.g. FAME), or (b) the word was concrete (e.g. rock). These tasks tested perceptual decision tasks and semantic decision tasks. Task instructions were given visually for 4 s prior to each block of words.
We used SPM99 (6) to perform reconstruction and motion correction of the data. We also used SPM99 to calculate voxel by voxel paired t-statistic scores. We thresholded the t-statistic scores at each voxel to obtain a binary fMRI activation map describing which voxels are activated and which are not. We used this map to generate a 3D model using 3D-Slicer (4).
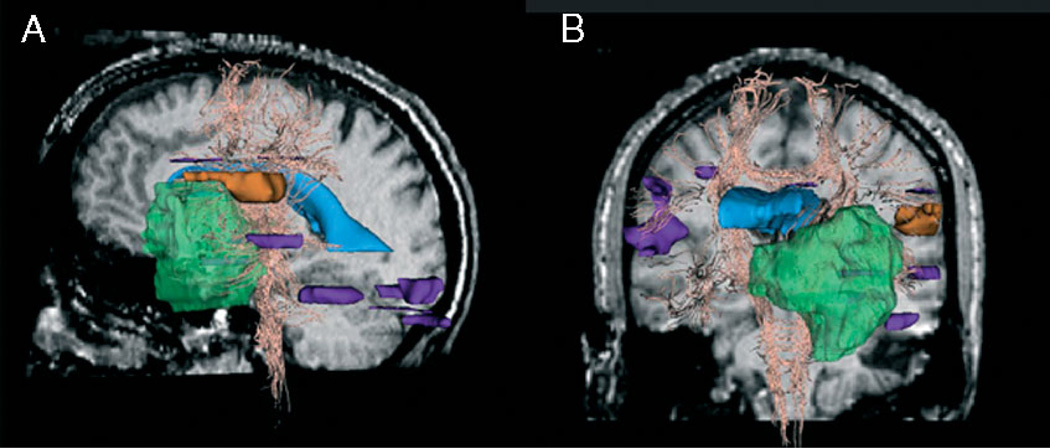
This dataset shows activation in the language areas as well as in auditory, visual and motor areas. In this particular study, we are only interested in the regions near the craniotomy. For this case, Broca’s speech area was at risk of being damaged. Figure 2 shows two views of the fMRI activation volume. The orange region is the region of interest and the purple regions are outside the region of interest.
Figure 2.
fMRI activation in the region of interest (orange) and outside the region of interest (purple), tumour (green), ventricles (blue) and white fibre tracts (yellow). (A) Left view on sagittal pre-operative slice. (B) Anterior view on coronal pre-operative slice
Diffusion tensor imaging
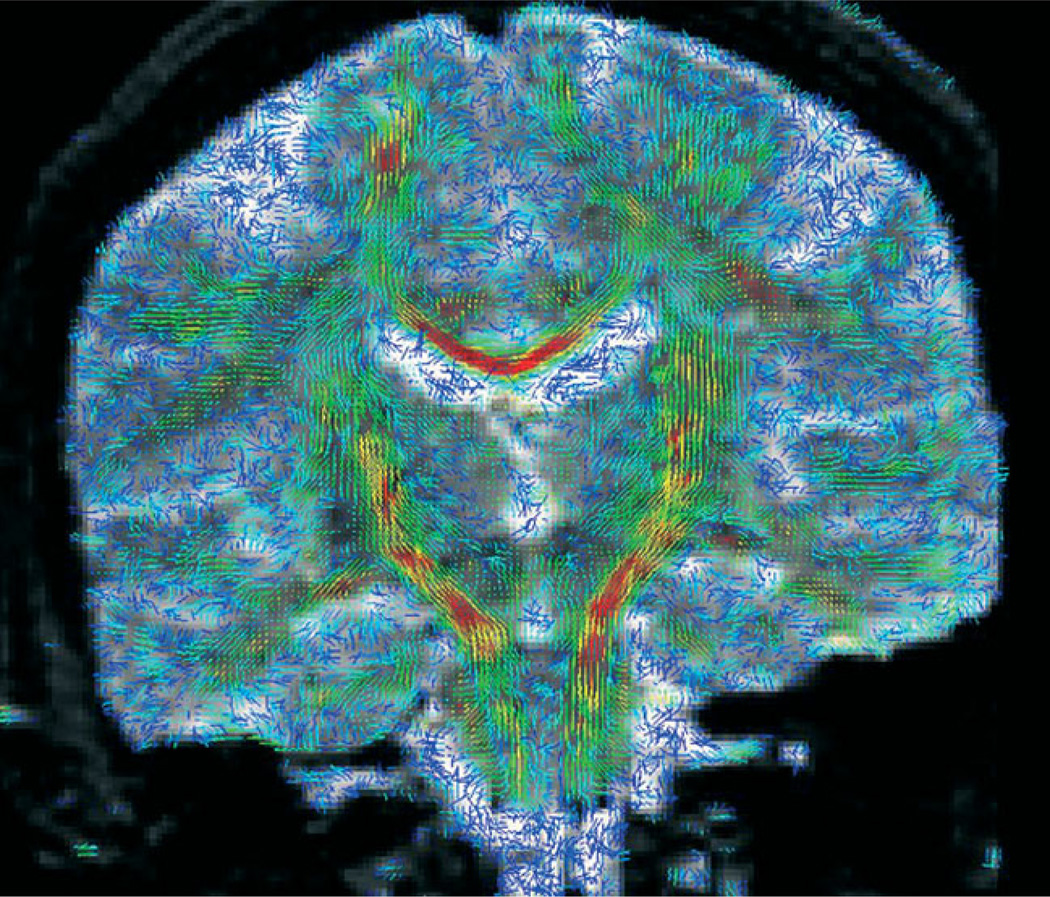
The patient underwent diffusion tensor imaging for presurgical planning of fibre tract locations. We obtained diffusion tensor images [axial line scan diffusion images (LSDI) (7); TE, 64 ms; TR, 2592 ms; slice thickness, 4 mm; slice gap, 1 mm] covering the region of interest. We obtained diffusion tracts using the 3D tractography method described by (8). This method is fully implemented in 3D-Slicer. The approach finds white fibre tracts by tracking the direction of the principle eigenvector (9). We used the baseline acquisition of the LSDI to manually register to the 3D-SPGR dataset. We displayed diffusion tensors in 3D-Slicer, which displays tensors as glyphs overlaid on the grey-scale image. The colour corresponds to the degree of anisotropy (10). The length of the glyph corresponds to the largest eigenvalue and the direction corresponds to the principle eigenvector. Figure 3 shows an example of diffusion tensors using glyph visualization.
Figure 3.
Visualization of the tensor data is shown as 3D glyphs, indicating the magnitude and direction of the diffusion at each voxel. Regions of high anisotropy, such as the corpus callosum and corticospinal tract, are in red
Intra-operative data: direct electrocortical stimulation
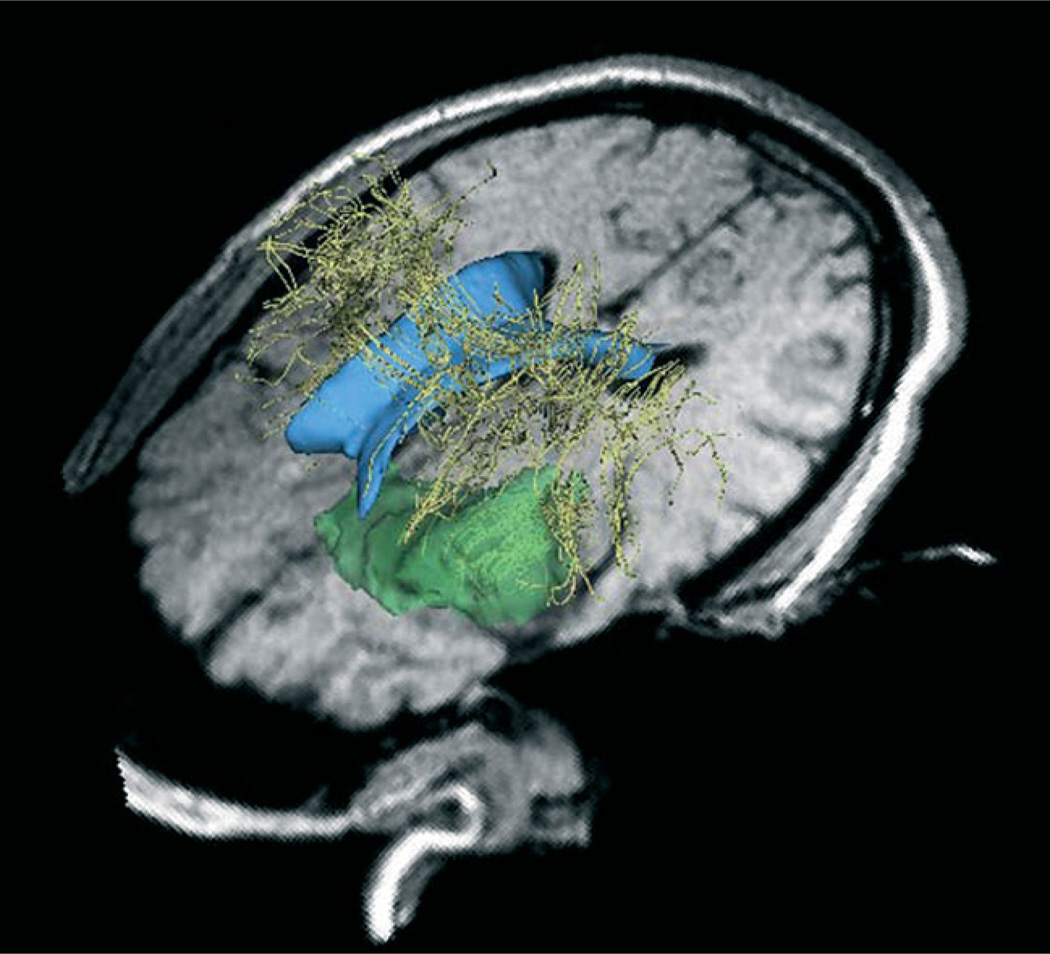
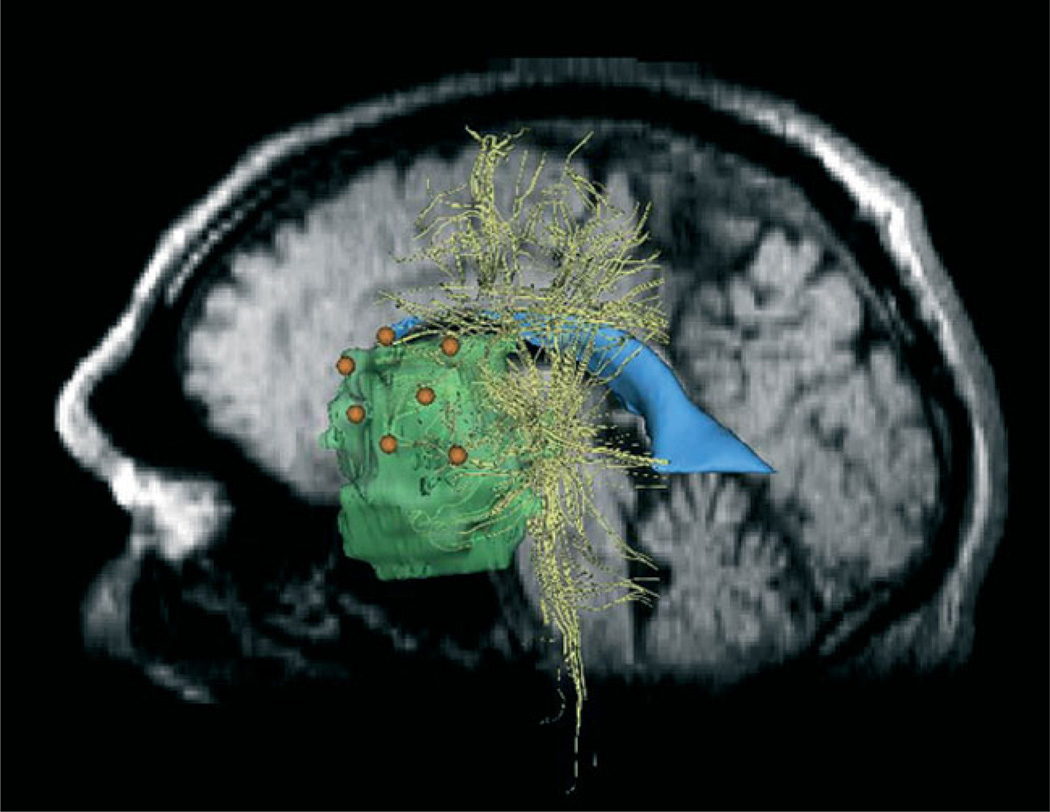
The surgeon performed surgery in a General Electric (Milwaukee, WI) 0.5T MR Therapy Unit (MRT) (11) at Brigham and Women’s Hospital. The MRT is an open magnet MRI scanner that allows intra-operative scans to be taken during surgery. Initial intra-operative images are obtained in approximately 30 min. The MRT operating room provides the surgeons with updated images of patient anatomy in 3–3.5 min. Additionally, the surgeon uses intra-operative images to integrate pre-operative data into the operating room via registration of pre-operative data with intra-operative data (10,21). Figure 4 shows pre-operative models of the ventricles, tumour and white matter tracts registered to the intra-operative 3D-SPGR data. We used intra-operative data to track the stimulation coordinates.
Figure 4.
Preoperative models of the ventricles (blue), white matter tracts (yellow) and tumour (green) registered to the intra-operative images
The surgeon performed direct electrocortical stimulation during surgery to map functional areas for resection planning. DECS is performed during surgery, after the craniotomy and before tumour resection. The surgeon stimulated the surface of the exposed cortex of the patient with an Ojemann bipolar stimulator with 2 mm diameter ball contacts separated by 5 mm (12). The stimulator injects current pulses at 5–75 Hz at an amplitude of 2–10 mA. The surgeon stimulated the cortex at seven sites while the patient either counted to 10 or listed the days of the week. The surgeon marked the stimulation sites with labelled tags and annotated according to patient response, such as hesitation, speech arrest, errors or no change. After performing the DECS mapping, the surgeon digitized each site with a sterotactic navigation probe. We read the intra-operative coordinates of the probe tip from the locator workstation in the coordinate system of the intra-operative images. Registration of the stimulation coordinates to the conductivity model is a straightforward application of the transformation between intra-operative and pre-operative data via non-rigid registration. Figure 5 shows the location of the stimulation coordinates.
Figure 5.
Stimulation sites (orange) registered to pre-operative 3D–SPGR images. Tumour (green), ventricles (blue) and white fibre tracts (yellow) are also shown
Computational methods: DECS stimulation map
In this section we describe the computational methods for building the patient-specific conductivity model, using pre-operative data, and show how we used it to compute the direct electrocortical stimulation (DECS) map. We use the electrical properties of the tissue contained in the model to solve for the current density distribution in response to current injected on the cortical surface. Intra-operative stimulation coordinates are used as inputs to the model when solving for the current density distribution, which we call the DECS stimulation map; this shows how current travels through the tissue and, therefore, which regions are likely to be affected by the stimulation. It is a 3D volume of scalar values indicating current density magnitude. We computed the current density by solving the quasi-static boundary-value problem governed by Poisson’s equation. We represented the high-resolution description of the anatomy using a mesh of tetrahedral elements. For each tetrahedral element, we determine the corresponding conductivity tensor by a direct linear relationship to the diffusion tensor (13). The conductivity tensor models the effects of tissue anisotropy in the brain. We solved the partial differential equations governed by Poisson’s equation using FEM, and used the patient-specific conductivity model to solve for the current density distribution resulting from DECS. The computational time required is in the order of 25 min. However, data preparation took several hours.
Model geometry
We obtained the brain geometry using the 3D-SPGR data, which provides a high resolution anatomical description. We isolated the brain from the skull and ventricle system using a surface evolution algorithm (3). These data provide information about brain boundary, shape and structure. The resulting segmentation consists of a binary label map describing which voxels are brain and which are background.
We used the brain segmentation to construct a tetrahedral mesh for use in finding the electric field solution using FEM. Tetrahedral elements are a simple 3D volume element. They are particularly useful in our application because they can be used to accurately describe smooth surfaces (14). We used an oct-tree method to form the mesh, whereby cubes fill the volume and are then subdivided into tetrahedral elements (14). The brain surface is fitted by intersecting the edges of the mesh with the surface of the volume. We found this intersection by checking for edges in which one end lies inside the brain and the other in the background. These edges are subdivided and new tetrahedra formed so that the tetrahedra conform to the surface, as described previously (14). The mesh used in this experiment has tetrahedral elements in the order of 5 mm3.
Conductivity tensors
We use the diffusion tensors to compute the conductivity tensors (13). After representing the brain geometry with tetrahedral elements, we assign anisotropic conductivity tensors to each element. The conductivity tensors can be directly computed from the diffusion tensor. Tuch et al. modelled the relationship between the conductivity and diffusion tensor by relating these transport tensors through the statistics of the medium microstructure (13,15). The relationship between the conductivity and diffusion tensors was fitted and found to be a linear scaling of the eigenvalues. The linear model is described by:
where σv and dv are the conductivity and diffusion eigenvalues, respectively. The linear fit yields model parameters, dε = 0.124 ± 0.0545 µm/ms, and k = 0.844 ± 0.0545 Ss/mm3. (Ss = Siemens seconds).
Current density solution
After building the conductivity model, we used the stimulation coordinates and current amplitude as input parameters in solving the boundary-value problem for the current density distribution throughout the brain.
The problem at hand consists of solving for the electric field distribution over an asymmetric model with unknown charge distribution. We solved this problem using Poisson’s equation. The charge distributions and distribution of potential are determined by specifying the potential over the boundaries of the region (16). This is described by Poisson’s equation:
where σ is the conductivity tensor, Φ is the electric potential over the domain, and Iv is the source term indicating the current sources within the domain. The current sources for this problem are on the surface of the brain at the stimulation sites. We used the finite element method (FEM) to approximate the solution to Poisson’s equation. FEM is a numerical technique for solving problems governed by partial differential equations (17). FEM techniques use a discretized domain to solve for the physical field at the nodes in a mesh. In our case, we approximated the brain geometry by a collection of tetrahedral elements and the nodes are the intersections of the tetrahedral elements.
The discretized solution is computed over the nodes and is a piece-wise linear approximation of the physical field. The value inside the tetrahedral elements is recovered using the node values. We used the FEM solving software, SCIRun/BioPSE, to find the solution (18,19).
We computed the current magnitude, Imag, by taking the magnitude of the gradient of the electric potential:
This current magnitude solution is the DECS stimulation map. Figure 6 shows the current magnitude solution imposed on intra-operative data. We thresholded the solution at 0.3% of the maximum value. We used a rainbow colour scale to visualize the solution; the purple regions indicate larger current magnitude values and the red regions are low current magnitude values.
Figure 6.
Current magnitude solution thresholded at 0.3% of the maximum current magnitude. A rainbow colour scale is used, where purple corresponds to the highest current magnitude and red to the lowest. The solution is imposed on intra-operative images at intersecting planes
DECS stimulation map
As mentioned above, the surgeon stimulated seven sites during the DECS intra-operative functional mapping procedures (see Figure 5 for stimulation sites). The mapping resulted in language inhibition only at stimulation site 3. The surgeon asked the patient to count from one to ten. When the surgeon stimulated the cortex the patient stopped counting, and when the stimulation was removed the patient continued. The language inhibition occurred at a current stimulation amplitude of 8 mA and a frequency of 75 Hz. We used these parameters as boundary conditions when solving the current density.
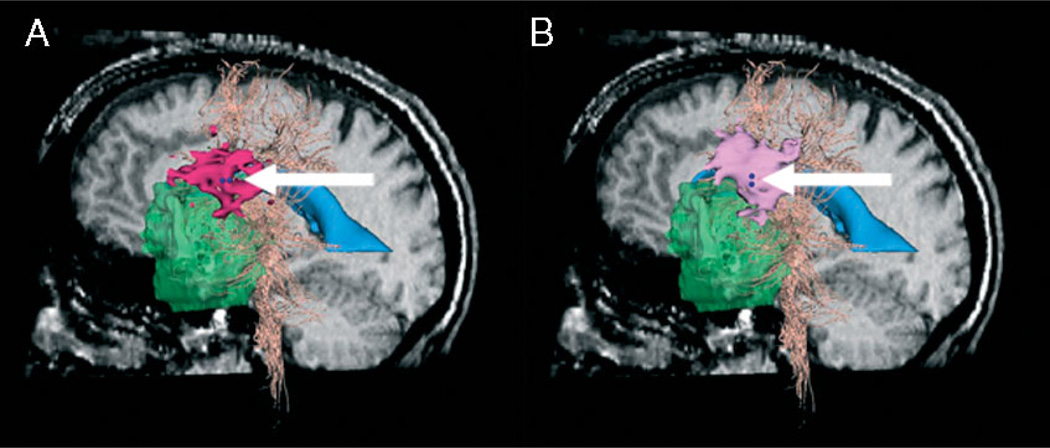
For this study we investigated two electrode orientations, anterior–posterior (AP) and superior–inferior (SI). The two orientations produced different results. Figure 7 shows the current density solutions for the two stimulator orientations. We marked the stimulation sites with two dark blue spheres, indicating location and orientation of the bipolar stimulator. We showed the DECS stimulation maps in pink.
Figure 7.
Comparison of current density solution (pink) for different stimulator orientations at stimulation site 3 (dark blue, indicated by arrows). Sagittal pre-operative slice, tumour (green), ventricles (blue) and white fibre tracts (peach) are also shown. (A) AP stimulator orientation; current density solution isosurface (dark pink), thresholded at 0. 0024 mA/cm3. (B) SI stimulator orientation; current density solution isosurface (light pink), thresholded at 0.0051 mA/cm3
Results: comparison of fMRI activation map and DECS stimulation map
In this section we compare the 3D fMRI activation and DECS stimulation maps to determine the level of agreement between the volumes. We quantify this comparison using the Dice similarity coefficient (DSC) (20), which provides a quantitative measure of the degree of association between the two volumes. A DSC of 1.0 indicates that the two volumes are exactly the same; a DSC of 0.0 indicates that the volumes have no overlapping voxels. The DSC is defined as the number of intersecting voxels divided by the average number of voxels in each volume:
In order to compare the fMRI activation and DECS stimulation maps, we thresholded the DECS stimulation map. The current density threshold that causes a physiological effect is difficult to determine. We handle this unknown parameter using a strategy that is similar to the approach used in the generalized likelihood ratio test, in which a nuisance parameter is discharged by varying it to maximize the test statistic. To this end, we thresholded the DECS stimulation map over a wide range of current density values within the stimulation map. We computed the DSC for each threshold. While this approach is straightforward, it is likely that the threshold that causes physiological effect will be different from the threshold that maximizes the DSC, and this will introduce some bias into the DSC measure.
The maximum DSC for AP stimulator orientation is 0.1800 and occurs when we threshold the DECS stimulation map at Imag = 0.0024 mA/cm3. The maximum DSC for SI stimulator orientation is 0.1747 and occurs when we threshold the DECS stimulation map at Imag = 0.0051 mA/cm3.
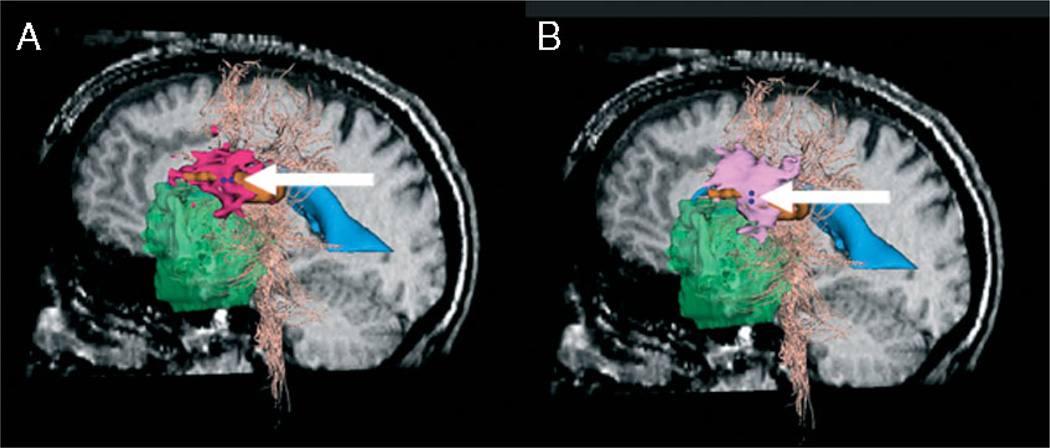
Figure 8 shows the fMRI and DECS stimulation volumes for both AP and SI stimulator orientations. We threshold the DECS stimulation maps at Imag = 0.0024 mA/cm3 and Imag = 0.0051 mA/cm3 for the AP and SI stimulator orientations, respectively. We marked the stimulation sites with two dark blue spheres, indicating location and orientation of the bipolar stimulator. The DECS stimulation maps are shown in pink and the fMRI activation map for the region of interest are shown in orange. Tables 1 and 2 list the maximal DSC values for the current density solution at all seven stimulator positions for each orientation.
Figure 8.
Comparison of current density solution (pink) and fMRI solution (orange) for different stimulator orientations at stimulation site 3 (dark blue, indicated by arrows). Models are shown on sagittal pre-operative slice. The tumour (green), ventricles (blue) and white fibre tracts (peach) are also shown
Table 1.
Maximal DSC values for all electrodes when stimulator is in anterior–posterior orientation
| Stimulation site | Maximal DSC |
|---|---|
| 1 | 0.0547 |
| 2 | 0.0331 |
| 3 | 0.1800 |
| 4 | 0.0153 |
| 5 | 0.0 |
| 6 | 0.0015 |
| 7 | 0.0 |
Table 2.
Maximum DSC values for all electrodes when stimulator is in superior– inferior orientation
| Stimulation site | Maximal DSC |
|---|---|
| 1 | 0.0533 |
| 2 | 0.0157 |
| 3 | 0.1747 |
| 4 | 0.0 |
| 5 | 0.0 |
| 6 | 0.00 |
| 7 | 0.0 |
Discussion
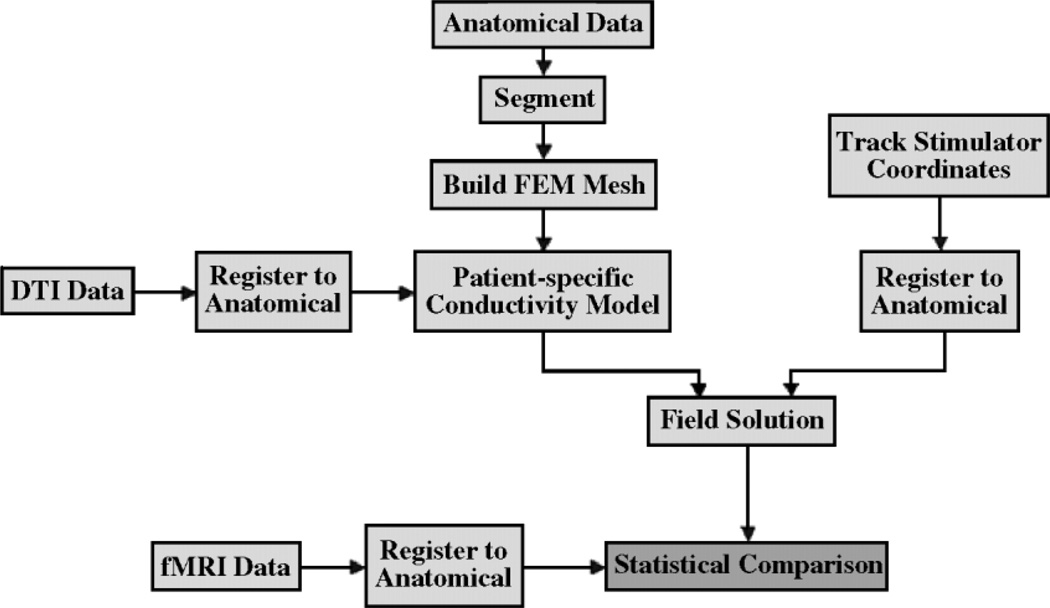
We introduced a method for quantitative comparison of fMRI and DECS functional mapping methods using patient-specific anisotropic conductivity models. We use existing technologies to achieve multimodal image registration and segmentation. We also use existing meshing technologies in order to find the electric field distribution, using FEM. Figure 9 provides a system overview of our methods. We compared the resulting current magnitude distributions to fMRI activations by choosing a current magnitude threshold that maximizes the Dice overlap measure.
Figure 9.
System overview
We compared the DECS stimulation and fMRI activation maps using maximal DSCs (MDSCs), which provides a quantitative measure of the degree of overlap between the two activation maps. We defined the fMRI activation map within a region of interest around the craniotomy. The region of interest for this case was Broca’s speech area. We generated the DECS stimulation map based on the current density solution at stimulation site 3. This is the only site where the patient’s speech was inhibited due to stimulation. We generated the current density solution throughout the brain using the stimulation parameters (8 mA) at the stimulation site. This current density solution is the DECS stimulation map. The MDSC stimulation map at stimulation site 3 shows agreement with the fMRI activation map. The one stimulation site that evoked patient response during cortical mapping is the only site that shows agreement with the fMRI activation map. While stimulator orientation had an affect on the shape of the current density solutions, both orientations showed similar agreement with the fMRI activation map. Surgeons do not normally consider stimulation orientation during surgery. These results show that it does have an effect on patient response.
We show promising results in the comparison of fMRI activation maps and DECS activation maps. Our results show some agreement between intra-operative cortical mapping results and fMRI activation results from paradigms we selected to activate regions of the brain within the region of interest. The stimulation sites that did not evoke patient response do not show significant agreement with the fMRI activation map.
Stimulator orientation had an effect on the current density solution, and intra-operative cortical stimulation did show evidence that stimulator orientation had an effect on the patient’s response. We simulated at two different orientations: anterior–posterior and superior–inferior. The two orientations have different shapes in thresholded activation maps (see Figure 7). Additionally, when the surgeon placed the stimulator in the anterior–posterior orientation, the threshold that produced the most agreement (largest DSC) with the fMRI activation map was 0.5% of the maximum. The threshold that produced the most agreement for the superior–inferior orientation was only 0.1% of its maximum current density magnitude. This indicates that the superior–inferior orientation had a larger effect on the patient’s response. Currently, we do not have a way to validate orientation effects with this dataset. However, while the two orientations showed a different shape in the current density isosurfaces, both solutions were still consistent with fMRI activation results.
Since cortical stimulation is considered the gold standard for intra-operative functional mapping, validation of fMRI is dependent on information obtained from surgery. There are several sources of error that can result during surgery. Tracking stimulation sites during surgery is likely a significant source of error. While we are able to obtain coordinates from the stereotactic navigation probe, the probe is still tracking labelled tags on the cortical surface. Also, the brain tends to shift after the craniotomy and, as time goes by, the brain can start to sink or swell.
More work needs to be done to validate and improve how the conductivity model can be compared to intra-operative DECS, including addressing the impact of variations in brain surface wetness. In addition to invasive electrical measurements, this will include non-rigid registration of intra-operative images to pre-operative images, and the use of higher resolution DTI. At this point, the resolution of the DTI data limits the resolution of the tetrahedral mesh. Eventually, the technology will have to be applied to enough surgical cases to provide adequate statistical power for the comparison.
Acknowledgements
This investigation was supported in part by NIH Grants P41-RR13218 and 1U41-RR019703-01A2. The study was made possible in part by software from the NIH/NCRR Center for Integrative Biomedical Computing (P41-RR12553).
References
- 1.Hill D, Smith AC, Simmons A, et al. Sources of error in comparing functional magnetic resonance imaging and invasive electrophysiological recordings. J Neurosurg. 2000;93:214–223. doi: 10.3171/jns.2000.93.2.0214. [DOI] [PubMed] [Google Scholar]
- 2.Krings T, Schreckenberger M, Rohde V, et al. Metabolic and electrophysiological validation of functional MRI. J Neurol Neurosurg Psychiat. 2001;71:762–771. doi: 10.1136/jnnp.71.6.762. [DOI] [PMC free article] [PubMed] [Google Scholar]
- 3.Yezzi A, Kichenassamy S, Kumar A, et al. A geometric snake model for segmentation of medical imagery. IEEE Trans Med Imaging. 1997;16:199–209. doi: 10.1109/42.563665. [DOI] [PubMed] [Google Scholar]
- 4.Slicer: Open-source software for visualization, registration, segmentation and quantification of medical data. [accessed 2003]; http://www.slicer.org.
- 5.Gering D, Nabavi A, Kikinis R, et al. An integrated visualization system for surgical planning and guidance using image fusion and an open MR. J Magnet Reson Imaging. 2001;13(6):967–975. doi: 10.1002/jmri.1139. [DOI] [PubMed] [Google Scholar]
- 6.Statistical parametric mapping: statistical process used to test hypotheses about neuroimaging data from SPECT/PET and fMRI. [accessed 2003];Wellcome Department of Imaging Neuroscience. http://www._l.ion.ucl.ac.uk/spm/
- 7.Gudbjartsson H, Maier S, Mulkern R, et al. Line scan diffusion imaging. Magn Reson Med. 1996;36(4):509–519. doi: 10.1002/mrm.1910360403. [DOI] [PubMed] [Google Scholar]
- 8.Westin C, Maier S, Mamata H, et al. Processing and visualization for diffusion tensor MRI. Med Imaging Anal. 2002;6(2):93–108. doi: 10.1016/s1361-8415(02)00053-1. [DOI] [PubMed] [Google Scholar]
- 9.Talos I, O’Donnell L, Westin C, et al. Diffusion tensor and functional MRI fusion with anatomical MRI for image-guided neurosurgery. Sixth International Conference on Medical Image Computing and Computer-Assisted Intervention. 2003:407–415. [Google Scholar]
- 10.Kemper C. Incorporation of Diffusion Tensor MRI in Nonrigid Registration for Image-guided Neurosurgery. Cambridge, MA: Massachusetts Institute of Technology; 2003. Dissertation. [Google Scholar]
- 11.Schenk J, Jolesz F, Roemer P. Superconducting open-configuration of MR imaging system for image-guided therapy. Radiology. 1995;195:805–814. doi: 10.1148/radiology.195.3.7754014. [DOI] [PubMed] [Google Scholar]
- 12.Radionics Ojemann Stimulator. [accessed 2003]; http://www.radionics.com.
- 13.Tuch D, Wedeen V, Dale A, et al. Conductivity tensor mapping of the human brain using diffusion tensor imaging. Proc Natl Acad Sci USA. 2001;98(20):11697–11701. doi: 10.1073/pnas.171473898. [DOI] [PMC free article] [PubMed] [Google Scholar]
- 14.Timoner S. Compact Representations for Fast Nonrigid Registration of Medical Images. Cambridge, MA: Massachusetts Institute of Technology; 2003. Dissertation. [Google Scholar]
- 15.Sen S, Torquato S. Effective conductivity of anisotropic two-phase composite media. Phys Rev B. 1989;39:4504–4515. doi: 10.1103/physrevb.39.4504. [DOI] [PubMed] [Google Scholar]
- 16.Paul C, Whites K, Nasar S. Introduction to Electromagnetic Fields. 3rd edn. McGraw-Hill: New York; 1998. [Google Scholar]
- 17.Nikishkov G. Introduction to the Finite Element Method. University of Aizu; 2003. [Google Scholar]
- 18.SCIRun: A scientific computing problem solving environment. [accessed 2002];Scientific Computing and Imaging Institute (SCI) http://software.sci.utah.edu/scirun.html.
- 19.BioPSE: Problem solving environment for modeling, simulation, and visualization of bioelectric fields. [accessed 2002];Scientific Computing and Imaging Institute (SCI) http://software.sci.utah.edu/biopse.html.
- 20.Dice L. Measures of the amount of ecologic association between species. Ecology. 1945;26(3):297–302. [Google Scholar]
- 21.Warfield SK, Hauer SJ, Talos IF, et al. “Captoring intra-operative deformations: Research Experience at Brigham and Women’s Hospital.”. Medical Image Analysis. 2005;9:145–162. doi: 10.1016/j.media.2004.11.005. [DOI] [PubMed] [Google Scholar]


