Abstract
One of the primary tasks in deciphering the functional contents of a newly sequenced genome is the identification of its protein coding genes. Existing computational methods for gene prediction include ab initio methods which use the DNA sequence itself as the only source of information, comparative methods using multiple genomic sequences, and similarity based methods which employ the cDNA or protein sequences of related genes to aid the gene prediction. We present here an algorithm implemented in a computer program called Projector which combines comparative and similarity approaches. Projector employs similarity information at the genomic DNA level by directly using known genes annotated on one DNA sequence to predict the corresponding related genes on another DNA sequence. It therefore makes explicit use of the conservation of the exon–intron structure between two related genes in addition to the similarity of their encoded amino acid sequences. We evaluate the performance of Projector by comparing it with the program Genewise on a test set of 491 pairs of independently confirmed mouse and human genes. It is more accurate than Genewise for genes whose proteins are <80% identical, and is suitable for use in a combined gene prediction system where other methods identify well conserved and non-conserved genes, and pseudogenes.
INTRODUCTION
In order to predict protein coding genes (genes in the following), both the location of the genes within the genome as well as the gene structures have to be determined. The exact locations of the exon–intron boundaries are crucial for defining the encoded amino acid sequence and thus the protein product of the gene. The gene identification strategies used to produce gene sets for complete genome sequences such as human (1) combine the results of multiple computational approaches, each of which may perform optimally given certain sorts of information, choosing which methods to use in which place depending on the evidence available.
Due to the recent and ongoing sequencing of entire genomes, we are now in a position to compare almost every newly sequenced genome with an already sequenced evolutionarily related genome, for example, the mouse with the human genome (2), Fugu rubripes with the human genome (3) or Anopheles gambiae with the Drosophila melanogaster genome (4). Reports on the sequencing of a genome are now typically accompanied by an initial comparative analysis with an evolutionarily related genome because many tasks, including the annotation of genes, are more easily solved through genome comparisons. Depending on the time of evolutionary divergence between two genomes and the details of the processes by which each genome evolves, those parts of the genomes which are subject to functional constraints have evolved more slowly than, and differently from, the remaining parts of the genomes and can thus be identified as islands of conservation of a specific pattern in a sea of change. Concerning genes, the functional constraints act both on the encoded three-dimensional proteins and hence the encoded amino acid sequence, and on the transcription and mRNA processing signals associated with the gene structure.
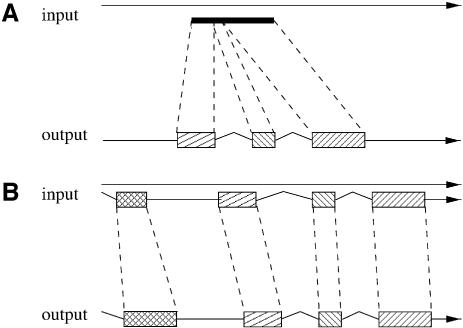
Traditionally, similarity based gene prediction methods such as Genewise (5,6) and Procrustes (7) take the amino acid sequence of a known protein and predict a gene encoding the same or a similar amino acid sequence in the input DNA sequence, see Figure 1A. These methods typically show a high sensitivity and specificity for predicting genes whose amino acid sequence is closely related to the amino acid sequence of the known input protein, but their performance decreases considerably with decreasing levels of protein similarity (8,9). The distinction between ab initio and similarity based gene prediction methods has recently become blurred: Pro-Gen (10), Doublescan (11) and SLAM (12) treat two related input genomic DNA sequences in a symmetric way and simultaneously align them and predict pairs of related genes. CEM (13) and SGP-1 (14) base the comparative gene prediction within two related input DNA sequences on a pre-generated local alignment. Methods like Twinscan (15), Genomescan (9) and SGP-2 (16) probabilistically integrate the pre-generated local alignment between one DNA input sequence and one or more related informant DNA sequences (Twinscan and SGP-2) or between one DNA input sequence and a set of informant protein sequences (Genomescan) into an underlying gene prediction algorithm which predicts the genes within the single DNA input sequence. These local alignments are all generated with programs such as BLAST (17,18) which identify regions of high sequence conservation based on local sequence identity without explicitly modeling valid gene structures or specifying exact intron–exon boundaries.
Figure 1.
Different types of similarity based gene prediction methods: (A) gene prediction based on protein similarity (e.g. Genewise and Procrustes), (B) gene prediction based on protein and gene structure similarity (e.g. Projector). Genomic DNA is symbolized by arrows, exons by boxes, introns by kinked lines and intergenic stretches of the DNA by straight lines.
A comparative analysis of the mouse and the human genome (2) estimates that 99% of the mouse genes have a homologous human gene and 80% have reciprocal best matches to a human gene that can readily be identified as the orthologous gene pair. Only 1% of the human and mouse genes do not have readily identifiable counterparts in the other genome. Protein coding DNA exhibits the highest degree of conservation with on average 85% sequence identity, as opposed to 69% sequence identity for the alignable sections of intron sequences, and alignment gaps are an order of magnitude more rare in coding than in non-coding regions of the genome. Concerning the conservation of gene structure, 86% of the orthologous gene pairs are estimated to have the same number of coding exons and 46% also the same coding length, whereas only 1.5% have the same coding length but a different number of exons. Most cases where there is a different number of exons can be explained by single exon fusion or exon splitting events. On average, transcripts in this set contained 8.3 exons.
It is clear from the above numbers that a novel similarity based gene prediction method that could explicitly model both the conservation of exon–intron structure and the encoded amino acid sequences between two related genes would have access to additional information compared with existing methods. This should help cross-annotation of related genomes, as none of the existing similarity based methods explicitly models the conservation of gene structure. A limitation of this method as well as the existing protein-based homology methods is that only those genes can be detected that have an already known partner in another genome. Genes that are unique to one genome or genes whose partner exists, but has not yet been identified, cannot be detected using this method.
METHOD AND THEORY
Our method predicts new genes according to the known genes annotated on a related DNA sequence by employing a probabilistic pair hidden Markov model (pairHMM) (19). The states and transitions of the pairHMM underlying Projector are the same as for Doublescan (11) and can model the most prevalent configurations which can arise through the alignment of pairs of related genes which appear in colinearity in two DNA sequences, including exon fusion or splitting events. However, instead of taking two similar DNA sequences of unknown gene contents as the input information and predicting the genes within the two sequences as well as an alignment between them as done by the comparative ab initio gene prediction method Doublescan, Projector takes the known genes of one of the two sequences as additional input information and predicts the genes of the other DNA sequence according to the known genes of the related DNA sequence. In order to implement the constraint imposed by the known genes into Projector, the algorithm by which the state path with the highest overall probability (the optimal state path) is derived is altered.
Let X be the input DNA sequence with known genes and Y the input DNA sequence whose genes are unknown. We think of a sequence of time steps, in each of which the current state s reads a fixed, state-dependent number of letters Δx(s) from sequence X and a potentially different fixed number of letters Δy(s) from sequence Y. The information on the known genes of sequence X are translated into annotation labels Xiann for each sequence position i in sequence X. In contrast to Doublescan, which considers all possible annotations and alignments of the two input sequences in the calculation of the optimal state path, Projector considers only those annotations and alignments which are compatible with the known genes of input sequence X. This constraint is implemented in the following way into the recursion step of the Viterbi algorithm (20):

where v(s, i, j) denotes the element of the Viterbi matrix which corresponds to the probability of the state path with highest probability which ends in state s and which so far has read i letters from sequence X and j letters from sequence Y, ts′(s) is the transition probability to go from state s′ to state s. es(i, j) is the emission probability of state s to read Δx(s) letters from sequence X (letters Xi–Δx(s), ..., Xi–1) and Δy(s) letters from sequence Y (letters Yj–Δy(s), ..., Yj–1). δ(Xkann, X(s)kpre) is 1 if the label X(s)kpre predicted by state s for sequence position k coincides with the annotated label Xkann, and 0 otherwise. It is thus this extra factor Πi–1k=i–Δx(s) δ(Xkann, X(s)kpre) in the above formula which implements the constraint into the state path calculation, because all state paths which do not reproduce the known annotation of sequence X are assigned zero probability as soon as a discrepancy occurs between the annotated and the predicted label of a position in sequence X. Using the above formula for the recursion step, the Viterbi algorithm calculates the state path with the highest probability which simultaneously satisfies the following conditions: (i) it reproduces the known genes of sequence X, (ii) it predicts genes in sequence Y which correspond to the known genes of sequence X and (iii) it predicts an alignment between the two sequences.
Special emission probabilities
Technically, the extra factor in the Viterbi recursion which constrains the state paths to those that reproduce the known annotation of sequence X can be interpreted as a modification of the nominal emission probabilities, es(i, j), of the pairHMM. We call these emission probabilities which now also depend on the position within the input sequences rather than only the letters at that position special emission probabilities and denote them by e′s(i, j). For Projector, they have the form e′s(i, j) = es(i, j) Πi–1k=i–Δ(s) δ(Xkann, X(s)kpre) for every state s which reads letters from sequence X [see also Yeh et al. (9) and Korf et al. (15)].
Special transition probabilities
A novel feature of the pairHMM underlying Doublescan and Projector is the concept of position dependent transition probabilities which are used to implement the sequence signal scores provided by external programs into the pairHMM framework in a way which fully preserves the pairHMM’s probabilistic interpretation. We call these position dependent transition probabilities special transition probabilities. Both Doublescan and Projector use an external program called StrataSplice (21) similar to that in Burge and Karlin (22) to gain more detailed information on every potential splice and translation start site within the two input sequences. The sequence signals of these states are too complex and contained in a sequence interval which is too wide to be adequately captured directly within the states and transitions of our HMM. Before the state path calculation is started within Doublescan and Projector, StrataSplice goes along each sequence separately and assigns a log-odds score (in bits, i.e. log base 2) to each possible splice site and translation start site. This score is a measure of how likely the potential splice site is to be true. Once these scores have been assigned, they are used within the state path calculation to modify the nominal values of some transition probabilities. Every transition leading into a translation start or a splice site state is assigned the full nominal probability if the corresponding sequence signal scores are high, and it is reduced to a lower value if the corresponding scores are low. We choose to calculate the special transition probability for such a transition from state s′ to state s at sequence positions i in X and j in Y as follows:
t′s′(s, i, j) = ts′(s) (prior(i, j) · 2score(i, j)) / (prior(i, j) · 2score(i, j) + 1 – prior(i, j))
where prior(i, j) = ![]() and score(i, j) = scorex,i + scorey,i if the state s is a match state, or (prior(i, j) = priorx,i and score(i, j) = scorex,i) or (prior(i, j) = priory,j and score(i, j) = scorey,j) if the state reads only letters from sequence X or only sequence Y, respectively. The priors priorx,i and priory,j are the respective prior probabilities of seeing the sequence signal (in the general case their values may depend on the sequence position, as the prior probability of seeing a GC 5′ splice site may for example be different from seeing a consensus GT 5′ splice site) and the scores scorex,i and scorey,j are the respective log-odds scores of the sequence signals at sequence position i in X and j in Y.
and score(i, j) = scorex,i + scorey,i if the state s is a match state, or (prior(i, j) = priorx,i and score(i, j) = scorex,i) or (prior(i, j) = priory,j and score(i, j) = scorey,j) if the state reads only letters from sequence X or only sequence Y, respectively. The priors priorx,i and priory,j are the respective prior probabilities of seeing the sequence signal (in the general case their values may depend on the sequence position, as the prior probability of seeing a GC 5′ splice site may for example be different from seeing a consensus GT 5′ splice site) and the scores scorex,i and scorey,j are the respective log-odds scores of the sequence signals at sequence position i in X and j in Y.
Empirical studies led us to take the geometric mean for merging both the two individual priors as well as the two individual probabilities underlying the scores. The natural way to combine two probabilities which are not mutually exclusive might appear to take their product, but if the splice site is fully conserved this would effectively score it twice, which is wrong. The geometric mean scores it once. An arithmetic mean does not work because it allows a very poor site, e.g. with probability 0, to be accepted if paired with a good site. In practice the geometric mean worked best of several methods we tried (with the Doublescan not the Projector test set). A more complex approach could make use of the level of similarity, but this would make the combination depend on the local sequences as well as the scores, adding significantly to complexity and compute time. It remains an option for future exploration.
The probability of such a transition thus becomes dependent on the value of the sequence signal scores and priors at the given pair of sequence positions, and the corresponding transition within the pairHMM is called special. In order to retain the probabilistic interpretation of the transition probabilities, we have to ensure that the sum of transition probabilities emerging from each state at any pair of sequence positions remains equal to one. Once the values of the special transition probabilities emerging from one state have been calculated, the remaining non-special transition probabilities are rescaled by a common factor which ensures that the sum of all transition probabilities emerging from that state add up to one. The rescaling factor for a non-special transition from state s′ to state s″ at sequence positions i in X and j in Y is:

Hence Σs ts′(s, i, j) = 1 for all possible triplets of state s′, sequence positions i in X and j in Y.
With the aid of special transition and special emission probabilities, the recursion step within the Viterbi algorithm of Projector can then be written as:
v(s, i, j) = maxs′ {v(s′, i – Δx(s), j – Δy(s)) t′s′(s, i – Δx(s), j – Δy(s)) e′s(i, j)}
where t′s′(s, i – Δx(s), j – Δy(s)) and e′s(i, j) correspond to the non-special terms whenever a transition or emission is not special. The baseline transition probabilities ts′(s) and non-special emission probabilities es(i, j) of Projector are the same as for Doublescan. The time and memory requirements of the Viterbi algorithm both scale with the product of the sequence lengths LX and LY of the two input sequences X and Y. As for Doublescan, we use Projector with the Stepping Stone algorithm (11,23) which heuristically restricts the search space by constraining the alignment to an envelope around a set of mutually compatible BLAST matches. The Stepping Stone algorithm implementation also employs the linear memory implementation of the Viterbi algorithm due to Hirschberg (24) to reduce both time and memory requirements to effectively linear behavior.
RESULTS
In order to investigate the advantages and disadvantages of our new method, we compiled a set of pairs of homologous human and mouse genes and used Projector to predict the human genes using the mouse genes as constraints and vice versa. As Projector is the first program to predict genes from similar gene structures, we had no directly equivalent program to compare it to. We chose Genewise (Version 2.1.22c) for comparison, as this is a program which is commonly used for such tasks, for example, by the Ensembl project (25). We compare the human and mouse genes predicted by Projector using the known mouse and human genes, to the human and mouse genes predicted by Genewise using the known mouse and human protein sequences.
Data set
When compiling the data set, our aim was to establish a large representative data set of similar mouse and human gene pairs without compromising on the reliability of the annotation. We thus selected homologous mouse and human gene pairs whose proteins were mutual best matches within the two proteomes and required that every human gene was fully supported by human mRNA evidence and that every mouse gene was fully supported by mouse mRNA evidence (26) (using Refseq of 10 February 2003 as the source of RNA evidence). As we aim to test if mouse genes can be reliably predicted using human genes instead of their protein products and vice versa, we retained only those pairs whose protein coding part was completely known (both gene structures had to include both start and stop codons). Starting with 21 962 human and 14 160 mouse Ensembl transcripts with Refseq links, 8330 human and 5336 mouse transcripts were fully supported by mRNAs from Refseq (exact matches). Clustering those transcripts into pairs if the corresponding proteins are mutual best matches and requiring both transcripts to include both start and stop codons reduces the set to 491 transcript pairs, which constitute our test set. There is no overlap between this test set and the set of 36 human and mouse gene pairs on which the parameters of the model were trained (11).
The genes in our test set have on average 8.8 exons (minimum 1, maximum 65) and the DNA sequences are on average 25 355 base pairs (bp) long (minimum 2240 bp, maximum 280 150 bp). For 44% of the gene pairs, the genes in a pair have the same number of exons and the same coding length. For 51% gene pairs, the genes in a pair have the same number of exons, but a different coding length, and 5% of the gene pairs consists of genes which are related by events of exon fusion or exon splitting. These figures are comparable with those given in the introduction for the whole genome, except that there are only a third as many exon fusion or splitting events as estimated by the Mouse Genome Sequencing Consortium (2). However, given that the exon number is typical of the genome, there is nothing about the construction of this set that should select for maintenance of exon number.
Performance
We compare the set of genes predicted by Projector (human genes predicted using known mouse genes and mouse genes predicted using known human genes) with the annotated genes. Similarly, the genes predicted by Genewise (human genes predicted using known mouse proteins and mouse genes predicted using known human proteins) are compared with the annotated genes.
As the aim of both programs is to predict genes correctly, we report the performance of Projector and Genewise not only at exon level, as is customary, but also at gene level and for start and stop codons as this turns out to be crucial to fully understand each method and their differences. We measure the quality of the performance in terms of sensitivity and specificity. The sensitivity is the fraction of annotated features which are accurately predicted and the specificity is the fraction of predicted features which exactly match an annotated feature.
We report the performance as a function of the percent identity of the two encoded proteins because this has a significant impact on performance. The expectation is that pairs of genes whose encoded proteins have a low percent identity are more difficult to predict than gene pairs whose proteins are similar. The performance of Projector and Genewise as a function of the percent identity is shown in Figure 2.
Figure 2.
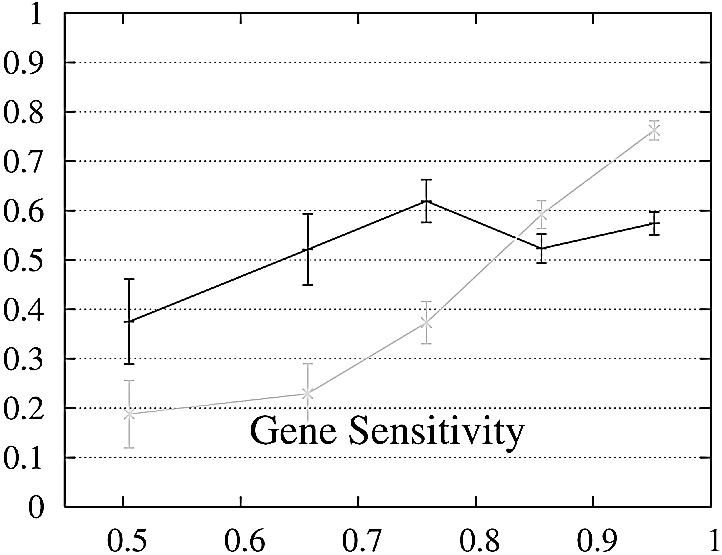
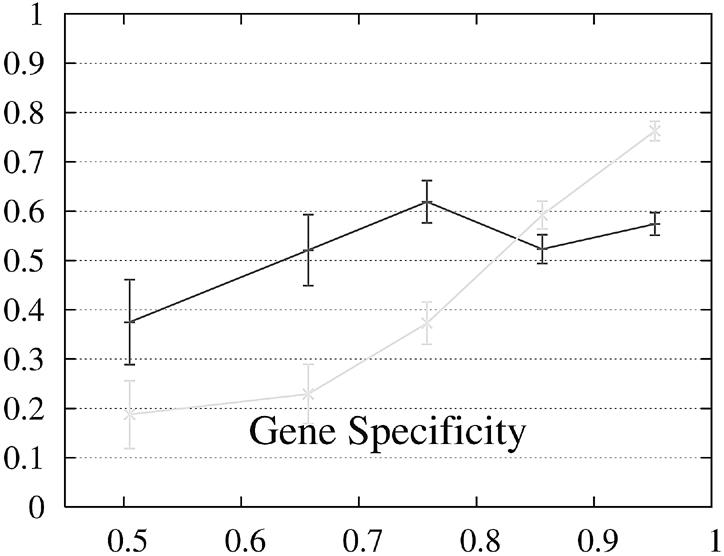
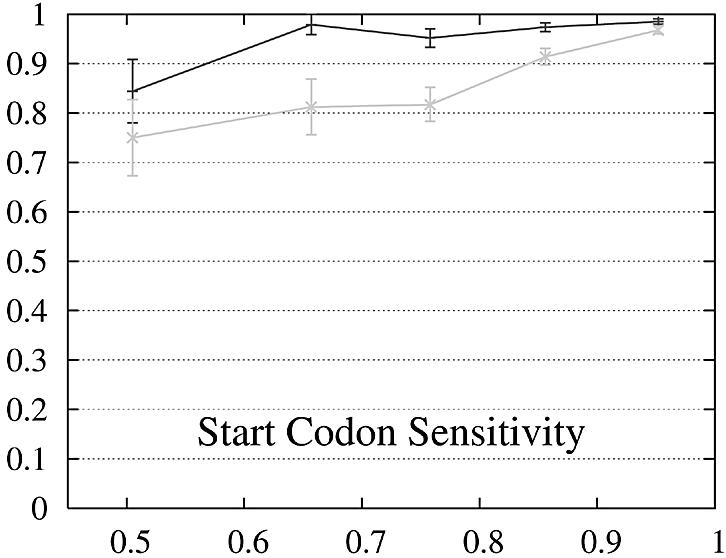
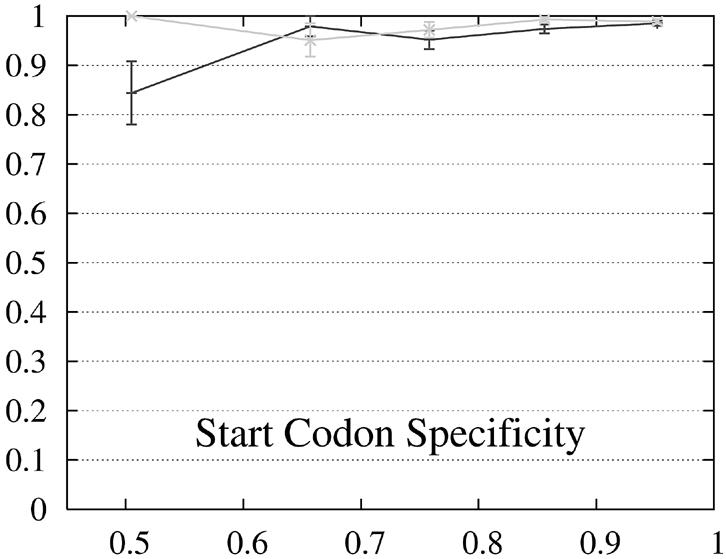
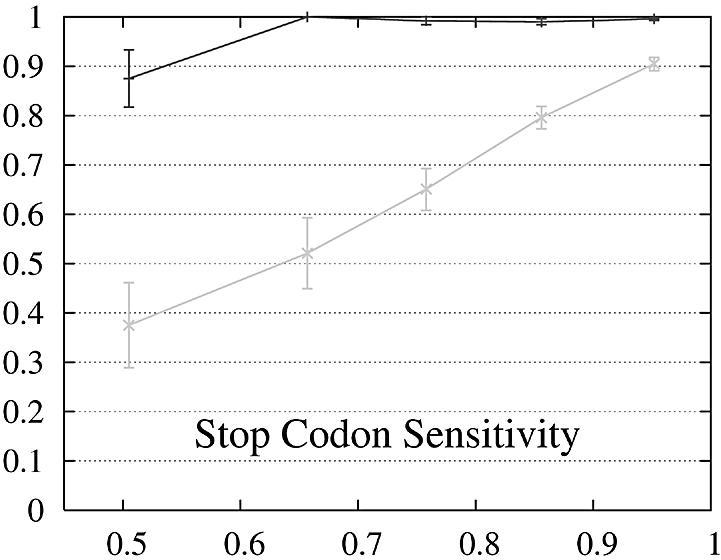
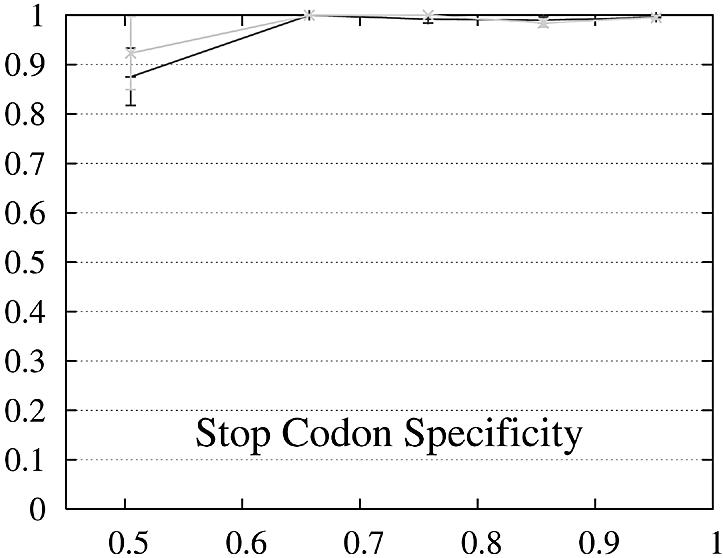
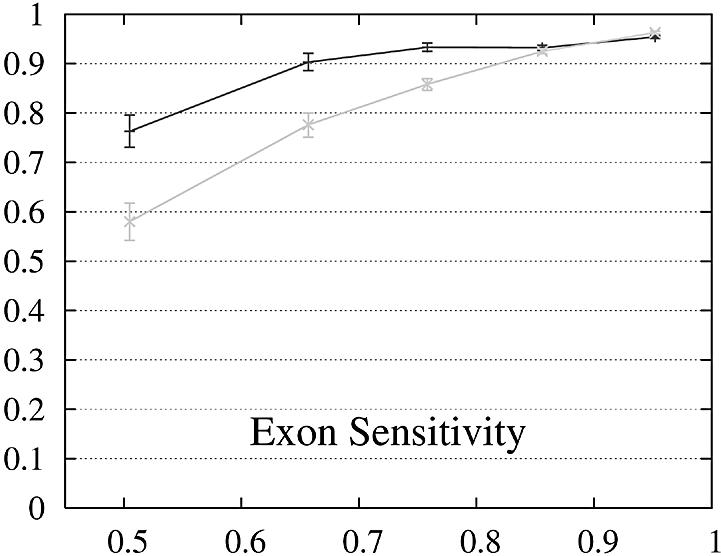
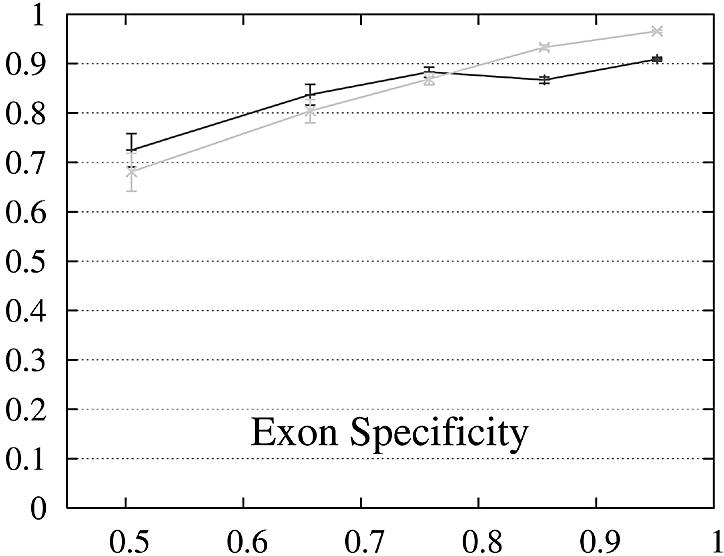
Performance of Genewise (gray) and Projector (black) as a function of the percent identity between the two protein sequences encoded in each pair of related genes. For each of the protein percent identity intervals (0, 0.6, 0.7, 0.8, 0.9, 1), the data point is drawn at the average percent identity of the protein pairs contained in that interval (the numbers of genes in the intervals are 32, 48, 126, 304 and 472, respectively). The errors indicate the statistical error of the performance value and correspond to one standard deviation. Please refer to the text (Results, section Performance) for the definition of sensitivity and specificity.
Both gene sensitivity and specificity show a strong dependence on the percent identity for both programs. Genewise outperforms Projector in sensitivity and specificity for well conserved genes (percent identity larger than 80–90%), but shows a marked decrease in performance for less similar genes. Projector’s sensitivity and specificity show a weaker dependence on percent identity and both outperform Genewise for percent identities below 80%. The genome-wide distribution of percent identities between mouse and human genes [see black entries of figure 19a in (2)] peaks at ∼90%, but the mean value is positioned at ∼60% as the distribution has a long tail towards low percent identities. The majority of gene pairs is thus found in the range where Projector outperforms Genewise. The extra information provided by explicitly modeling the similarity of exon–intron structure enhances Projector’s performance particularly in the mid to low percent identity range where protein similarity alone does not provide enough guidance.
The behavior of the gene level performance can be explained in more detail by analyzing the performance for exons, start and stop codons. The sensitivity of Genewise for detecting exons and stop codons shows a strong dependence on similarity, whereas that of Projector is more uniform and high even in the low similarity range, explaining the differences in sensitivity at gene level. The difference in specificity at gene level is more difficult to explain and seems to be mainly due to the small difference in exon specificity. Although it is smaller than the difference of the start codon specificity, it influences the gene level performance much more as there are multiple exons per gene (average 8.8).
Projector has an increased rate of wrong exons with respect to Genewise (6% opposed to only 0.3%). Most of them (59%) correspond to exons shorter than 30 bp whose length is a multiple of three. They thus do not entail frame shifts within the amino acid sequence, but only the insertion of few extra amino acids which are similar to an exonic part of the gene which was used as constraint. One possible explanation for this behavior is that predicting an extra intron and extra exon is more favorable in these cases than modeling dissimilar ends of exons using the match exon state. These wrong exons could be removed in a post-processing step which would leave the sensitivity for exons (94%) unchanged while increasing the specificity from 89 to 92% and reducing the rate of wrong exons from 6 to 3%.
In order to further study the performance of Projector we divided the test set into two subsets and evaluate the performance as a function of the protein percent identity (Fig. 3). Set 1 consists of 465 pairs of genes whose number of exons is the same and set 2 of the remaining 26 gene pairs whose number of exons is different and whose genes are therefore related by events of exon-fusion and exon-splitting. The gene sensitivity and specificity figures are relatively poor for genes with different numbers of exons. Of 33 exon-fusion and exon-splitting events, the exons involved in 13 of 33 events were predicted correctly and those of a further seven splitting events at least overlapped the annotated exons. However, Projector’s aggregate performance for start codons, stop codons and exons is about the same for both sets. There are two other factors that might influence these results: First, the genes in set 2 have on average four more exons per gene (12.7 opposed to the average value of 8.8 in the entire test set) and are also significantly longer (41 263 bp opposed to the average value of 25 355 bp in the entire test set), i.e. they are generally more challenging to predict. Second, the parameters of the underlying pairHMM were trained on a rather small training set of 36 gene pairs (1) which comprised only one gene pair which was related by exon-fusion and exon-splitting.
Figure 3.
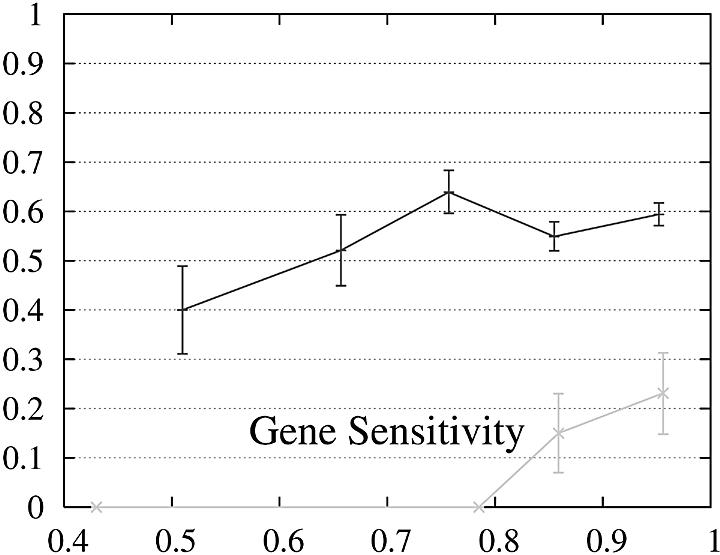
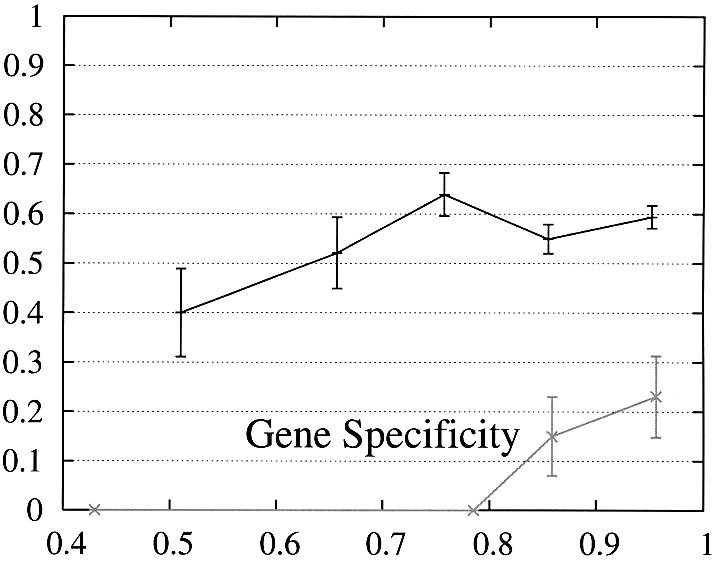
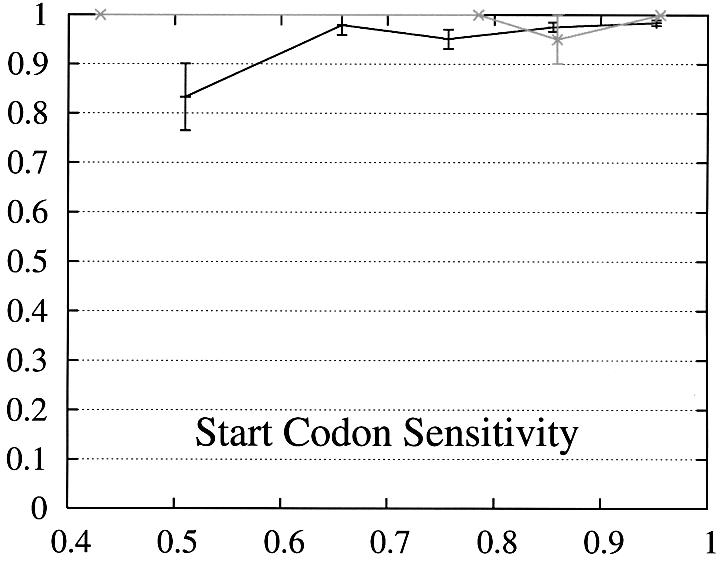
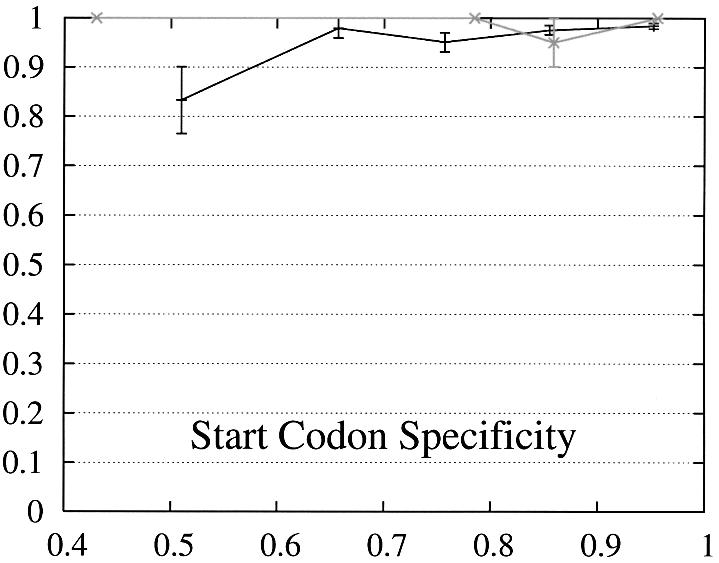
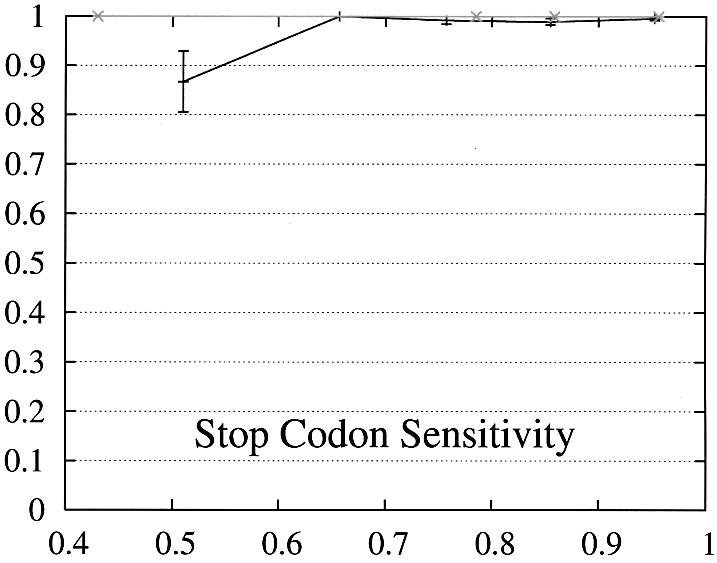
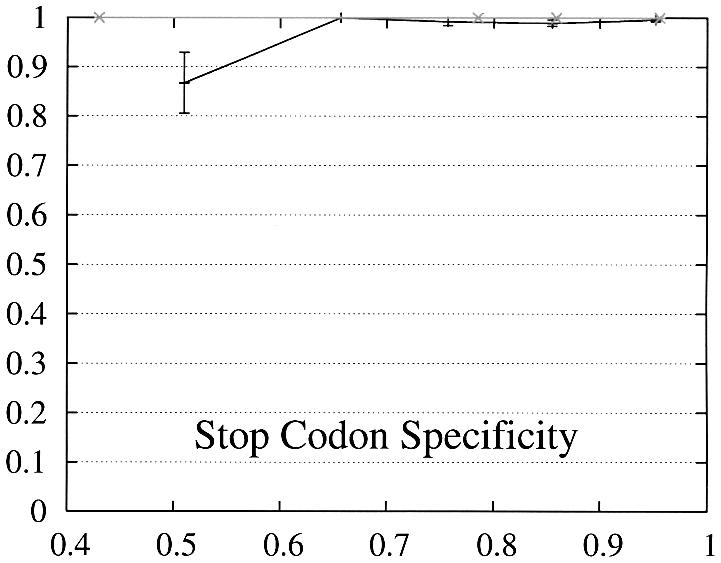
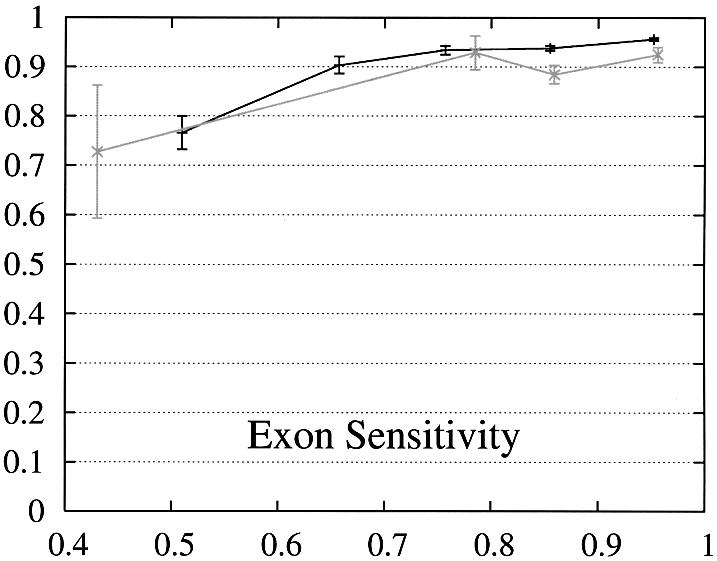
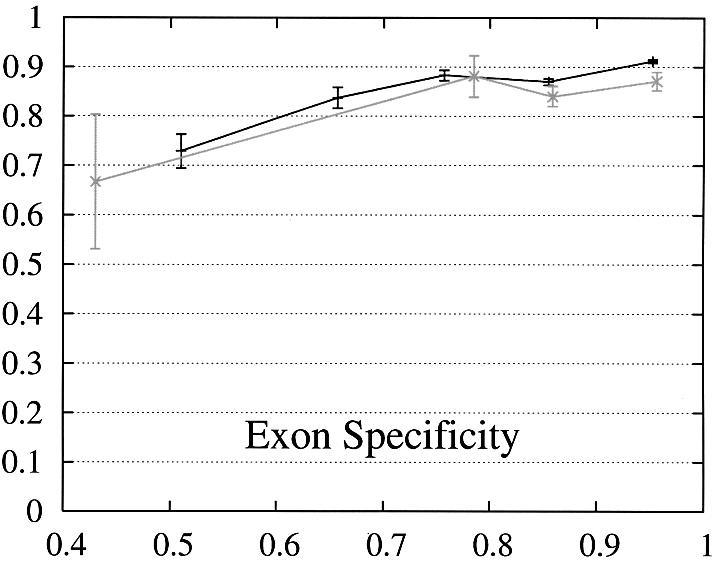
Performance of Projector as a function of the percent identity for those pairs of genes whose number of exons is the same (set 1, 465 gene pairs, black) as well as for those whose number of exons is different (set 2, 26 gene pairs, gray). The intervals are the same as in Figure 2, namely 0, 0.6, 0.7, 0.8, 0.9, 1. Again, the data point is drawn at the average percent identity of the protein pairs contained in that interval (the numbers of genes in the intervals are 30, 48,122, 284, 446 for set 1 and 2, 0, 4, 20, 26 for set 2). The errors indicate the statistical error of the performance value and correspond to one standard deviation. Please refer to the text (Results, section Performance) for the definition of sensitivity and specificity.
Projector and Genewise seem to complement each other well as Genewise seems to be particularly well suited for very well conserved gene pairs and Projector for less well conserved pairs. It is possible that the relatively lower performance of Projector in the high percent identity range is due to the lower average percent identity of its training set and that a special version of Projector for the high similarity range could be compiled by training with a dedicated set of very well conserved genes pairs.
DISCUSSION
Gene identification is still a difficult problem, as is recognized by the continuing uncertainty about the number of protein coding genes in vertebrate genomes. Although many gene prediction methods can be used across the whole genome, all recently published large genomes (1–4), have used a composite approach to identify genes such as that used by Ensembl (25), which combines different computational approaches depending on what evidence is available. Our aim in this work was to develop an improved method for a class of genes that currently are not completely correctly identified, using a type of data which is increasing in availability. In particular, we expect there will be genome sequences for organisms that do not have extensive mRNA or EST coverage, but that are related to well annotated genomes such as mouse and man with very large targeted cDNA resources and so many verified gene structures.
With more and more genomes being sequenced and analyzed, it becomes increasingly likely for a gene to have a known partner that has been experimentally validated in a related genome, and similarity based methods which explore this feature will become increasingly important. The method presented here fills an existing gap by directly using known gene structures rather than protein sequences to predict related genes. As opposed to existing protein based similarity methods which a priori do not know if and where introns are inserted into the protein sequence, Projector not only exploits the similarity of the two related genes at the protein level, but also explicitly models the similarity of their exon–intron structures, which are well conserved in evolution. Indeed the FINEX program (27) uses the exon–intron structure of proteins to search for similarity, as we are using it in gene finding. Previously Guigo et al. had incorporated some information on gene structure conservation in a post-processing step after gene prediction that required that at least one intron boundary was conserved (28).
Results on a representative test data set from the mouse and human genomes show that Projector significantly outperforms the widely used protein based gene prediction method Genewise both in terms of sensitivity and specificity in the percent identity range below 80% where the majority of gene pairs are found. Given the extra information our new method is using, it is not surprising that Projector outperforms programs like Doublescan, Pro-Gen, SLAM, CEM and Twinscan, which only have access to comparative genome sequence, not gene structures. For example, exon sensitivities are typically in the 0.7–0.8 range for these methods (though of course test sets vary), whereas they are ∼0.9 for Projector. However, of course, Projector can only predict a gene where there is an annotated one in the other sequence. The explicit modeling of gene structures should also enable Projector to avoid the mapping of known cDNA sequences to processed pseudogenes as the difference in gene structures should be heavily penalized. However, pseudogenes containing introns will still generate problems; we believe that these are best handled by dedicated methods for identifying pseudogenes.
There are several potentially interesting extensions to Projector. First, the underlying pairHMM could be extended to model full gene structures comprising also the untranslated exons. One could thereby also predict and study the similarity within the untranslated regions of genes which is something that current programs do not address. Secondly, one could try to predict conserved splice variants using the current version of Projector or a version that was carefully retrained on a larger training set. Given two splice variants of one human gene one could try and predict the corresponding two splice variants of the mouse gene, for example.
This article presents a new gene prediction method, but does not aim to propose an annotation pipeline for entire genomes. A newly sequenced genome could be prepared for an analysis with Projector by first mapping the known genes of one or more related genomes to their approximate locations within the new genome using basic alignment tools like the BLAST family of programs. The pairs of corresponding genome sections in which the main similarities occur in colinearity could then be used as input to Projector, which would predict the genes in the sequence of interest according to the known genes of the corresponding related sequence. As Projector does not require pre-aligned sequences as input and as it is capable of modeling sequences with multiple and partial genes, the selected subsequences do not have to comprise entire genes. An additional benefit of Projector compared with the existing protein based gene prediction methods is that it simultaneously predicts an alignment between the two sequences. Conserved subsequences within the non-coding regions are thus directly predicted in their gene context and can be further investigated, for example, to explore if conserved intergenic or intron sections correspond to interesting novel functional elements.
A web-server of Projector is available at www.sanger.ac.uk/Software/analysis/projector, where also the test set of known mouse and human genes as well as the set of genes predicted by Projector and Genewise can be obtained.
Acknowledgments
ACKNOWLEDGEMENTS
The authors would like to thank the anonymous referees for helpful suggestions and comments. I.M.M. would like to thank Ewan Birney for helpful suggestions concerning Genewise and Roger Pettett and Guy Coates for assistance with the web-server and the computer cluster. Throughout this work, I.M.M. was funded by a Prize Studentship of the Wellcome Trust and an External Research Studentship of Trinity College, Cambridge, UK. R.D. gratefully acknowledges support from the Wellcome Trust.
REFERENCES
- 1.International Human Genome Sequencing Consortium (2001) Initial sequencing and analysis of the human genome. Nature, 409, 860–921. [DOI] [PubMed] [Google Scholar]
- 2.Mouse Genome Sequencing Consortium (2002) Initial sequencing and comparative analysis of the mouse genome. Nature, 420, 520–562. [DOI] [PubMed] [Google Scholar]
- 3.Aparicio S., Chapman,J., Stupka,E., Putnam,N., Chia,J.M., Dehal,P., Christoffels,A., Rash,S., Hoon,S., Smit,A. et al. (2002) Whole-genome shotgun assembly and analysis of the genome of Fugu rubripes. Science, 297, 1301–1310. [DOI] [PubMed] [Google Scholar]
- 4.Zdobnov E.M., von Mering,C., Letunic,I., Torrents,D., Suyama,M., Copley,R.R., Christophides,G.K., Thomasova,D., Holt,R.A., Subramanian,G.M. et al. (2002) Comparative genome and proteome analysis of Anopheles gambiae and Drosophila melanogaster. Science, 298, 149–159. [DOI] [PubMed] [Google Scholar]
- 5.Birney E. and Durbin,R. (1997) Dynamite: a flexible code generating language for dynamic programming methods used in sequence comparison. In Gaasterland,T., Karp,P., Karplus,K., Ouzounis,C., Sander,C. and Valencia,A. (eds), Proceedings of the Fifth International Conference on Intelligent Systems for Molecular Biology. AAAI, Menlo Park, CA, pp. 56–64. [PubMed] [Google Scholar]
- 6.Birney E. and Durbin,R. (2000) Using Genewise in the Drosophila Annotation Experiment. Genome Res., 10, 547–548. [DOI] [PMC free article] [PubMed] [Google Scholar]
- 7.Gelfand M.S., Mironov,A.A. and Pevzner,P.A. (1996) Gene recognition via spliced sequence alignment. Proc. Natl Acad. Sci. USA, 93, 9061–9066. [DOI] [PMC free article] [PubMed] [Google Scholar]
- 8.Guigo R., Agarwal,P., Abril,J.F., Burset,M. and Fickett,J.W. (2000) An assessment of gene prediction accuracy in large DNA sequences. Genome Res., 10, 1631–1642. [DOI] [PMC free article] [PubMed] [Google Scholar]
- 9.Yeh R., Lim,L.P. and Burge,C.B. (2001) Computational inference of homologous gene structures in the human genome. Genome Res., 11, 803–816. [DOI] [PMC free article] [PubMed] [Google Scholar]
- 10.Novichkov P.S., Gelfand,M.S. and Mironov,A.A. (2001) Gene recognition in eukaryotic DNA by comparison of genomic sequences. Bioinformatics, 17, 1011–1018. [DOI] [PubMed] [Google Scholar]
- 11.Meyer I.M. and Durbin,R. (2002) Comparative ab initio prediction of gene structures using pair HMMs. Bioinformatics, 18, 1309–1318. [DOI] [PubMed] [Google Scholar]
- 12.Alexandersson M., Cawley,S. and Pachter,L. (2003) SLAM: cross-species gene finding and alignment with a generalized pair hidden Markov model. Genome Res., 13, 496–503. [DOI] [PMC free article] [PubMed] [Google Scholar]
- 13.Bafna V. and Huson,D.H. (2000) The conserved exon method for gene finding. In Bourne,P., Gribskov,K., Altman,R., Jensen,N., Hope,D., Lengauer,T., Mitchell,J., Scheeff,E., Smith,C., Strande,S. and Weissig,H. (eds), Proceedings of the Eighth International Conference on Intelligent Systems for Molecular Biology. AAAI, Menlo Park, CA, pp. 3–12. [PubMed] [Google Scholar]
- 14.Wiehe T., Gebauer-Jung,S., Mitchell-Olds,T. and Guigo,R. (2001) SGP-1: prediction and validation of homologous genes bases on sequence alignments. Genome Res., 11, 1574–1583. [DOI] [PMC free article] [PubMed] [Google Scholar]
- 15.Korf I., Flicek,P., Duan,D. and Brent,M.R. (2001) Integrating genomic homology into gene structure prediction. Bioinformatics, 1, 1–9. [DOI] [PubMed] [Google Scholar]
- 16.Parra G., Aagarwal,P., Abril,J.F., Wiehe,T., Fickett,J.W. and Guigo,G. (2003) Comparative gene prediction in human and mouse. Genome Res., 13, 108–117. [DOI] [PMC free article] [PubMed] [Google Scholar]
- 17.Altschul S.F., Madden,T.L., Schaffer,A.A., Zhang,J., Zhang,Z., Miller,W. and Lipman,D.J. (1997) Gapped BLAST and PSI-BLAST: a new generation of protein database search programs. Nucleic Acids Res., 25, 3389–3402. [DOI] [PMC free article] [PubMed] [Google Scholar]
- 18.Gish W. and States,D. (1993) Identification of protein coding regions by database similarity searches. Nature Genet., 3, 266–272. [DOI] [PubMed] [Google Scholar]
- 19.Durbin R., Eddy,S., Krogh,A. and Mitchison,G. (1998) Biological Sequence Analysis: Probabilistic Models of Proteins and Nucleic Acids. Cambridge University Press, Cambridge, UK. [Google Scholar]
- 20.Viterbi A. (1967) Error bounds for convolutional codes and an asymptotically optimum decoding algorithm. IEEE Trans. Information Theory, 13, 260–269. [Google Scholar]
- 21.Levine A. (2001) Bioinformatics approaches to RNA splicing. MPhil Thesis, University of Cambridge, UK.
- 22.Burge C. and Karlin,S. (1997) Prediction of complete gene structures in human genomic DNA. J. Mol. Biol., 268, 78–94. [DOI] [PubMed] [Google Scholar]
- 23.Meyer I.M. (2002) Mathematical methods for comparative ab initio gene prediction. PhD Thesis, University of Cambridge, UK.
- 24.Hirschberg D.S. (1975) A linear space algorithm for computing maximal common subsequences. Commun. ACM, 18, 341–343. [Google Scholar]
- 25.Hubbard T., Barker,D., Birney,E., Cameron,G., Chen,Y., Clark,L., Cox,T., Cuff,J., Curwen,V., Down,T. et al. (2002) The Ensembl genome database project. Nucleic Acids Res., 30, 38–41. [DOI] [PMC free article] [PubMed] [Google Scholar]
- 26.Pruitt K.D. and Maglott,D.R. (2001) Refseq and Locuslink: NCBI gene-centered resources. Nucleic Acids Res., 29, 137–140. [DOI] [PMC free article] [PubMed] [Google Scholar]
- 27.Brown N.P., Whittaker,A.J., Newell,W.R., Rawlings,C.J. and Beck,S. (1995) Identification and analysis of multigene families by comparison of exon fingerprints. J. Mol. Biol., 249, 342–359. [DOI] [PubMed] [Google Scholar]
- 28.Guigo R., Dermitzakis,E.T., Agarwal,P., Ponting,C.P., Parra,G., Reymond,A., Abril,J.F., Keibler,E., Lyle,R., Ucla,C., Antonarakis,S.E. and Brent,M.R. (2003) Comparison of mouse and human genomes followed by experimental verification yields an estimated 1,019 additional genes. Proc. Natl Acad. Sci. USA, 100, 1140–1145. [DOI] [PMC free article] [PubMed] [Google Scholar]


