Abstract
Mitogen activated protein kinases (MAPKs), such as c-Jun N-terminal kinase (JNK) and P38, have been reported to play important roles in energy homeostasis. In this study, we show that the activity of extracellular signal-regulated kinase (ERK) is increased in the livers of diet induced and genetically obese mice. Activation of ERK in the livers of lean mice by over-expressing the constitutively active MAPK kinase 1 (MEK CA) results in decreased energy expenditure, lowered expression of genes involved in fatty acid oxidation, increases fasting hyperglycemia and causes systemic insulin resistance. Interestingly, hepatic glycogen content is markedly increased and expression of G6Pase gene is decreased in mice over-expressing MEK CA compared to control mice expressing green fluorescent protein (GFP), therefore hepatic glucose output is not likely the major contributor of hyperglycemia. One potential mechanism of decreased expression of G6Pase gene by MEK CA is likely due to ERK mediated phosphorylation and cytosolic retention of FOXO1. Adipocytes isolated from MEK CA mice display increased lipolysis. Circulating levels of free fatty acids (FFAs) in these mice are also increased, which possibly contribute to systemic insulin resistance and subsequent hyperglycemia. Consistent with these results, knocking down ERK expression in the liver of diet induced obese (DIO) mice improves systemic insulin sensitivity and glucose tolerance. These results indicate that increased hepatic ERK activity in DIO mice may contribute to rincreased liver glycogen content and decreased energy expenditure in obesity.
1. Introduction
Obesity is becoming an epidemic disease and obesity-related metabolic disorders have posed a major public health burden. Extensive studies have revealed numerous pathways that are linked to obesity-related insulin resistance and type 2 diabetes. Among these pathways, mitogen activated protein kinase (MAPK) signaling pathways, such as c-Jun N terminal kinase (JNK) and P38, have been shown to play important roles (Collins et al., 2006; Hirosumi et al., 2002; Liu et al., 2007; Solinas et al., 2007; Vallerie et al., 2008; Vallerie and Hotamisligil, 2010; Zhang et al., 2011). In contrast, the role of extracellular signal-regulated kinase (ERK) in energy homeostasis has not been extensively explored. Earlier studies regarding the function of ERK in metabolism were mainly focused on in vitro adipogenesis. The initial data appeared to be contradictory since opposite effects of ERK on adipogenesis have been reported by different laboratories (Bost et al., 2005a; Camp and Tafuri, 1997; Font de Mora et al., 1997; Hu et al., 1996; Prusty et al., 2002). Later a consensus scenario was hypothesized that ERK is necessary for initiating preadipocyte differentiation but is inhibitory for adipocyte maturation (Bost et al., 2005a). Recently, the ERK signaling pathway has also been found to be dysregulated in obesity. The activity of both ERK1 and 2 are shown to be increased in adipose tissue of diet induced obese (DIO) mice and ERK1 deficient mice are protected from developing high fat diet induced obesity, which is possibly due to impaired in vivo adipogenesis (Bost et al., 2005b). Leptin deficient ob/ob mice deficient in ERK1 are also protected from developing hyperglycemia without reduction in adiposity (Jager et al., 2011). Deficiency of the signaling adaptor p62, a protein that antagonizes basal ERK activity, promotes adipogenesis in vitro and mature-onset obesity and insulin resistance in vivo (Rodriguez et al., 2006).
In addition to adipose tissue, ERK activity is found to increase in the liver of genetically obese Zucker (fa/fa) rats and caloric restriction resulted in improved insulin sensitivity, which is accompanied by decreased hepatic activities of ERK and p70S6K (Zheng et al., 2009). Our recent publication demonstrated that constitutive activation of the ERK pathway suppresses expression of glucose-6-phosphatase (G6Pase) gene, a key enzyme in de novo glucose synthesis, and decreases glucose output in cultured Fao hepatoma cells (Feng et al., 2012). Based on these in vitro data and the beneficial phenotype of ERK1 knock out DIO mice, we hypothesize that activation of the ERK pathway in the liver stimulates glycogen synthesis by attenuating hepatic glucose output. Shortage of glucose supply from the liver may promote fat mobilization through increasing lipolysis of adipose tissue, which possibly elevates FFA levels in the circulation. Increased hepatic ERK activity in obese mice may contribute to insulin resistance. In the present study, we revealed that phosphorylation levels of ERK 1/2 are significantly increased in the livers of ob/ob and DIO mice. The role of hepatic ERK on energy metabolism was explored by both gain and loss-of-function studies. The gain-of-function study was performed by using adenovirus mediated over-expression of the constitutively active MEK1, which is the immediate upstream activating kinase of ERK1/2. The loss-of-function study was implemented with adenovirus-mediated expression of a short hairpin interfering RNA (shRNA) against ERK 1/2.
2. Materials and methods
2.1. Reagents and cells
Phospho-ERK, tERK and MEK1 antibodies were purchased from Cell signaling (Danvers, MA). Tubulin antibody was purchased from Abcam (Cambridge, MA). MKP-3 antibody was purchased from Santa Cruz Technology (Santa Cruz, CA). Fao cells were provided by Dr. Zhidan Wu (Novartis Institutes for Biomedical Research) and cultured in RPMI 1640 supplemented with 10% fetal bovine serum (Xu et al., 2005).
2.2. RNA extraction and real-time PCR analysis
RNA samples were extracted from tissues using the TRIzol reagent (Invitrogen, Carlsbad, CA) according to the manufacturer’s instructions. DNase I-treated RNA samples were reverse-transcribed with SuperScript III reverse transcriptase (Applied Biosystems, Carlsbad, CA) and random hexamers (Invitrogen) to generate cDNA. Real-time PCR analysis was performed using Power SYBR Green RT-PCR Reagent (Applied Biosystems) on ABI Prism thermal cycler model StepOnePlus (Applied Biosystems). Each 15µl PCR reaction contained 1× reaction mix, 5.5mM MgSO4, 300nM forward primer, and 300nM reverse primer. The thermal cycling program was 50°C for 2 minutes, followed by 95°C for 10 minutes for 1 cycle, then 95°C for 15 seconds, followed by 60°C for 1 minute for 40 cycles. The melting curve analysis was performed to ensure the specificity of primers. 28S rRNA was used as a reference gene in each reaction. The sequences of real-time PCR primers are as the follows:
PEPCK 5’ CTGCATAACGGTCTGGACTTC, 3’ CAGCAACTGCCCGTACTCC
G6Pase 5’ CGACTCGCTATCTCCAAGTGA, 3’ GTTGAACCAGTCTCCGACCA
MKP-3, 5’ ATAGATACGCTCAGACCCGTG, 3’ ATCAGCAGAAGCCGTTCGTT
FAS, 5’ GGCTCTATGGATTACCCAAGC, 3’ CCAGTGTTCGTTCCTCGGA
ACC1, 5’ CGGACCTTTGAAGATTTTGTGAGG, 3’ GCTTTATTCTGCTGGGTGAACTCTC
ACC2, 5’ GGAAGCAGGCACACATCAAGA, 3’ CGGGAGGAGTTCTGGAAGGA
PPARα 5’ AGAGCCCCATCTGTCCTCTC, 3’ ACTGGTAGTCTGCAAAACCAAA
CPT-1β 5’ GCACACCAGGCAGTAGCTTT, 3’ CAGGAGTTGATTCCAGACAGGTA
VLCAD 5’ TCAGGTGTTCCCATACCCATC, 3’ AAGGCGTCGTTCTTGGCAG
2.3. Western blot analysis
Tissues and cells were homogenized and lysed with ice-cold lysis buffer supplemented with protease inhibitors. Protein lysates were separated on 4–12% Bis-Tris-PAGE gel, transferred onto polyvinylidene difluoride membranes followed by blocking for 60 minutes in 1% bovine serum albumin/1×Tris-buffered saline with Tween-20 (TBST) or 5% nonfat dry milk/1×TBST. Membranes were then incubated with the corresponding primary antibodies in the presence of 1% bovine serum albumin/1×TBST or 5% nonfat dry milk/1×TBST overnight on a rocker at 4°C. After thorough washes in 1×TBST, membranes were exposed to corresponding horseradish peroxidase-linked secondary antibodies in 5% nonfat dry milk/1×TBST for 1 hour at room temperature. After thorough washes in 1×TBST, signals were detected with a chemiluminescence western blotting detection solution (PerkinElmer, Waltham, MA) on the Alpha-Inotech fluorochem imaging system.
2.4. Construction and purification of adenovirus
To construct the adenoviral vector for the constitutively active MEK1 (MEK1 S218DS222D) (Brunet et al., 1994), the coding sequence of rat MEK S218DS222D was amplified by PCR, cloned into the entry vector and sequence confirmed. The coding sequence was then recombined into the Gateway-based pAd-CMV DEST™ vector (Invitrogen) according to the manufacturer’s instructions. In order to construct adenoviral vectors expressing short hairpin interfering RNAs (shRNAs) against ERK, twelve short hairpin oligonucleotides and complementary strands were designed to target both rat and mouse ERK1 or 2 or both. The BLOCK-iT™ RNAi system (Invitrogen) was used for shRNA construction. Briefly, the top and bottom oligonucleotides were annealed and ligated into the Gateway-based pENTR/U6 vector (Invitrogen) and sequence confirmed. Then pENTR/U6-shRNA plasmids were recombined into the Gateway-based pAd-BLOCK-iT DEST™ vector (Invitrogen), according to the manufacturer’s instructions. ERK knocking down efficiency was tested in cultured mouse liver cells. The sequence of ERK shRNA used for in vivo study is as the follow, which targets both ERK1 and 2: gcaatgaccacatctgcta. Amplification of recombinant adenovirus was performed according to the manufacturer’s instructions (Invitrogen) using HEK 293A cells. Adenoviruses were purified using the ViraBind™ Adenovirus Purification Kit (Cell Biolabs Inc.) and quantified using Biorad protein assay kit. Purified virus was tittered to ensure proper activity.
2.5. Mice maintenance and analysis
Male C57BL/6 mice were purchased from the Jackson Laboratory and used for all studies. To examine endogenous ERK phosphorylation and expression, livers were collected from 9 week old male ob/ob mice (the Jackson Laboratory) and male DIO mice fed on a high fat diet (60% kcal from fat, D12492, Research Diets) for 24 weeks starting at four weeks of age. Lean male C57BL/6 mice of 12 weeks of age were used for fed/overnight fasting experiments. For MEK CA over-expression studies, male C57BL/6 mice were purchased at the age of 10–15 weeks. Mice were kept on a 12-hour light/dark cycle and given ad libitum access to food and water. After one week of acclimation, mice were randomized to two groups with equal body weight and postprandial glucose levels. Adenovirus expressing MEK CA or GFP was injected at the dose of 5×10¹¹ particles per mouse through the tail vein. For ERK knockdown study, male C57BL/6 mice were purchased at the age of 3 weeks. After one week of acclimation, mice were fed on a high-fat diet (60% kcal from fat) for 38 weeks. Then mice were randomized to two groups with equal body weight and postprandial glucose levels for adenovirus injection. Adenovirus expressing shERK1/2 was injected at the dose of 1×10¹² particles per mouse through tail vein. At the end of study, mice were sacrificed by CO2 asphyxiation after an overnight fast. Cardiac punch was performed to collect sufficient amount of blood for measuring metabolic parameters. Tissue samples were rapidly dissected and frozen for further studies. All animal procedures used in our studies were approved by the Institutional Animal Care and Use Committee of Rhode Island Hospital.
2.6. Glucose and insulin tolerance tests
For glucose tolerance test (GTT), mice were fasted overnight and then injected with glucose at the dose of 2g/kg for chow-fed male mice or at the dose of 0.75g/kg for DIO mice. Blood glucose levels were measured at 0, 15, 30, 45, 60 and 90 minutes post injection. For insulin tolerance test (ITT), mice were fasted for 6 hours and injected with insulin at the dose of 0.5U/kg for chow-fed male mice and 1.5U/kg for DIO mice. Blood glucose levels were measured every 15 minutes up to 90 minutes post injection.
2.7. Indirect calorimetry
Oxygen consumption (VO2), carbon dioxide production (VCO2), and food intake were measured individually for 24 hours using the comprehensive lab animal monitoring system (Columbus Instruments, Columbus, OH) after one-day of acclimation. During the experiment, mice had free access to food and water. Energy expenditure was calculated using the following formula: VO2×(3.815+1.232×RQ), and normalized with respect to the animal body weight and corrected according to an effective mass value, which is body mass0.75.
2.8. Histological analysis
Liver tissues were fixed in 10% neutrally buffered formalin for one day, then transferred to 70% ethanol and paraffin embedded. Glycogen (PAS) staining was done at Rhode Island Hospital core laboratory.
2.9. Measurement of triglyceride (TAG) and free fatty acid (FFA) contents
The content of hepatic TAG was determined using homogenates of liver. Frozen tissues were weighed, pulverized in liquid nitrogen, homogenized in ethanol, vortexed, centrifuged, and the supernatant was collected for measurement. TAG standards or samples were mixed with the reaction buffer (100mM Tris, pH7.4, 1mM MgCl2, 0.05mM ATP, 0.2U/ml horse radish peroxidase, 1U/ml glycerol phosphate oxidase, 2U/ml glycerol kinase, 25U/ml lipase, and 0.05mM Amplex red) and incubated for 30 minutes at 37°C. For measuring plasma FFA content, FFA standards or samples were mixed with the reaction buffer (100mM Tris, pH7.4, 1mM MgCl2, 0.05mM ATP, 0.2U/ml horse radish peroxidase, 0.05U/ml acyl CoA synthetase, 0.05U/ml acyl CoA oxidase, 0.04mM CoA, 0.004mM FAD and 0.05mM Amplex red) and incubated for 30 minutes at 37°C. The fluorescence was read at excitation 530nm/emission 590nm using Synergy 4 plate reader (BioTek Instruments, Winooski, VT).
2.10. Isolation of primary adipocytes
Mice were fasted overnight and primary adipocytes were obtained from gonadal fat pads as described previously (Feng et al., 2011; Jiao et al., 2011). Briefly, adipocytes were isolated from gonadal fat pads of mice by collagenase (1mg/ml, Type I) digestion. Gonadal fat pads were dissected, weighted, rinsed and cut into small pieces in isolation buffer. Minced fat pads were digested at 37°C for 30 minutes, and then filtered through 380µM mesh to get single cell suspension. After centrifugation at 1000 rpm, floating adipocytes were collected and rinsed twice with isolation buffer.
2.11. Lipolysis in isolated adipocytes
Isolated adipocytes were incubated in isolation buffer plus vehicle or 1µM isoproterenol for 1 hour. Samples were centrifuged and supernatants were heated at 80°C. For measuring glycerol release, glycerol standards or samples were mixed with the reaction buffer (100mM Tris, pH7.4, 1mM MgCl2, 0.05mM ATP, 0.2U/ml horse radish peroxidase, 1U/ml glycerol phosphate oxidase, 2U/ml glycerol kinase, and 0.05mM Amplex red) and incubated for 30 minutes at 37°C. The fluorescence was read at excitation 530nM/emission 590nM using Synergy 4 plate reader.
2.12. Nuclear localization of FOXO1-GFP fusion protein
Fao cells were infected with adenovirus expressing β-gal or MEK CA on 12-well plates. Twenty-four hours later these cells were transfected with pcDNA-FOXO1-GFP. Forty-eight hours after transfection, cells were incubated in serum-free medium for sixteen hours, then incubated in glucose-free, serum-free DMEM supplemented with 1µM dexamethasone, 2mM puryvate and 20mM lactate for another three hours. Cells were then fixed in 10% formalin for 30 minutes at room temperature and incubated with 1µg/ml DAPI for 1h at 37°C. Pictures were taken from replicate wells. The percentage of nuclear FOXO1 localization was calculated by dividing the number of green cells with predominant nuclear localization to the total number of green cells.
2.12. Statistical analysis
Results are presented as mean ± SEM. Statistical significance was determined at P<0.05. Student’s t-test was used to compare differences between two groups.
3 Results
3.1. Activation of ERK affects liver glucose and lipid homeostasis
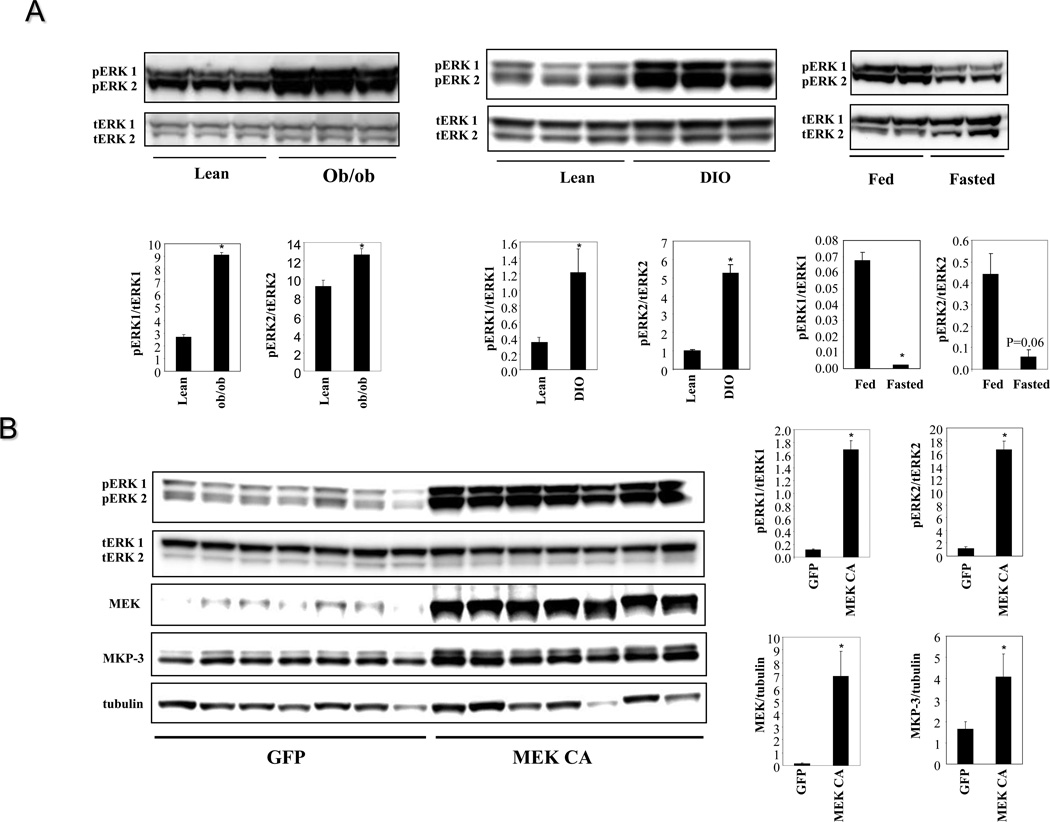
To investigate whether ERK activity changes in the liver of obese mice, phosphorylation status of ERK1/2 was examined using liver lysates from ob/ob, DIO (twenty four weeks on a high fat diet) and lean control mice. Phosphorylation levels of both ERK isoforms are markedly increased in the livers of both ob/ob and DIO mice compared to control mice (Figure 1A). The increase of ERK phosphorylation in the livers of DIO mice appears in the later stage of obesity development since ERK phosphorylation in the livers of DIO mice fed on a high fat diet for sixteen weeks did not have significant increase (data not shown). The phosphorylation of ERK1/2 in the livers of lean mice can be decreased by fasting (Figure 1A), indicating a role in response to changes of energy status.
Figure 1. Hepatic ERK activation in obese mice and constitutive activation of ERK in the livers of lean mice.
A. Phosphorylation levels of ERK1/2 in the livers of male ob/ob and DIO mice vs lean controls (n=3 each group, DIO mice were on a high fat diet for 24 weeks) and in the livers of fed vs fasted lean mice (n=2 each group). B. Over-expression of the constitutively active MEK1 (MEK CA) in the livers of lean male C57BL/6 mice (n=7 each group). Mice were sacrificed seven days post virus injection in fasted state. * P<0.05, ob/ob vs. lean, DIO vs. lean, fasted vs. fed, or mice injected with MEK CA vs. GFP controls.
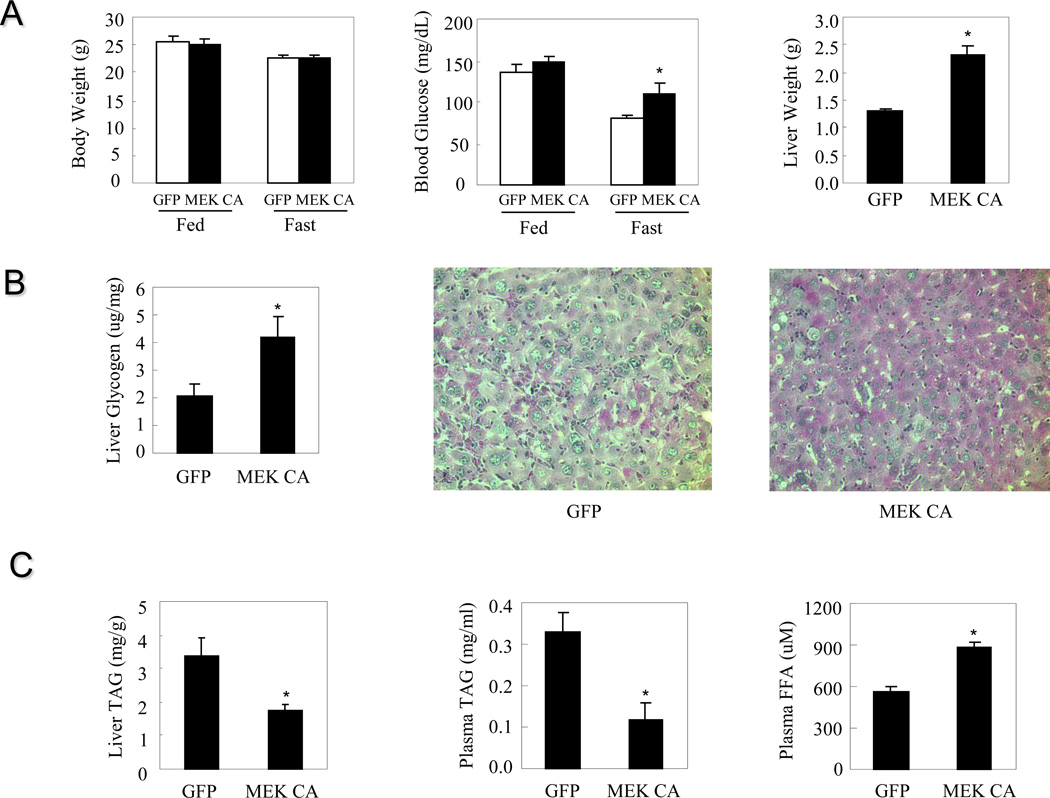
To understand the consequences of sustained ERK1/2 activation on metabolism, the constitutively active rat MEK1 S218DS222D (MEK CA) was over-expressed in the livers of lean mice. Immunoblot analysis confirmed hepatic over-expression of MEK CA and increased phosphorylation levels of ERK1/2 (Figure 1B). The expression of MKP-3 protein, a MAP kinase phosphatase with a high specificity for ERK, is significantly increased due to a potential negative feedback mechanism to restrict ERK activity (Figure 1B). Constitutive hepatic ERK activation for seven days did not affect body weight or postprandial blood glucose levels but significantly increased fasting blood glucose levels and liver weights (Figure 2A).
Figure 2. Hepatic ERK activation in lean mice and the effect on glucose and lipid homeostasis.
Mice were sacrificed seven days post virus injection. A. Effect on body weight, blood glucose levels and liver weight (n=7 each group). B. Effect on liver glycogen content. C. Effect on hepatic and plasma triglycerides as well as plasma free fatty acids (n=6–9 each group). * P<0.05, mice injected with adenovirus expressing MEK CA vs. mice injected with adenovirus expressing GFP.
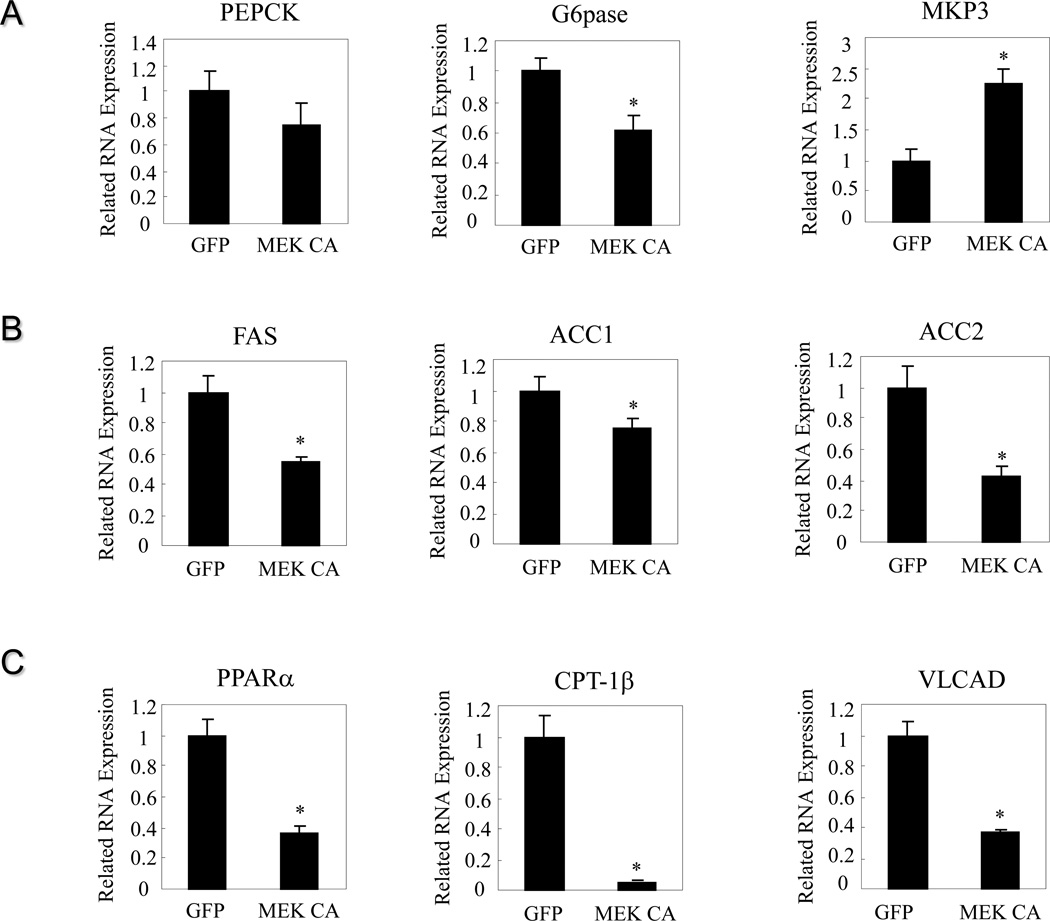
To assess the potential contributor to increased liver weight, hepatic glycogen and triglyceride (TAG) contents were measured. Livers from mice injected with adenovirus expressing MEK CA contain almost twice as much glycogen compared to livers from mice injected with adenovirus expressing GFP (Figure 2B). PAS staining also confirmed increased glycogen content in the livers expressing MEK CA, showing as pinkish purple staining (Figure 2B). Hepatic TAG content was significantly reduced in the presence of sustained ERK signaling (Figure 2C), indicating that increased liver weight is most likely due to increased glycogen content. Plasma TAG levels are significantly lower and plasma FFA levels are significantly higher in mice injected with Ad-MEK CA compared to control mice injected with Ad-GFP. These data also indicate that increased hepatic glucose output is unlikely a major contributor of fasting hyperglycemia. Indeed, gene expression of G6Pase is significantly repressed by ERK activation, suggesting attenuated glucose output (Figure 3A). In contrast, gene expression of MKP-3 is elevated (Figure 3A), consistent with increased MKP-3 protein expression (Figure 1B). Decreased expression of genes involved in lipid synthesis, such as fatty acid synthase (FAS), acetyl CoA carboxylase 1 (ACC1) and 2 (ACC2), are observed in the livers with sustained ERK activation (Figure 3B), which is consistent with lower TAG content. Expression level of genes involved in fatty acid oxidation, such as peroxisome proliferator-activated receptor a (PPARa), carnitine palmitoyltransferase-1β (CPT-1β) and very long-chain acyl coenzyme A dehydrogenase (VLCAD), are significantly decreased (Figure 3C), indicating decreased energy expenditure.
Figure 3. Hepatic ERK activation in lean mice and the effect on expression of genes involved in glucose and lipid metabolism.
Mice were sacrificed seven days post virus injection. A. Effect on expression of genes involved in gluconeogenesis. B. Effect on expression of genes involved in lipid synthesis. C. Effect on expression of genes involved in fatty acid oxidation. * P<0.05, mice injected with adenovirus expressing MEK CA vs. mice injected with adenovirus expressing GFP.
3.2. Hepatic ERK activation affects energy expenditure
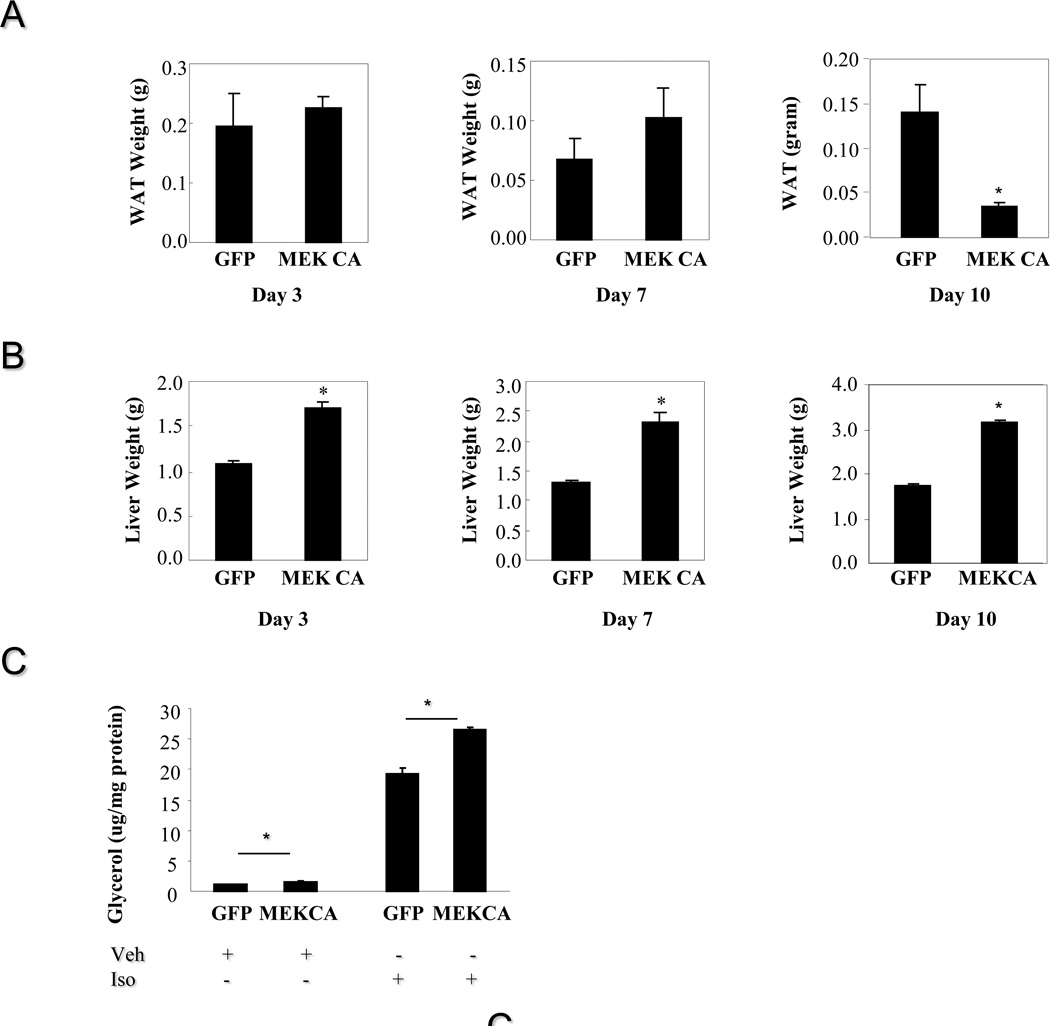
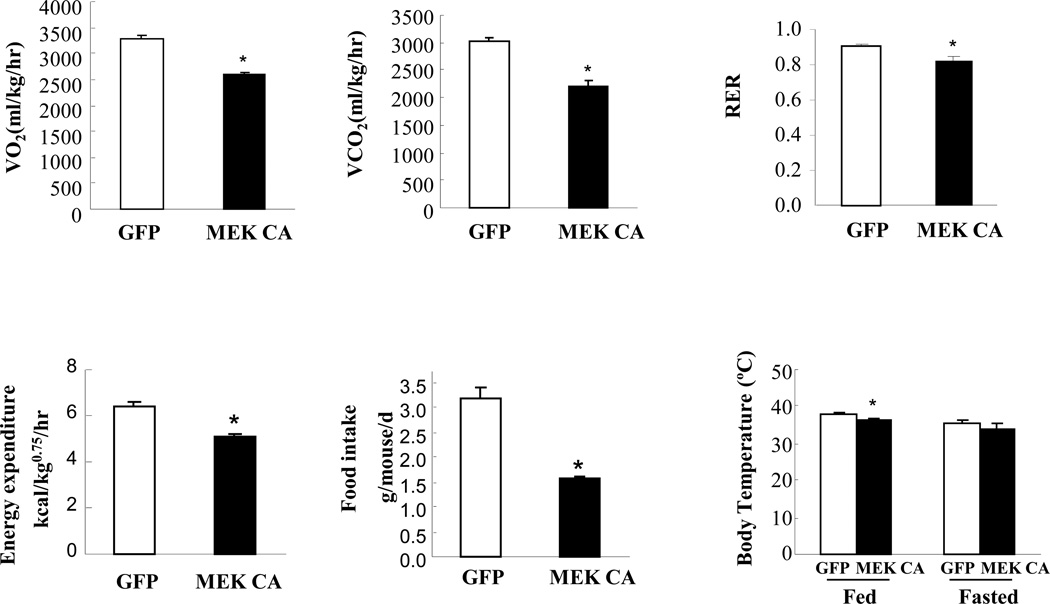
Constitutive hepatic ERK activation did not affect adiposity up to seven days post virus injection. Weights of epididymal fat depot from mice injected with Ad-MEK CA were markedly reduced ten days post virus injection while liver weights remain elevated at all time points in mice injected with Ad-MEK CA (Figure 4A–B). Adipocytes isolated from mice injected with Ad-MEK CA displayed higher lipolytic activity under both basal and isoproterenol-stimulated conditions (Figure 4C). Increased lipolysis is likely the major contributor to elevated circulating FFA levels and decreased adipose mass in mice with constitutive ERK activation in the liver for a longer time. Metabolic cage study revealed decreased oxygen consumption, lower carbon dioxide release, decreased energy expenditure and decreased food intake in mice injected with Ad-MEK CA compared to mice administered with Ad-GFP (Figure 5). Core body temperature was also significantly lower in mice injected with Ad-MEK CA in fed state and trended down in fasted state (Figure 5).
Figure 4. Hepatic ERK activation and adiposity.
A. Weights of epididymal fat depot from lean male mice injected with adenovirus expressing MEK CA for 3, 7 and 10 days (n=5–9 each group). B. Weights of liver from lean male mice injected with adenovirus expressing MEK CA for 3, 7 and 10 days. C. Effect of hepatic ERK activation on lipolysis. * P<0.05, mice injected with adenovirus expressing MEK CA vs. mice injected with adenovirus expressing GFP.
Figure 5. Hepatic ERK activation and the effect on energy expenditure.
Mice were put into metabolic cages three days post virus injection for three consecutive days. Oxygen consumption, carbon dioxide release, respiratory exchange ratio, energy expenditure, food intake and body temperature were determined in lean male mice injected with adenovirus expressing MEK CA (n=3–8 each group). * P<0.05, mice injected with adenovirus expressing MEK CA vs. mice injected with adenovirus expressing GFP. VO2, volume of oxygen consumed; VCO2, volume of carbon dioxide produced; RER, respiratory exchange ratio.
3.3. Hepatic ERK activation impairs insulin sensitivity
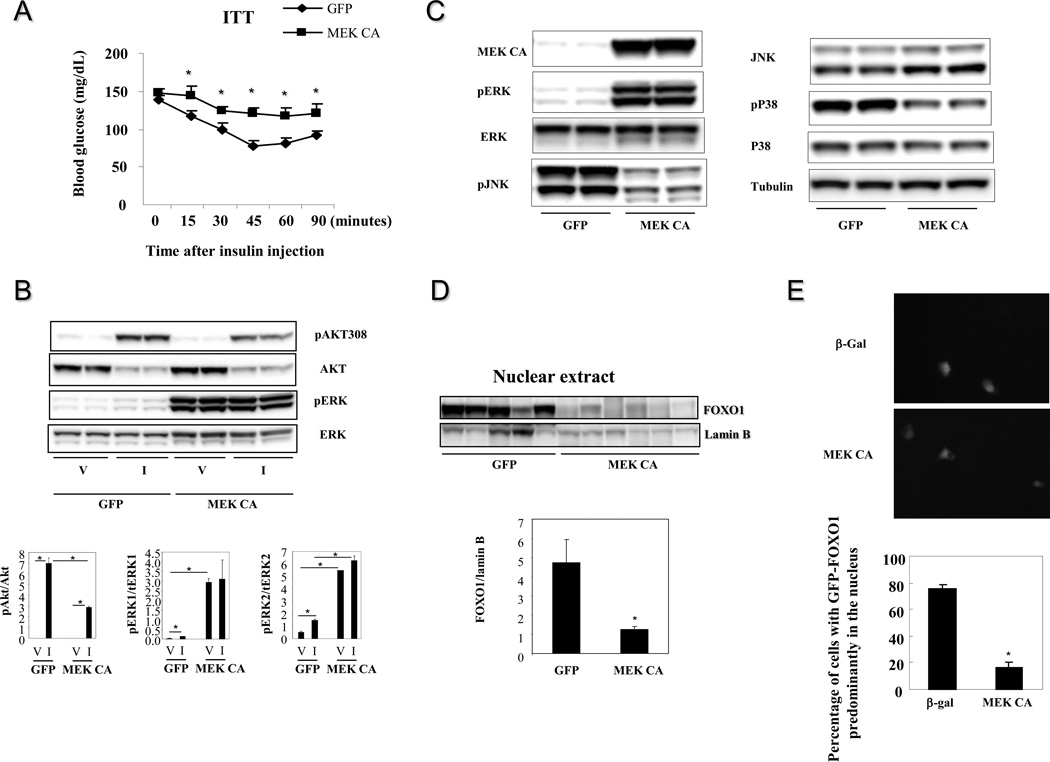
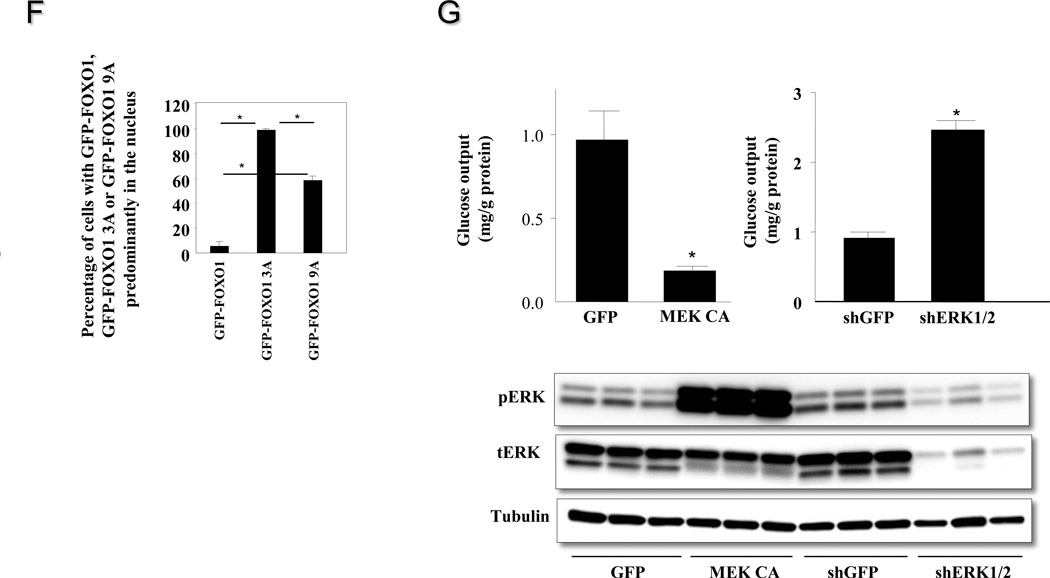
To dissect the effect of hepatic ERK activation on systemic insulin sensitivity, insulin tolerance test was performed. Blood glucose levels of mice injected with Ad-MEK CA are significantly higher than mice injected with Ad-GFP at all time points examined except for the 0 minute time point (Figure 6A). As we described earlier, hepatic ERK activation increased overnight fasting but not postprandial blood glucose levels. For insulin tolerance test, mice were only deprived of food for six hours, which was not considered as a real fasting. To address the potential mechanism of ERK-induced insulin resistance, the effect of ERK activation on insulin-induced Akt phosphorylation was assessed in Fao cells over-expressing MEK CA. Phosphorylation of Akt on Thr 308 was significantly reduced in the presence of ERK activation (Figure 6B). Constitutive MEK activation repressed activities of JNK and P38 (Figure 6C), therefore JNK and P38 unlikely contribute to observed defective insulin signaling. It has been reported that ERK phosphorylates nine Ser residues on FOXO1 (Ser 246, Ser 284, Ser 295, Ser 326, Ser 413, Ser 415, Ser 429, Ser 467, Ser 475) (Asada et al., 2007), which is a key transcription factor for initiating the gluconeogenic program including promoting transcription of G6Pase gene. To explain the effect of ERK activation on reducing G6Pase gene expression and increasing glycogen content, the effect of hepatic ERK activation on FOXO1 nuclear translocation was examined. As shown in figure 6D, nuclear FOXO1 contents were significantly reduced in the livers of lean mice over-expressing MEK CA compared to control mice over-expressing GFP, indicating attenuated FOXO1 activity. Consistently, over-expression of MEK CA in Fao hepatoma cells also retained most GFP-FOXO1 fusion protein in the cytosol under the gluconeogenic condition (Figure 6E). Furthermore, the ERK phosphorylation resistant FOXO1 mutant (GFP-FOXO1 9A), with nine serine residues mutated to alanine, has significantly increased nuclear translocation compared to wild type GFP under normal culture condition (Figure 6F). However, this nuclear translocating effect of GFP-FOXO1 9A is less than that of Akt phosphorylation resistant FOXO1 mutant (GFP-FOXO1 3A). Finally, ERK activation by MEK CA over-expression in primary hepatocytes decreased glucose output whereas reduced ERK expression in primary hepatocytes increased glucose output (Figure 6G).
Figure 6. ERK activation and the effect on insulin sensitivity.
A Hepatic ERK activation and the effect on insulin tolerance (n=6–7 each group). Adenoviruses expressing GFP or MEK CA were injected at the dose of 5×10¹¹ particles per mouse. * P<0.05, mice injected with adenovirus expressing MEK CA vs. mice injected with adenovirus expressing GFP. B. ERK activation and the effect on insulin signaling in Fao cells. Fao cells were infected with adenovirus expressing MEK CA or GFP. Forty-eight hours later, cells were incubated in serum-free medium overnight, the treated with vehicle or 100ng/ml insulin for 15 minutes. Data presented is one of three independent experiments. V, vehicle; I, insulin. * P<0.05 as indicated. C. Effects of constitutive MEK activation on JNK and p38 signaling. D. Hepatic ERK activation and the effect on FOXO1 nuclear localization (n=5–6 each group). Mice from 6A were sacrificed in fasted state two days after glucose tolerance test for preparation of nuclear extract from the liver. Lamin B, a type V intermediate filament in the nuclear lamina, is used as a nuclear protein loading control. * P<0.05, mice injected with adenovirus expressing MEK CA vs. mice injected with adenovirus expressing GFP. E. Effect of MEK CA on nuclear translocation of FOXO1-GFP fusion protein in Fao cells. Data presented is one of four independent experiments. * P<0.05, cells over-expressing MEK CA vs cells expressing GFP. F. Percentage of nuclear localization of Akt and ERK phosphorylation resistant GFP-FOXO1 3A and GFP-FOXO1 9A mutants. Cells were fixed under normal culture condition. Data presented is one of three independent experiments. * P<0.05 as indicated. G. Glucose output in primary mouse hepatocytes with ERK activation and knockdown. * P<0.05, cells over-expressing MEK CA or with ERK knockdown vs cells expressing GFP or shGFP.
3.4. Knocking down ERK in the livers of DIO mice restores insulin sensitivity
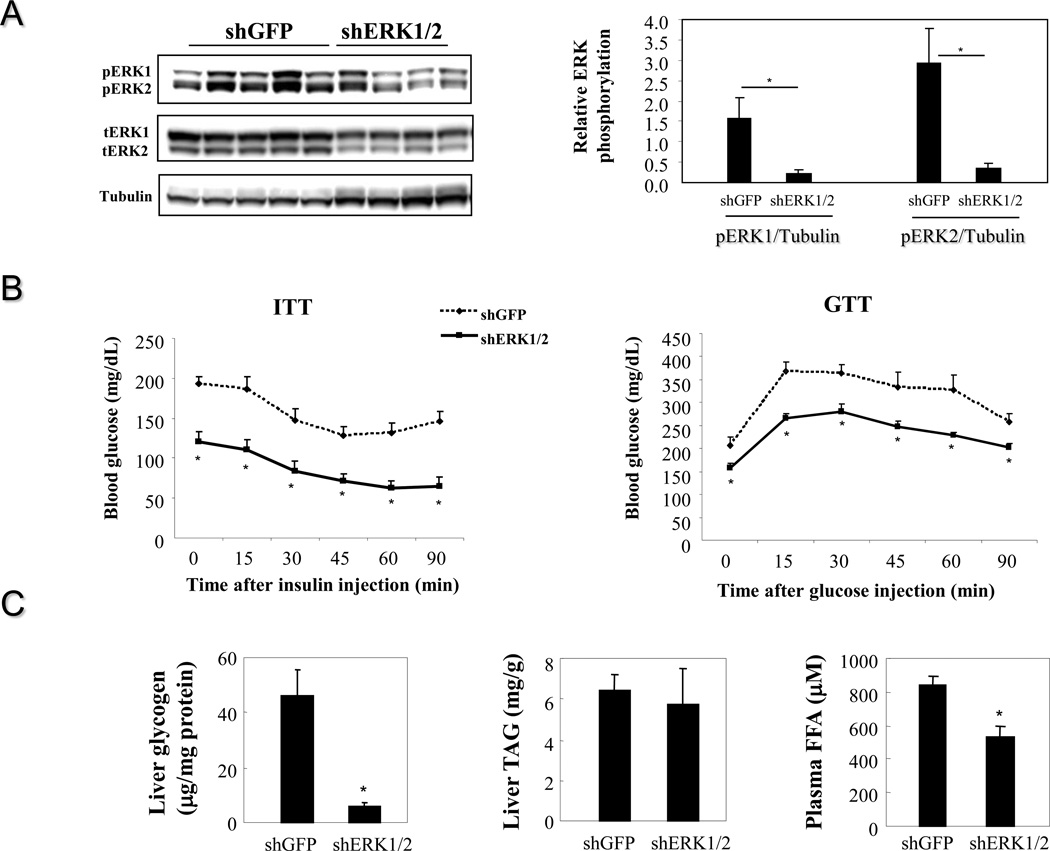
To study whether attenuation of ERK signaling in the livers of obese mice has any beneficial effect on insulin sensitivity, hepatic ERK levels of DIO mice fed on a high fat diet for 38 weeks were reduced by a short hairpin interfering RNA targeting a consensus sequence of both ERK1 and ERK2 (shERK1/2). ShERK1/2 reduced protein levels of both ERK 1 and 2, resulting in significantly decreased ERK1/2 phosphorylation (Figure 7A). Insulin sensitivity and glucose tolerance were significantly improved in DIO mice injected with adenovirus expressing shERK1/2 compared to control mice expressing shGFP (Figure 7B), indicating that endogenous hepatic ERK activity in obesity contributes to systemic insulin resistance. Liver glycogen contents were significantly reduced in DIO mice injected with adenovirus expressing shERK1/2 compared to control DIO mice injected with shGFP (Figure 7C) but liver TAG contents were not altered by attenuated ERK signaling. Circulating FFA levels were also significantly reduced upon reduction of hepatic ERK activity, suggesting a potential mechanism for improved insulin sensitivity (Figure 7C).
Figure 7. Attenuation of hepatic ERK activation in DIO mice and effect on systemic insulin sensistivity.
A. Knocking down ERK in the livers of DIO mice (n=4–5 each group). B. Effect on insulin and glucose tolerance. C. Effect on liver glycogen and TAG contents as well as on plasma FFA levels. *, P<0.05, shERK1/2 vs shGFP.
4. Discussion
The role of the MEK/ERK signaling pathway in liver energy metabolism had not been previously studied in animal models. Two publications using cultured liver cells showed that the MEK/ERK pathway is not required for mediating the repressive effect of insulin on transcription of the PEPCK promoter (Gabbay et al., 1996; Sutherland et al., 1998). However, activation of the MEK/ERK pathway can suppress transcription of both PEPCK and G6Pase promoters (Schmoll et al., 2001; Sutherland et al., 1998). Our recent publication revealed that expression of the constitutively active MEK1 decreases expression of the endogenous G6Pase gene and attenuates basal glucose output in Fao hepatoma cells (Feng et al., 2012). In the current study, we investigated the role of hepatic ERK activity in energy metabolism in vivo for the first time.
Our results indicate that sustained hepatic ERK activity in the livers of lean mice perturbs glucose homeostasis, decreases energy expenditure and induces systemic insulin resistance. It is interesting to note that liver glycogen content is uncoupled with insulin sensitivity as it is well known that insulin promotes glycogen synthesis and inhibits gluconeogenesis (Edgerton et al., 2009; Hua, 2010; Newsholme and Dimitriadis, 2001). One potential mechanism that contributes to increased glycogen synthesis could be the decrease of G6Pase, the key gluconeogenic enzyme that generates free glucose by dephosphorylating glucose-6-phosphate (G6P). Reduction of G6Pase will lead to accumulation of G6P, which can not freely penetrate the cell membrane to enter the circulation. Accumulated G6P can be subsequently converted to glucose-1-phosphate (G1P), which serves as the building material for glycogen synthesis. It has been reported that G6P stimulates activity of glycogen synthase (Villar-Palasi and Guinovart, 1997). We also revealed that ERK has a novel role in regulating FOXO1 function by decreasing its nuclear translocation. Despite the fact that it is known that ERK can phosphorylate FOXO1 on nine Ser sites which do not overlap with the three Ser/Thr sites for Akt mediated phosphorylation, however, the biological consequences of ERK phosphorylation is unknown. In our study, we demonstrated that FOXO1 nuclear translocation can be impaired by the constitutive activation of MEK1, which can potentially explain decreased G6Pase expression. Further study with ERK phosphorylation resistant FOXO1 mutant provided further evidence to support the hypothesis that MEK CA induced FOXO1 cytosolic retention is mediated by phosphorylation of FOXO1 by ERK. This finding indicates that Akt mediated FOXO1 phosphorylation is not the only mechanism to retain FOXO1 in the cytosol.
Liver plays a major role for maintaining glucose homeostasis by releasing glucose into the circulation through glycogenolysis and gluconeogenesis during fasting. Interestingly, ERK activity is decreased in lean mice upon fasting, which may relieve the restriction on hepatic glucose output. When this mechanism is disrupted by increased ERK activity which leads to abnormal glucose storage in the liver as glycogen, the body will need to shift to an alternative energy source. The increased adipocyte lipolysis, decreased adipose tissue mass 10 days post virus injection, and elevated circulating fatty acid levels indicate that triglyceride storage in adipocytes is mobilized. These data indicate that consumption of FFAs may have taken place when access to glucose is not readily available. A lower respiratory exchange ratio in mice over-expressing MEK CA also supports this hypothesis. As a feed back mechanism, lipid synthesis is reduced as reflected by decreased expression of genes involved in triglyceride synthesis and lowered TAG levels in the liver and circulation. However, decreased expression of genes involved in fatty acid oxidation, reduced consumption of oxygen and release of carbon dioxide as well as lowered body temperature perhaps contribute to overall decreased energy expenditure. The elevated circulating FFA levels could be a major contributor for systemic insulin resistance caused by hepatic ERK activation.
Our study also demonstrated that the ERK activities in the livers of DIO mice are higher than those in lean mice after twenty-four weeks of high fat diet. One previous report showed that the ERK phosphorylation levels were not changed in the livers of DIO mice (Bost et al., 2005b). However, it was unclear at what stage of high fat diet the livers were collected. Loss of function study in DIO mice provided further evidence to demonstrate that hepatic ERK over-activation contributes to systemic insulin resistance. Systemic insulin sensitivity and glucose tolerance were both significantly improved by reducing ERK1/2 levels in the livers of DIO mice. It is noteworthy that ERK over-activation appears in the later stage of obesity development after occurrence of hyperinsulinemia, which occurs around 16 weeks upon a high fat diet feeding (Xu et al., 2003). Our previous work demonstrates that expression of MKP-3, a phosphatase that can attenuate ERK signaling, is also increased in the livers of DIO mice (Wu et al., 2010). Our data suggest that hepatic ERK activity may contribute to deterioration of obesity-related insulin resistance, rather than being a causal factor.
Highlights.
In this study, we examined the role of hepatic ERK in energy homeostasis.
We demonstrated that ERK activity is significantly increased in the livers of ob/ob and diet-induced obese mice.
We used gain-of-function experiments to demonstrate that sustained ERK activation in the livers of lean mice causes decreased energy expenditure, liver glycogen accumulation, fasting hyperglycemia and insulin resistance.
We knocked down the expression of ERK in the livers of diet induced obese mice and showed improved insulin sensitivity.
We also showed that ERK regulates FOXO1 by phosphorylation and cytosol retention.
ACKNOWLEDGEMENTS
This work was supported by NIDDK 5R01 DK080746 and 3R01 DK080746-02S1 awarded to H.Xu. P. Jiao is a recipient of George Bray Fellowship from Brown University. No potential conflict of interest relevant to this article exists.
Footnotes
Publisher's Disclaimer: This is a PDF file of an unedited manuscript that has been accepted for publication. As a service to our customers we are providing this early version of the manuscript. The manuscript will undergo copyediting, typesetting, and review of the resulting proof before it is published in its final citable form. Please note that during the production process errors may be discovered which could affect the content, and all legal disclaimers that apply to the journal pertain.
REFERENCES
- Asada S, Daitoku H, Matsuzaki H, Saito T, Sudo T, Mukai H, Iwashita S, Kako K, Kishi T, Kasuya Y, Fukamizu A. Mitogen-activated protein kinases, Erk and p38, phosphorylate and regulate Foxo1. Cell Signal. 2007;19:519–527. doi: 10.1016/j.cellsig.2006.08.015. [DOI] [PubMed] [Google Scholar]
- Bost F, Aouadi M, Caron L, Binetruy B. The role of MAPKs in adipocyte differentiation and obesity. Biochimie. 2005a;87:51–56. doi: 10.1016/j.biochi.2004.10.018. [DOI] [PubMed] [Google Scholar]
- Bost F, Aouadi M, Caron L, Even P, Belmonte N, Prot M, Dani C, Hofman P, Pages G, Pouyssegur J, et al. The extracellular signal-regulated kinase isoform ERK1 is specifically required for in vitro and in vivo adipogenesis. Diabetes. 2005b;54:402–411. doi: 10.2337/diabetes.54.2.402. [DOI] [PubMed] [Google Scholar]
- Brunet A, Pages G, Pouyssegur J. Constitutively active mutants of MAP kinase kinase (MEK1) induce growth factor-relaxation and oncogenicity when expressed in fibroblasts. Oncogene. 1994;9:3379–3387. [PubMed] [Google Scholar]
- Camp HS, Tafuri SR. Regulation of peroxisome proliferator-activated receptor gamma activity by mitogen-activated protein kinase. J Biol Chem. 1997;272:10811–10816. doi: 10.1074/jbc.272.16.10811. [DOI] [PubMed] [Google Scholar]
- Collins QF, Xiong Y, Lupo EG, Jr, Liu HY, Cao W. p38 Mitogen-activated protein kinase mediates free fatty acid-induced gluconeogenesis in hepatocytes. J Biol Chem. 2006;281:24336–24344. doi: 10.1074/jbc.M602177200. [DOI] [PubMed] [Google Scholar]
- Edgerton DS, Johnson KM, Cherrington AD. Current strategies for the inhibition of hepatic glucose production in type 2 diabetes. Front Biosci. 2009;14:1169–1181. doi: 10.2741/3301. [DOI] [PubMed] [Google Scholar]
- Feng B, Jiao P, Nie Y, Kim T, Jun D, van Rooijen N, Yang Z, Xu H. Clodronate liposomes improve metabolic profile and reduce visceral adipose macrophage content in diet-induced obese mice. PLoS One. 2011;6:e24358. doi: 10.1371/journal.pone.0024358. [DOI] [PMC free article] [PubMed] [Google Scholar]
- Feng B, Jiao P, Yang Z, Xu H. MEK/ERK pathway mediates insulin-promoted degradation of MKP-3 protein in liver cells. Mol Cell Endocrinol. 2012;361:116–123. doi: 10.1016/j.mce.2012.03.025. [DOI] [PMC free article] [PubMed] [Google Scholar]
- Font de Mora J, Porras A, Ahn N, Santos E. Mitogen-activated protein kinase activation is not necessary for, but antagonizes, 3T3-L1 adipocytic differentiation. Mol Cell Biol. 1997;17:6068–6075. doi: 10.1128/mcb.17.10.6068. [DOI] [PMC free article] [PubMed] [Google Scholar]
- Gabbay RA, Sutherland C, Gnudi L, Kahn BB, O’Brien RM, Granner DK, Flier JS. Insulin regulation of phosphoenolpyruvate carboxykinase gene expression does not require activation of the Ras/mitogen-activated protein kinase signaling pathway. J Biol Chem. 1996;271:1890–1897. doi: 10.1074/jbc.271.4.1890. [DOI] [PubMed] [Google Scholar]
- Hirosumi J, Tuncman G, Chang L, Gorgun CZ, Uysal KT, Maeda K, Karin M, Hotamisligil GS. A central role for JNK in obesity and insulin resistance. Nature. 2002;420:333–336. doi: 10.1038/nature01137. [DOI] [PubMed] [Google Scholar]
- Hu E, Kim JB, Sarraf P, Spiegelman BM. Inhibition of adipogenesis through MAP kinase-mediated phosphorylation of PPARgamma. Science. 1996;274:2100–2103. doi: 10.1126/science.274.5295.2100. [DOI] [PubMed] [Google Scholar]
- Hua Q. Insulin: a small protein with a long journey. Protein Cell. 2010;1:537–551. doi: 10.1007/s13238-010-0069-z. [DOI] [PMC free article] [PubMed] [Google Scholar]
- Jager J, Corcelle V, Gremeaux T, Laurent K, Waget A, Pages G, Binetruy B, Le Marchand-Brustel Y, Burcelin R, Bost F, Tanti JF. Deficiency in the extracellular signal-regulated kinase 1 (ERK1) protects leptin-deficient mice from insulin resistance without affecting obesity. Diabetologia. 2011;54:180–189. doi: 10.1007/s00125-010-1944-0. [DOI] [PubMed] [Google Scholar]
- Jiao P, Ma J, Feng B, Zhang H, Alan Diehl J, Eugene Chin Y, Yan W, Xu H. FFA-induced adipocyte inflammation and insulin resistance: involvement of ER stress and IKKbeta pathways. Obesity (Silver Spring) 2011;19:483–491. doi: 10.1038/oby.2010.200. [DOI] [PubMed] [Google Scholar]
- Liu HY, Collins QF, Xiong Y, Moukdar F, Lupo EG, Jr, Liu Z, Cao W. Prolonged treatment of primary hepatocytes with oleate induces insulin resistance through p38 mitogen-activated protein kinase. J Biol Chem. 2007;282:14205–14212. doi: 10.1074/jbc.M609701200. [DOI] [PubMed] [Google Scholar]
- Newsholme EA, Dimitriadis G. Integration of biochemical and physiologic effects of insulin on glucose metabolism. Exp Clin Endocrinol Diabetes. 2001;109(Suppl 2):S122–S134. doi: 10.1055/s-2001-18575. [DOI] [PubMed] [Google Scholar]
- Prusty D, Park BH, Davis KE, Farmer SR. Activation of MEK/ERK signaling promotes adipogenesis by enhancing peroxisome proliferator-activated receptor gamma (PPARgamma) and C/EBPalpha gene expression during the differentiation of 3T3-L1 preadipocytes. J Biol Chem. 2002;277:46226–46232. doi: 10.1074/jbc.M207776200. [DOI] [PubMed] [Google Scholar]
- Rodriguez A, Duran A, Selloum M, Champy MF, Diez-Guerra FJ, Flores JM, Serrano M, Auwerx J, Diaz-Meco MT, Moscat J. Mature-onset obesity and insulin resistance in mice deficient in the signaling adapter p62. Cell Metab. 2006;3:211–222. doi: 10.1016/j.cmet.2006.01.011. [DOI] [PubMed] [Google Scholar]
- Schmoll D, Grempler R, Barthel A, Joost HG, Walther R. Phorbol ester-induced activation of mitogen-activated protein kinase/extracellular-signal-regulated kinase kinase and extracellular-signal-regulated protein kinase decreases glucose-6-phosphatase gene expression. Biochem J. 2001;357:867–873. doi: 10.1042/0264-6021:3570867. [DOI] [PMC free article] [PubMed] [Google Scholar]
- Solinas G, Vilcu C, Neels JG, Bandyopadhyay GK, Luo JL, Naugler W, Grivennikov S, Wynshaw-Boris A, Scadeng M, Olefsky JM, Karin M. JNK1 in hematopoietically derived cells contributes to diet-induced inflammation and insulin resistance without affecting obesity. Cell Metab. 2007;6:386–397. doi: 10.1016/j.cmet.2007.09.011. [DOI] [PubMed] [Google Scholar]
- Sutherland C, Waltner-Law M, Gnudi L, Kahn BB, Granner DK. Activation of the ras mitogen-activated protein kinase-ribosomal protein kinase pathway is not required for the repression of phosphoenolpyruvate carboxykinase gene transcription by insulin. J Biol Chem. 1998;273:3198–3204. doi: 10.1074/jbc.273.6.3198. [DOI] [PubMed] [Google Scholar]
- Vallerie SN, Furuhashi M, Fucho R, Hotamisligil GS. A predominant role for parenchymal c-Jun amino terminal kinase (JNK) in the regulation of systemic insulin sensitivity. PLoS One. 2008;3:e3151. doi: 10.1371/journal.pone.0003151. [DOI] [PMC free article] [PubMed] [Google Scholar]
- Vallerie SN, Hotamisligil GS. The role of JNK proteins in metabolism. Sci Transl Med. 2010;2:60–65. doi: 10.1126/scitranslmed.3001007. [DOI] [PubMed] [Google Scholar]
- Villar-Palasi C, Guinovart JJ. The role of glucose 6-phosphate in the control of glycogen synthase. Faseb J. 1997;11:544–558. [PubMed] [Google Scholar]
- Wu Z, Jiao P, Huang X, Feng B, Feng Y, Yang S, Hwang P, Du J, Nie Y, Xiao G, Xu H. MAPK phosphatase-3 promotes hepatic gluconeogenesis through dephosphorylation of forkhead box O1 in mice. J Clin Invest. 2010;120:3901–3911. doi: 10.1172/JCI43250. [DOI] [PMC free article] [PubMed] [Google Scholar]
- Xu H, Barnes GT, Yang Q, Tan G, Yang D, Chou CJ, Sole J, Nichols A, Ross JS, Tartaglia LA, Chen H. Chronic inflammation in fat plays a crucial role in the development of obesity-related insulin resistance. J Clin Invest. 2003;112:1821–1830. doi: 10.1172/JCI19451. [DOI] [PMC free article] [PubMed] [Google Scholar]
- Xu H, Yang Q, Shen M, Huang X, Dembski M, Gimeno R, Tartaglia LA, Kapeller R, Wu Z. Dual specificity MAPK phosphatase 3 activates PEPCK gene transcription and increases gluconeogenesis in rat hepatoma cells. J Biol Chem. 2005;280:36013–36018. doi: 10.1074/jbc.M508027200. [DOI] [PubMed] [Google Scholar]
- Zhang X, Xu A, Chung SK, Cresser JH, Sweeney G, Wong RL, Lin A, Lam KS. Selective inactivation of c-Jun NH2-terminal kinase in adipose tissue protects against diet-induced obesity and improves insulin sensitivity in both liver and skeletal muscle in mice. Diabetes. 2011;60:486–495. doi: 10.2337/db10-0650. [DOI] [PMC free article] [PubMed] [Google Scholar]
- Zheng Y, Zhang W, Pendleton E, Leng S, Wu J, Chen R, Sun XJ. Improved insulin sensitivity by calorie restriction is associated with reduction of ERK and p70S6K activities in the liver of obese Zucker rats. J Endocrinol. 2009;203:337–347. doi: 10.1677/JOE-09-0181. [DOI] [PMC free article] [PubMed] [Google Scholar]


