Abstract
In this study, we quantified electron transfer rates, depth profiles of electron donor, and biofilm structure of Geobacter sulfurreducens biofilms using an electrochemical-nuclear magnetic resonance microimaging biofilm reactor. Our goal was to determine whether electron donor limitations existed in electron transfer processes of electrode-respiring G. sulfurreducens biofilms. Cells near the top of the biofilms consumed acetate and were metabolically active; however, acetate concentration decreased to below detection within the top 100 microns of the biofilms. Additionally, porosity in the biofilms fell below 10% near the electrode surface, exacerbating exclusion of acetate from the lower regions. The dense biofilm matrix in the acetate-depleted zone acted as an electrical conduit passing electrons generated at the top of the biofilm to the electrode. To verify the distribution of cell metabolic activity, we used uranium as a redox-active probe for localizing electron transfer activity and X-ray absorption spectroscopy to determine the uranium oxidation state. Cells near the top reduced UVI more actively than the cells near the base. High-resolution transmission electron microscopy images showed intact, healthy cells near the top and plasmolyzed cells near the base. Contrary to models proposed in the literature, which hypothesize that cells nearest the electrode surface are the most metabolically active because of a lower electron transfer resistance, our results suggest that electrical resistance through the biofilm does not restrict long-range electron transfer. Cells far from the electrode can respire across metabolically inactive cells, taking advantage of their extracellular infrastructure produced during the initial biofilm formation.
Keywords: biofilm, electrochemically active, Geobacter, electron transfer, magnetic resonance, NMR, extracellular, uranium
INTRODUCTION
Long-range extracellular electron transfer is a well-known phenomenon occurring in electrode-respiring Geobacter sulfurreducens biofilms1-4. Much of the recent work has focused on elucidating the nature of electron transfer, which has included superexchange (electron-hopping across redox sites) in the biofilm matrix and metallic-like conduction5-9. Malvankar et al. (2012) found that G. sulfurreducens can form a conductive matrix across a 100-μm gap between polarized electrodes and that conductivity increases with biofilm age and thickness5. Malvankar et al. (2011) also showed that conductivity is maintained even under metabolic inactivity when no electron donor is supplied9. Furthermore, this study reported significant conductance (5 mS/cm) through a G. sulfurreducens biofilm at distances greater than 1 cm. The conduction of electrons across G. sulfurreducens biofilms had been previously modeled to show several key factors could be restricting the electron transfer rates through the biofilm. First, electron transfer resistance increases with biofilm thickness, producing electron acceptor limiting conditions10-12. Second, the accumulation of protons inside the biofilm decreases the pH and subsequently inhibits biofilm metabolic activity13-17. Third, the distribution of redox mediators is not optimal for electron transfer18, 19. Another possibility is that the electron donor cannot penetrate the biofilm completely, producing electron donor limiting conditions. However, this view has been contradicted by the facts that G. sulfurreducens biofilms form relatively thin biofilms and acetate is generally believed to be in excess1, 16, 20. Although there is direct evidence for the first three key factors, no direct evidence has been provided for the existence of electron donor limiting conditions in G. sulfurreducens biofilms with excess acetate in the bulk solution. Such results could be an alternative explanation as to why thicker, more mature G. sulfurreducens biofilms become less effective at producing current16.
Microscale investigations inside electrode-respiring biofilms are critical for elucidating the factors affecting electron transfer rates. Several studies have directly observed the localization of cytochrome redox mediators in G. sulfurreducens biofilms18, 19, the oxidation and reduction of cytochrome redox mediators10, 21, the localization of gene expression in G. sulfurreducens biofilms22, 23, the distribution of pH13, 14, and the distribution of redox potential13. All of these investigations focused on determining either the metabolic state of cells in the biofilm or the microenvironment to which these cells were exposed. Both are critical observations that tell us whether cells inside the biofilm are contributing to the current densities observed. However, simultaneous observation of the electron donor profile, biofilm structure, and respiration rates (measured as current) are needed to explain how the electron donor and biofilm structure contribute to the respiration rates. To date, these data have not been available because the technology was not available. Recently we developed an electrochemical nuclear magnetic resonance (EC-NMR) microimaging biofilm reactor to quantify effective diffusion coefficients in electrode-respiring biofilms24. For the research presented here, we used this technology to quantify electron donor limitation, biofilm respiration, and biofilm structure simultaneously. The goal of our research was to quantify electron donor profiles and biofilm structure in electrode-respiring biofilms. Electron donor profiles can be used to determine turnover and non-turnover conditions in biofilms and can be used to determine limitations in electron transfer. Because G. sulfurreducens biofilms produce high electron transfer rates, understanding the microenvironments inside the biofilms and unlocking their maximum potential could lead to more viable microbial technologies25-29.
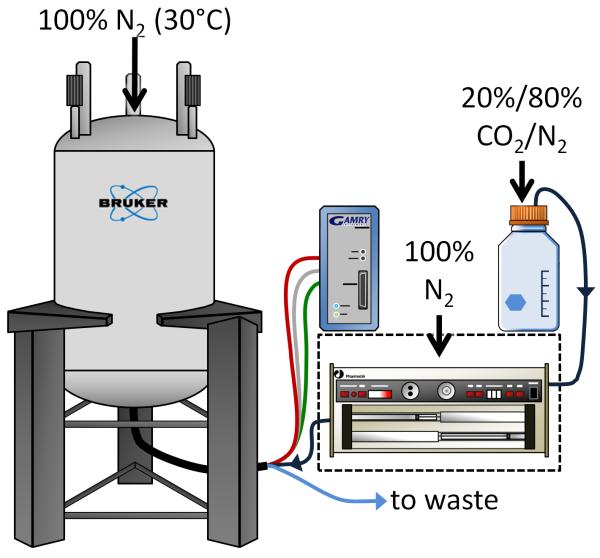
In this study, we investigated electrode-respiring G. sulfurreducens strain PCA (ATCC 51573) biofilms. The biofilms were grown anaerobically with acetate as the electron donor in an EC-NMR microimaging biofilm reactor, which functioned as a three-electrode bioreactor (Figure 1). The use of NMR techniques allowed us to quantify spatially resolved in situ and noninvasive electron donor concentrations reproducibly30. To the best of our knowledge, this is the first time that electron donor depth profiles have been obtained for electrode-respiring biofilms. In addition to electron donor depth profiles, we quantified biofilm porosity and developed a model to understand the flux of the electron donor into electrode-respiring biofilms. Finally, at the end of the experiment, we supplied a soluble electron acceptor, UVI, to the biofilm as a redox-active probe for localizing electron transfer activity. We used U LIII-edge micro-XANES to determine the distribution of the reduction end product, UIV, near the top and near the base of the biofilm. Overall, by combining the electron donor profiles, effective diffusion coefficient profiles, biofilm structure, and oxidation state of uranium, we determined whether electron donor limitations existed in electron transfer processes of G. sulfurreducens biofilms.
Figure 1. Electrochemical nuclear magnetic resonance (EC-NMR) microimaging biofilm reactor.
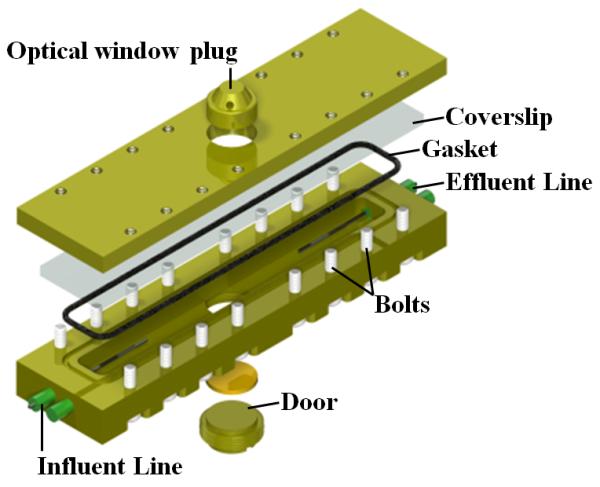
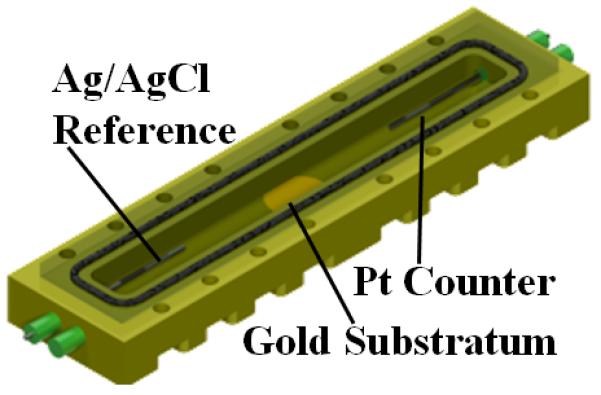
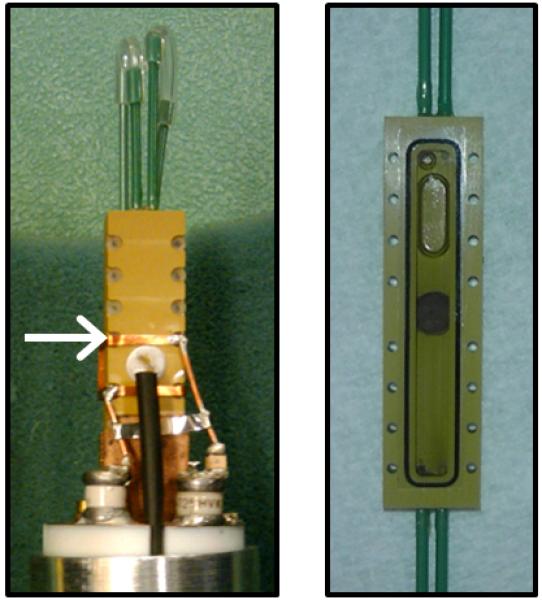
a, NMR setup illustration. The potentiostat and syringe pump were located on a rack outside the 20-gauss magnetic field line of the NMR magnet. Potentiostat wiring and flow perfusion lines entered the magnet bore from below. The growth medium, syringe pump, flow breaker (not shown), and EC-NMR biofilm reactor were kept anaerobic with continually flowing anaerobic gas (20%/80% CO2/N2 for the growth medium). For temperature control, the gas entering the NMR bore was kept at 30 °C. b, The EC-NMR biofilm reactor. The Ag/AgCl reference electrode was located in the inlet perfusion line, entering ~5 mm into the chamber. The working electrode was a 5-mm gold electrode acting as the biofilm substratum, and the counter electrode was a braid of Pt wire inserted into the outlet perfusion line. c, The seated gold electrode completed the bottom flow channel wall, and the top wall was composed of a glass coverslip sealed with a gasket. The electrodes comprising the three-electrode electrochemical cell are labeled. d, Left, the EC-NMR biofilm reactor was seated into a custom-built NMR probe which accommodated an Alderman-Grant-type resonator (arrow), which generated a radio frequency field aligned parallel with the gold electrode. Right, the opened EC-NMR biofilm reactor displaying a Geobacter sulfurreducens biofilm tightly associated with the gold electrode, which functioned as the sole terminal electron acceptor for the system. The biofilm shown is a dark grey, as opposed to the typical vibrant pinkish orange, because of UIV precipitates in the biofilm matrix.
RESULTS AND DISCUSSION
Biofilm growth
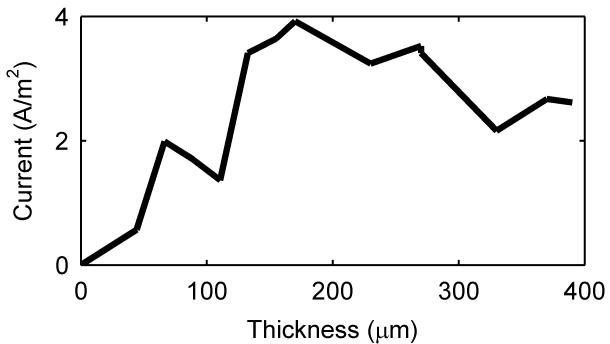
After the biofilm reactor was inoculated, both biofilm thickness and current production were monitored. The MRI images in Figure 2a show that the thickness of the biofilm reached 390 μm, thicker than what has been previously reported13. Figure 2b shows an axial-plane (normal to flow) view 2D MRI time series progression of biofilm growth, from a clean reactor to ~400 μm thick. Figure 2c shows an example normal-plane view 2D MRI, used to calculate biofilm thickness. Figure 2d shows a face-plane view 2D MRI of fully grown G. sulfurreducens biofilm. Inspection of the biofilm using the built-in optical window (Figure 1d) revealed a vibrant pinkish orange color typical of healthy G. sulfurreducens biofilms31. Current production was linearly correlated (Pearson correlation coefficient of 0.94) with biofilm thickness up to 170 μm, with a maximum current of 3.92 A/m2 (Figure 2a). However, as the biofilm thickness increased, the current gradually decreased to 2.61 A/m2 at the thickness of 390 μm. The reason behind this decrease in current production per thickness of the biofilm is not immediately obvious, as the increase in biofilm thickness suggests that the biofilm was able to sustain its metabolism and increase its biomass. Therefore, it is unlikely that the biofilm suffered from electron acceptor limiting conditions. Otherwise, as pointed out in numerous studies10-12, the biofilm would not be able to reach thicknesses that would place the majority of its cells at significant distances from the electrode surface. At the same time, pH inhibition was not considered an issue because the pH at the base of another G. sulfurreducens biofilm producing 3.3 A/m2 was only 6.313. Note that current production did not change whether the biofilms were inside or out of the NMR magnet.
Figure 2. Biofilm growth and electrical current production over time.
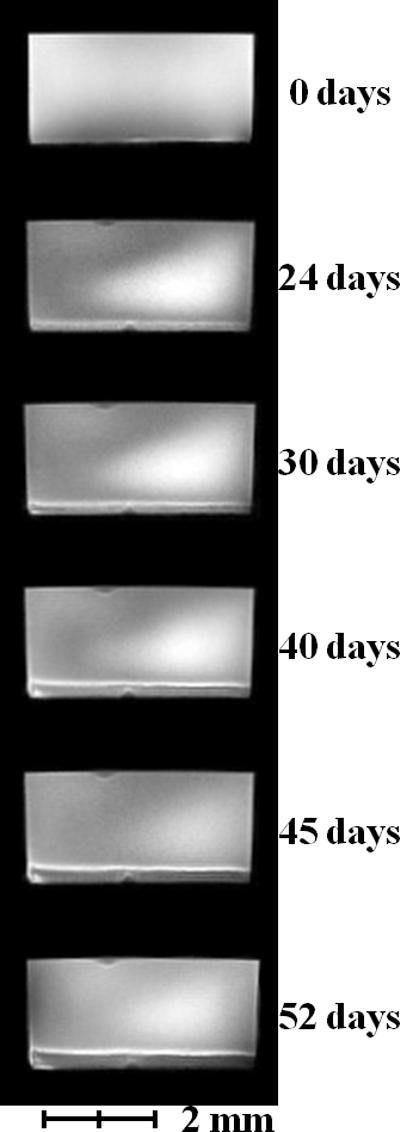
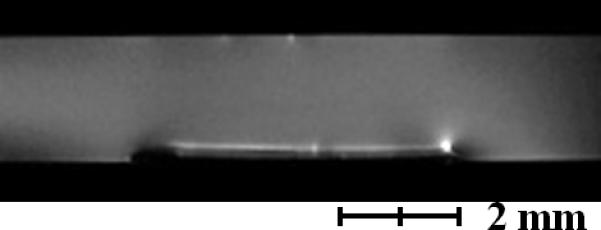
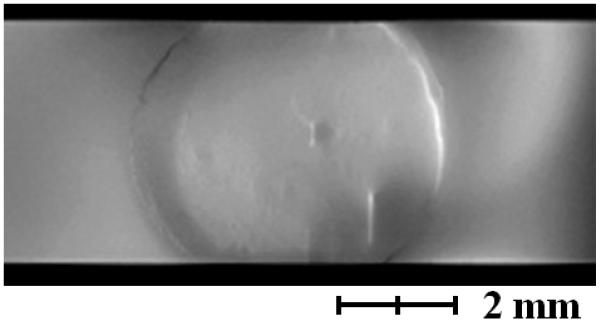
a, Current per unit area versus biofilm thickness. b, Axial-plane (normal to flow) view 2D MRI time series showing progression of biofilm growth, from a clean reactor to ~400 μm thick. c, Example normal-plane view 2D MRI, used to calculate biofilm thickness. d, Face-plane view 2D MRI of fully grown G. sulfurreducens biofilm.
Microenvironment investigations
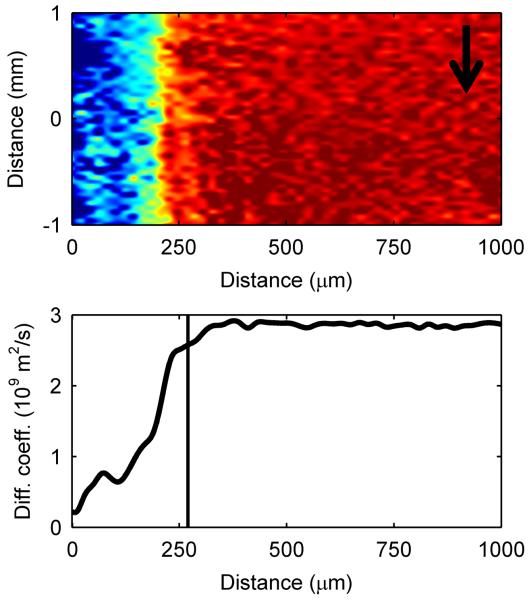
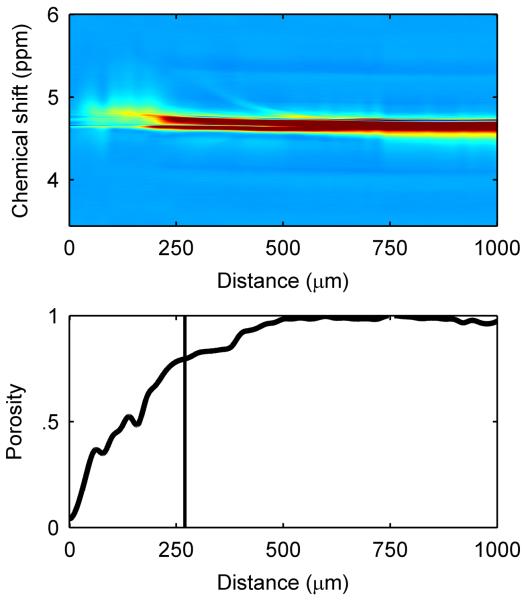
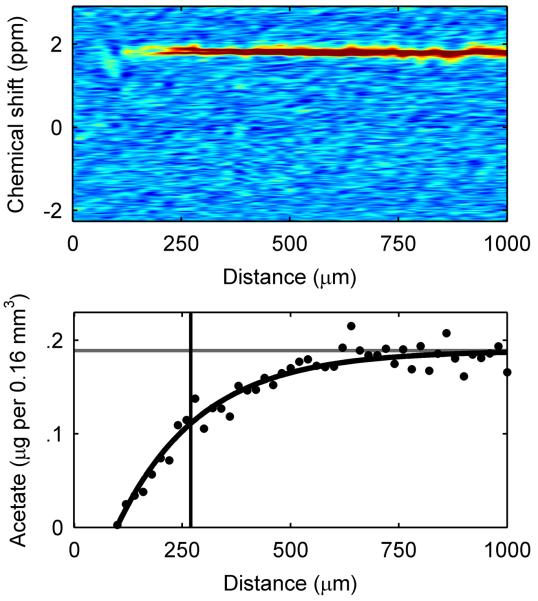
To investigate the microenvironment inside the biofilm further, we quantified acetate concentration, biofilm porosity, and diffusion coefficients inside the biofilm when it was 270 μm in thickness, during the gradual decrease in current production. First, diffusion-mapping magnetic resonance imaging was used to generate maps of effective diffusion coefficients32. The diffusion coefficient profiles in Figure 3a exhibit a smooth decrease from the top of the biofilm, and the base of the biofilm had very low diffusion coefficient values. This is consistent with our previous findings24, and the dense base of the G. sulfurreducens biofilm is consistent with observations in other studies10, 22, 33. Second, water content profiles were used to generate porosity (volume fraction of water) profiles in biofilms. The porosity profile in Figure 3b shows a decreasing porosity, or a denser region, towards the base. The porosity in the biofilms decreased to below 10% near the electrode surface, to a minimum value of 0.04. The average porosity of the entire biofilm was 0.47. The dense biofilm matrix near the base is consistent with the decreasing diffusion coefficient profiles in Figure 3a. Combined, the reduced biofilm porosity and reduced diffusion coefficients were so far removed from the normal condition in bulk water that mass transport was likely the cause of the current decrease. This is commonly the case for aerobic biofilms, where the mass transport of oxygen in the system limits growth. For this study, the electron acceptor was a solid electrode with an infinite electron-accepting capacity; therefore the mass transport-limited nutrient was likely the electron donor, acetate.
Figure 3. Spectroscopic and diffusion mapping of a 270-μm-thick G. sulfurreducens biofilm.
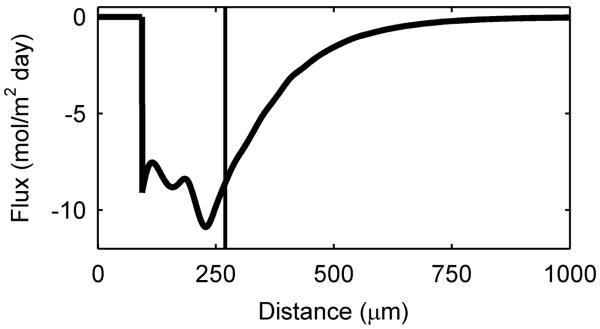
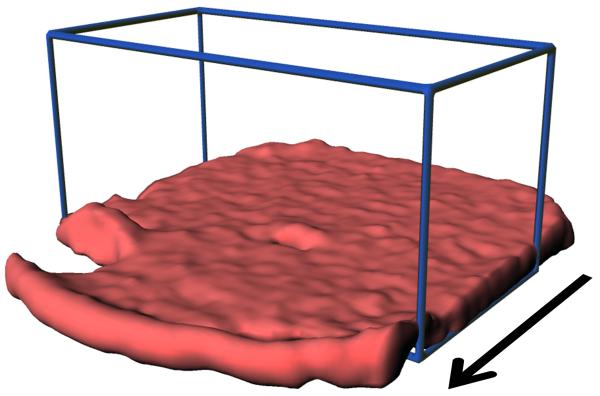
a, Two-dimensional spatial heat map and depth profile of effective diffusion coefficients. Distance is from the base of the biofilm. The arrow indicates the direction of fluid flow. Warmer (red) colors in the heat map signify a higher intensity, or value, in each map and are quantified in the respective depth profile. The top of the biofilm is indicated by the vertical line at 270 μm. b, Two-dimensional spectral-spatial heat map of water and depth profile of biofilm porosity. The heat map shows the signal intensity vs. depth for water, which has a chemical shift of ~4.7 ppm. c, Two-dimensional spectral-spatial heat map and depth profile of acetate concentration in the biofilm pore volume. The heat map shows the signal intensity vs. depth for acetate, which has a chemical shift of ~1.9 ppm. The grey line indicates the acetate concentration provided in the growth medium. d, Calculated depth profile of acetate molar flux. e, Volume-filled three-dimensional magnetic resonance images of the G. sulfurreducens biofilm grown on a polarized electrode, with the blue lines outlining the NMR measurement voxel for the acetate depth measurement. Several pockets where CO2 bubbles formed can be observed. The arrow indicates the direction of fluid flow.
Figure 3c reveals that acetate was undetectable below a depth of ~170 μm inside the biofilm. Only 63% of the biofilm thickness had access to the electron donor to support current production and biomass production. The bottom 37% of the biofilm had no detectable acetate, which suggests that little to no acetate was available in this region and that the cells located here were consequently less metabolically active or even inactive. We repeated these measurements at different times on biofilms with different thicknesses and observed the same trend, with the concentration of acetate falling below detection with increasing distance from the electrode surface as the biofilm thickness increased. To better understand the metabolic activity of cells inside the biofilm, we calculated acetate flux. The acetate flux, as shown in Figure 3d, reached a peak value of −11 mol m−2 day−1 just below the top of the biofilm, revealing the high metabolic activity of the cells located there. Note that Figure 3e shows the location of the voxel used to measure the diffusion coefficient and acetate profiles, that were used for the flux calculation. At deeper regions in the biofilm, acetate flux gradually decreased until it was not possible to calculate since acetate was undetectable. At this depth, the flux of acetate was likely insufficient to sustain the metabolic activity of cells at the base. This poses an interesting scenario, since acetate can only be oxidized if the resulting electrons are transferred to the electrode. This suggests that electrons were actively being transported across the electron donor limited cells.
Localization of electron transfer activity
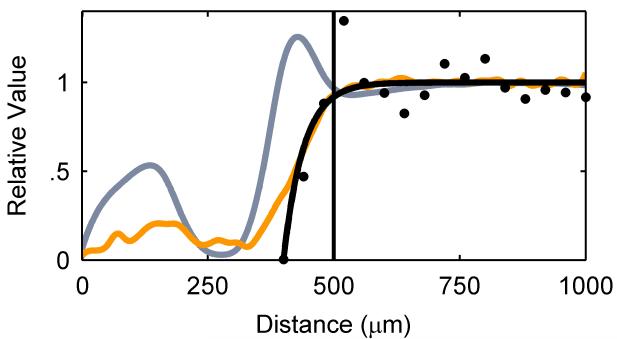
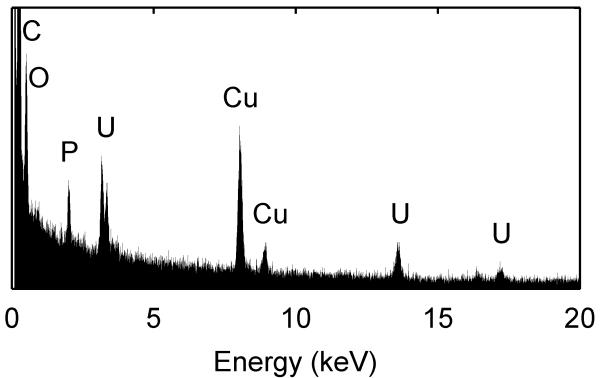
We used soluble UVI as a metabolic indicator to evaluate independently whether the cells in the electron donor limited regions of the biofilm were metabolically inactive. Previously, it was shown that G. sulfurreducens could reduce UVI to UIV34-36. Only metabolically active cells can reduce UVI to UIV, which can then be used to localize electron transfer and therefore metabolic activity. After 54 days of growth, soluble UVI was added to the growth medium and introduced into the biofilm reactor as a redox-active probe for localizing electron transfer activity. Relaxation-contrast MRI and electron microscopy revealed an elevated U concentration in the top portion of the biofilm. U was observed as a black zone (~200 μm thick) in the biofilm after UVI addition, as shown in Figure 4a and 4b. Even after three days of continuous U feeding, there was no change in the thickness of the zone containing U. The lower U concentration at depth in the biofilm is consistent with Figure 4c, which shows that the cells in that region formed a dense layer and were acetate-limited. U LIII-edge micro-XANES measurements with a 10 μm × 30 μm X-ray beam revealed UIV near the top of the biofilm (see ESI Figure S2). These results are consistent with rapid UVI reduction in the top of the biofilm coupled with mass transfer limitations preventing U from reaching the base. Fine-grain U-rich solids, observed specifically localized at the cell outer membrane in Figure 4d, present a characteristic association of newly formed biogenic minerals with the bacterial cell wall37, 38. An SEM image of the biofilm cross section (Figure 4e) shows the U-rich zone above the white dashed line. The biofilm solids did not produce defined electron diffraction patterns like those observed for uraninite or autunite (Figure 4f). Collectively, the lack of both acetate and U at the base of the biofilm confirms that cells in this region were metabolically inactive. The existence of this metabolically inactive region in the biofilm could explain why current did not continue increasing with biofilm thickness. Only cells with access to acetate could contribute to current production.
Figure 4. Uranium immobilization restricted to the top of the biofilm.
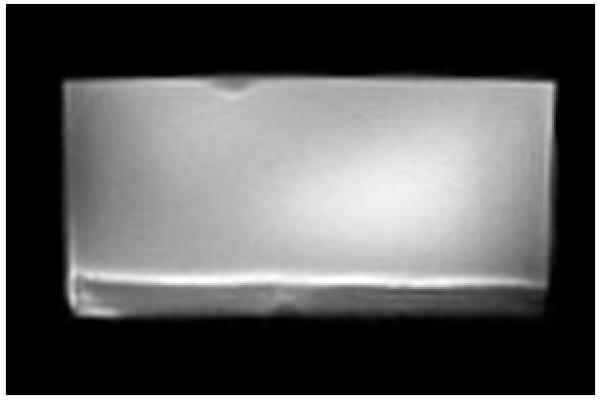
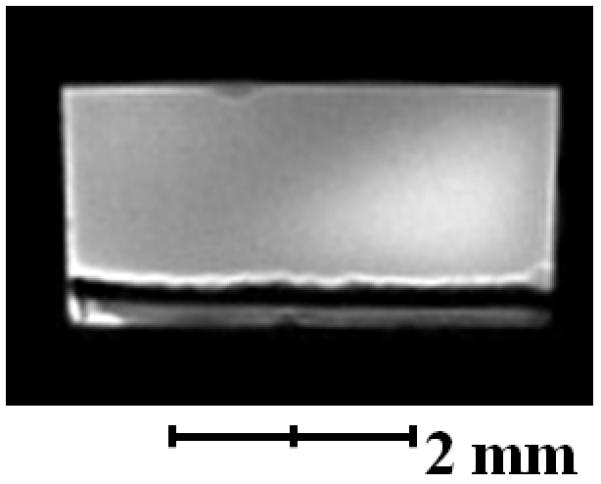
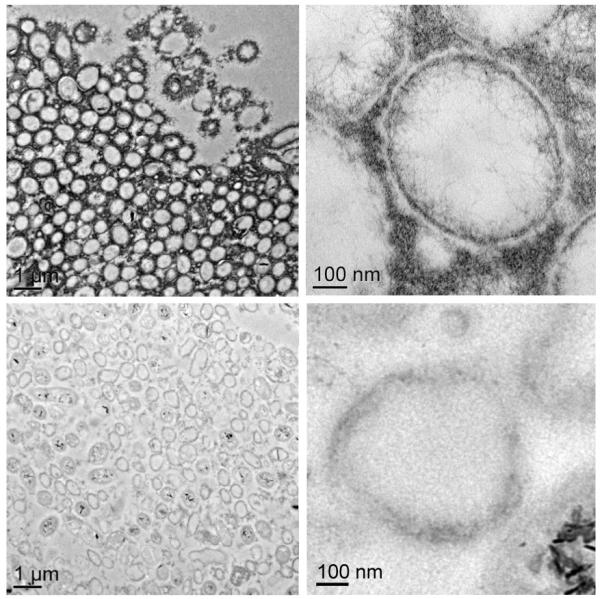
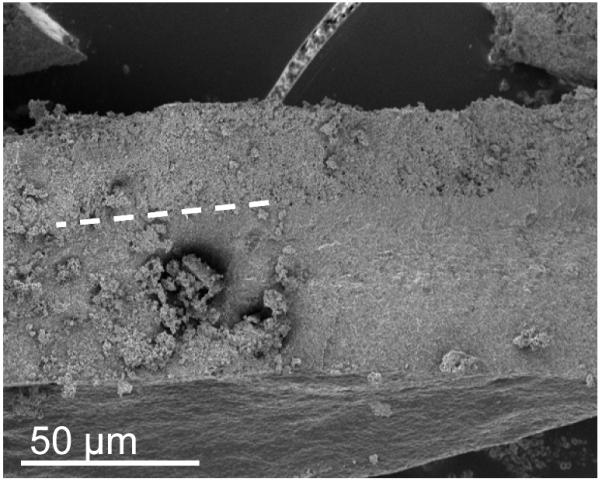
a, Axial view 2D MRI taken before UVI addition b, Axial view 2D MRI after two days of UVI addition. c, Overlay of relative diffusion coefficient profile (yellow), 2D MRI signal intensity (grey), and relative acetate concentration (black), after the addition of UVI. d, TEM image of a cross section of the biofilm. Top images: top of the biofilm after UVI addition, corresponding to the dark band seen in the 2D MRI. Biogenic reduced UVI can be seen precipitated onto strand-like formations encasing the cells. Bottom images: cells near the base of the biofilm. No UVI precipitates can be observed. However, cells appeared damaged and plasmolyzed, corroborating evidence that the base of the biofilm was electron donor and nutrient limited. e, SEM image of a biofilm cross section. The smooth bottom surface is shown, having been detached from the gold electrode. The white dashed line emphasizes the partition of the UVI-encrusted (top) and UVI-absent regions of the biofilm. f, EDS spectrum of the upper portion of the biofilm, revealing cells encrusted in material containing U and P. The background Cu peak is caused by the electrons scattered from the Cu TEM grid.
Implications
The conductivity of G. sulfurreducens biofilms has been studied in detail5, 9, 22, 23, 39. It has been hypothesized in the literature that cells more than tens of microns from the electron-accepting surface cannot respire because of electrical resistance in the matrix and thus remain metabolically inactive10-12. The link between resistivity and potential drop across G. sulfurreducens biofilms growing on the surface of an electron acceptor has led to a conceptual model in which the thickness of an electrochemically active biofilm is controlled by the electron acceptor. This conceptual model implies that the outer biofilm layers must be metabolically inactive because of active cell growth near the electrode, where the potential drop is insignificant. The cells near the top of the biofilm are thus thrust into a zone where the potential is too negative to support electron transfer. Several studies suggest that biofilms even thinner than 100 μm will not support electron transfer via conduction from regions distal to a solid electron acceptor10, 12. However, consistent with previous work showing G. sulfurreducens biofilms conducting electrons over large distances5, 9, our results demonstrate that cells in the top portion of a biofilm can conduct electrons across a 100- to 400-μm-thick metabolically inactive region, depending on the thickness of the biofilm. Therefore, G. sulfurreducens biofilms can utilize their conductive nature to transfer electrons not only across nonconductive gaps between electrode surfaces, but also through metabolically inactive regions in the biofilm.
For practical applications of electrochemically active biofilms, the possibility of metabolically inactive regions existing in a biofilm even under “excess” electron donor conditions presents a challenge for enhancing current production. Metabolically inactive regions inside a biofilm increase the distance between the active cells and the electrode, effectively increasing the resistance to electron transfer. Thus, the effectiveness of a G. sulfurreducens biofilm for current production depends not only on the conductivity, but also on the prevalence of inactive regions in the biofilm. Evidence in the literature demonstrates that G. sulfurreducens can accept electrons directly from polarized electrodes, in which case the electrode acts as the sole electron donor40-42. As suggested by Nealson and Finkel43, extracellular electron transfer in a conductive biofilm opens up the possibility of a biofilm composed of cells near the top that specialize in electron uptake and cells at the bottom that specialize in enabling electron donation. Thus, it will need to be determined whether the cells near the top are merely exploiting the conductive foundation of the biofilm, or whether any cells near the base of the biofilm are capable of conserving energy from electrons generated by cells near the top. The observation of plasmolyzed cells and the lack of UVI reduction near the biofilm base in this study suggest that perhaps they cannot. We should note that in this study we use the word “inactive” to describe the cells that do not have access to the electron donor. Our results reveal an unprecedented facet of extracellular electron transfer, demonstrating that inordinately long-distance electron transfer can sustain metabolically active cells at the top of a several-hundred-micron-thick biofilm that has an inactive base.
To emphasize this point, we introduce a several-hundred-micron thick G. sulfurreducens biofilm conceptual model in which the matrix can be divided into two sections: 1) a metabolically active top region which has access to an electron donor and 2) a base that does not have access to an electron donor but continues to function as a conductive matrix. The dense base of the biofilm acts as an extension of the cells’ extracellular electron transport system, facilitating the transfer of electrons from acetate oxidation at the top of the biofilm to the polarized electrode surface. The metabolic activity near the top, coupled with the mass transfer restriction at the base, prevent the electron donor from reaching the metabolically inactive region of the biofilm. ESI Figure S3 shows the acetate depth profiles inside our conceptual biofilm. The model and experimental data suggest that the metabolic activity of G. sulfurreducens cells and the conductivity of the biofilm itself allow for metabolically inactive regions to exist in relatively thin, but mature, biofilms. It is reasonable to predict that the initial availability of both the electron donor and the electron acceptor to an immature biofilm results in a prolific production of biomass that ultimately causes the base of the biofilm to become limited by the electron donor and perhaps other nutrients. In this manner, the organisms that initially colonize and form the biofilm provide the “infrastructure” for progeny growing away from the surface.
CONCLUSIONS
We showed that metabolically inactive regions exist near the base of mature electrode-respiring G. sulfurreducens biofilms. These metabolically inactive regions existed where acetate concentration was below detection. Although there was an electron donor limitation within these biofilms, the biofilm conductivity was sufficient for cells to transfer electrons across these metabolically inactive regions. Subsequently, we could grow biofilms up to several hundred microns thick which respired on an electrode. Upon UVI exposure, X-ray absorption spectroscopy and electron microscopy results confirmed that extracellular electron transfer was not prevented by electrical resistance, even when the biofilm was hundreds of microns thick. However, the electron donor may be a contributing factor to lower current production in mature G. sulfurreducens biofilms. Metabolically inactive regions inside electrode-respiring biofilms may increase electron transfer resistance and result in less effective biofilms.
MATERIALS AND METHODS
EC-NMR microimaging biofilm reactor
All NMR measurements were performed using a custom-made EC-NMR biofilm reactor (Figure 1a); this was modified from the reactor used in our previous studies32, 44. The reactor (Figure 1b) was machined from Torlon® polyamide-imide plastic, and its internal dimensions were 4 mm wide, 2 mm deep, and 40 mm long (total volume of 320 μL). Polyetheretherketone (PEEK) plastic tubing (1/16″ outer diameter, .030″ inner diameter) was used as the inlet and effluent lines for the growth medium. Flow through the PEEK lines was set using a pulseless dual-syringe pump (Pharmacia P-500, Uppsala, Sweden) controlled remotely using a home-built, internet-accessible RS-232 pump controller based on a Lantronix XPort AR™ network processing module (Lantronix Inc., Irvine, California, USA). Two additional PEEK tubing lines, connected adjacent to the inlet and effluent lines, were aseptically attached with 0.22-μm filters to a 4-channel IPC Ismatec® pump (IDEX Health & Science, Wertheim-Mondfeld, Germany) situated inside a plastic gas bag continuously purged with 100% N2. This pump was activated to remove intractable bubbles from the reactor prior to inoculation. After inoculation, these lines were sealed and remained unused during the remainder of the experiment. A 250-μm-diameter Ag/AgCl wire was placed inside the influent line using an epoxy-sealed T-junction; this protruded slightly into the reactor (Figure 1c). Similarly, a braided Pt counter electrode, made from 100-μm-diameter >99.99% Pt wire, was placed inside the effluent line. A 5-mm-diameter, 100-μm-thick 99.99% gold disc (Gold foil SKU 265810, Sigma-Aldrich Corporation, St. Louis, Missouri, USA) was affixed with Ag epoxy (TIGA 901 Room Temperature Curing Silver Conductive Epoxy, Resin Technology Group LLC, South Easton, Massachusetts, USA) to the reactor door and aligned with the flow stream. A 250-μm-diameter 99.99% Cu wire (California Fine Wire Co., Grover Beach, California, USA) was coiled in the epoxy between the gold and the door and provided a link for the gold electrode with the working electrode potentiostat connection. Gold has previously been shown to be a successful electrode material for G. sulfurreducens growth45. The electrodes were connected to a Gamry® Reference 600™ potentiostat (Gamry Instruments, Warminster, PA, USA) located outside the 5-gauss magnetic field line of the NMR magnet. The working electrode was polarized to +300 mVAg/AgCl and served as the sole electron acceptor. The EC-NMR biofilm reactor was seated into a custom-built NMR probe, which accommodates an Alderman-Grant-type resonator (arrow), which generates a radio frequency field aligned parallel with the gold electrode (Figure 1d).
Inoculation and growth of the biofilms
To sterilize the system, 30% H2O2 was pumped at 1 mL/hr for 24 hours, followed by a 12-hour rinse at 1 mL/hr with autoclaved Nanopure water. For 24 hours prior to inoculation, the growth medium (sparged with 20%/80% CO2/N2) was pumped into the biofilm reactor at 1 mL/hr, the gold electrode was polarized at +300 mVAg/AgCl, and the NMR bore, syringe pump, and flow breakers were placed under a 100% N2 atmosphere. Inoculum vials of Geobacter sulfurreducens strain PCA (ATCC 51573) were prepared anaerobically using the Hungate technique46 in serum vials without shaking, similar to Babauta et al. (2012)13. The growth medium in the vials consisted of potassium chloride, 0.38 g/L; ammonium chloride, 0.2 g/L; sodium phosphate monobasic, 0.069 g/L; calcium chloride, 0.04 g/L; magnesium sulfate heptahydrate, 0.2 g/L; sodium carbonate, 2 g/L; Wolfe’s vitamin solution, 10 mL/L; and modified Wolfe’s mineral solution, 10 mL/L. Acetate (20 mM) was provided as the electron donor, and 40 mM fumarate (inoculum only) was the electron acceptor. The headspace in the inoculum vial was 20%/80% CO2/N2. The medium used for growth in the biofilm reactor was identical, except that no fumarate or other electron acceptors were provided. The polarized gold electrode acted as the sole electron acceptor for the system.
During inoculation, the growth medium flow was stopped. Inoculum was taken anaerobically from the inoculum vials using a N2-filled gas sampling bag to provide a counter pressure as the inoculum was taken into a 20-mL syringe. The syringe was placed in the N2-purged gas bag encasing the syringe pump and the inoculum was pumped into the reactor at 5 mL/hr for 1 hr, and then at 0.7 mL/hr for another 10 hours. To encourage cell attachment to the polarized gold electrode, the inoculum pumping was halted and the reactor was placed horizontally (with the gold electrode normal aligned against gravity) with no flow for 24 hours. An NMR probe cover (constructed from 1.5” polyvinyl chloride pipe and cap and perfused with 30 °C 100% N2) was used to maintain anaerobicity and temperature while the probe was outside the magnet. After the 24 hours, the reactor was positioned vertically and the flow of growth medium (with no fumarate) was gradually increased to 1 mL/hr, producing a laminar flow profile (Reynolds number of 0.1, dilution rate of 3.13 h−1). All heated N2 gas was temperature-controlled using a gas stream delivery unit (FTS Systems, Stone Ridge, NY). This kept the gas temperature at 30 ± 0.1 °C and the NMR bore and clamp stand probe holder at 30 ± 0.6 °C. The sample was maintained on the clamp stand probe holder outside and adjacent to the NMR magnet during growth and inserted into the NMR system for a few days at regular intervals for NMR measurements. The potentiostat was connected and active during the entire duration of the study. Beginning at day 54, growth medium supplemented with 126 μM UVI was pumped at 1 mL/hr. This was continued for four days, after which the medium was switched back to standard no-U growth medium.
Nuclear Magnetic Resonance Methods
NMR experiments were performed at 500 MHz for protons (1H) using a Bruker Avance III imaging spectrometer (Bruker Instruments, Billerica, MA, USA) with an 11.7-T, 89-mm vertical bore, actively shielded superconducting magnet. The biofilm reactor was mounted on a custom probe with an Alderman-Grant-type radio frequency resonator with its linearly oscillating field direction aligned perpendicular to (and thus not shielded by) the gold electrode surface. ParaVision v5.1 imaging software (Bruker Biospin, Billerica, MA) was used to collect and process the data. Measurements included: 1) rapid multidirectional magnetic resonance imaging (MRI) to verify correct sample positioning and the absence of gas bubbles; 2) 2D Fourier transform (2DFT) MRI; 3) 3D Fourier transform (3DFT) MRI; 4) diffusion-mapping 2D Fourier transform MRI; 5) T1-mapping 2D Fourier transform MRI; and 6) depth-resolved magnetic resonance spectroscopic imaging (MRSI). The NMR methods outlined here are similar to those described in our previous studies24, 32, 44; however, parameter values and details were changed to match the experimental conditions used in this study. Complete descriptions of the NMR methods are given in the Supplementary NMR Methods section in the Electronic Supplementary Information (ESI). An example water-suppressed spectrum is given in ESI Figure S1. Data analysis was performed by importing all phased and baseline-corrected spectral data and all raw MRI data into MATLAB (64-bit Matlab v7.13.0.564, The MathWorks, Inc., Natick, MA, USA). The data were processed and plotted using custom-written Matlab scripts.
Computational Modeling
We developed a two-dimensional mathematical model in order to provide a theoretical framework for hypothesis testing. Two separate cases were simulated, one assuming that only the top of a biofilm is metabolically active and one assuming that only the base is metabolically active. A complete description of the model is given in the ESI.
Scanning and Transmission Electron Microscopy
To fix the G. sulfurreducens biofilm, growth medium (no fumarate) with 2.5% glutaraldehyde (vol/vol) was pumped into the biofilm reactor at 1 mL/hr for five hours at 30 °C. One half of the biofilm was air-dried and examined using a Helios scanning electron microscope (FEI Company, Hillsboro, OR, USA). The other half of the biofilm was washed in dH2O, gradually dehydrated in an ethanol series, and infiltrated in LR White resin (Electron Microscopy Sciences, Hatfield, PA). The polymerized blocks were sectioned with a diamond knife (Diatome, Biehl, Switzerland) to a thickness of 70 nm and mounted on a Cu grid coated with formvar sputtered with carbon. These sections were examined using a Tecnai T-12 transmission electron microscope (TEM) (FEI Company, Hillsboro, OR, USA), at an operating voltage of 120 kV. The images were collected digitally using a 2×2K Ultrascan CCD (Gatan, Inc., Pleasanton, CA). The chemical analysis was performed using energy dispersive spectroscopy (EDAX, Mahwah, NJ, USA) coupled to a Titan TEM (FEI Company, Hillsboro, OR, USA), operating at 300 kV.
X-ray absorption spectroscopy
X-ray fluorescence mapping (XRF) and X-ray absorption near-edge spectroscopy (XANES) measurements were carried out in the MRCAT/EnviroCAT sector, 10-ID insertion device beamline47 of the Advanced Photon Source (APS) at Argonne National Laboratory, Argonne, Illinois. The incident beam was collimated using a curved Rh-coated mirror to a vertical size of approximately 10 microns (as determined by knife-edge scans), and the horizontal beam footprint was defined to approximately 30 microns using slits. The incident energy of the X rays was selected using a Si(111) double-crystal monochromator, and the fluorescence from the samples was measured using a four-element energy-dispersive Si detector (Vortex). Samples were prepared as 1-micron-thick sections of the biofilm fixed in polymer. The sections were mounted on carbon film TEM holders for the XRF analysis. Sample handling and X-ray measurements were done under anoxic conditions. Energy calibration between samples and standards spectra was ensured by simultaneous scans of a hydrogen uranyl phosphate standard using X rays transmitted through the samples. Normalization and linear combination fits were done with the program ATHENA48.
Supplementary Material
Broader Context
Although a significant amount of research has been performed to understand electron transfer mechanisms in biofilms respiring on electrodes, we do not currently know how electron donor concentration and biofilm structure relate to respiration rates. Such knowledge is critical for understanding how metabolic activity and biofilm structure control electron transfer rates. With our discovery of a metabolically active top region of Geobacter sulfurreducens biofilms that are several hundred microns thick, more efficient bioelectrochemical systems can be engineered. Mathematical models can reveal the optimum conditions for maximum electron transfer. Finally, these results should be considered when biogeochemical processes in nature are investigated, as cells growing under starvation or electron donor limited conditions do not necessarily prevent extracellular electron transfer.
ACKNOWLEDGEMENTS
This research was financially supported by the United States Office of Naval Research (ONR) (Grant no. N00014-09-1 0090). The custom-built NMR microscopy and biofilm reactor hardware development was supported by the National Institutes of Health (NIDCR) (Grant no. R21 DE017232). This research was supported by the U.S. Department of Energy (DOE), Office of Biological and Environmental Research (BER), as part of BER’s Subsurface Biogeochemistry Research Program (SBR). This contribution originates, in part, from the SBR Scientific Focus Area (SFA) at the Pacific Northwest National Laboratory (PNNL). Part of the research was performed using EMSL, a national scientific user facility sponsored by the Department of Energy’s Office of Biological and Environmental Research and located at Pacific Northwest National Laboratory. M.B. and K.K. were supported in part by the ANL Scientific Focus Area project, which is part of the Subsurface Biogeochemical Research Program of the Office of Biological and Environmental Research (BER), U.S. DOE under contracts DE-AC05-76RLO and DE-AC02-06CH11357, respectively. Use of the Advanced Photon Source (APS) was supported by the DOE-SC Office of Basic Energy Sciences, under contract DE-AC02-06CH11357. MRCAT/EnviroCAT operations are supported by DOE and the MRCAT/EnviroCAT member institutions. NIH Protein Biotechnology Training Grant T32-GM008336 helped fund R.R. and J.B. during this project. We thank H.S. Mehta for assistance with the radio frequency coil design, R.J. Ewing and T.W. Ewing for computer-aided design of the biofilm reactor figures, and D. Sholto-Douglas for assistance with the X-ray micro-XANES measurements.
Works Cited
- 1.Bond DR, Lovley DR. Appl. Environ. Microbiol. 2003;69:1548–1555. doi: 10.1128/AEM.69.3.1548-1555.2003. [DOI] [PMC free article] [PubMed] [Google Scholar]
- 2.Reguera G, McCarthy KD, Mehta T, Nicoll JS, Tuominen MT, Lovley DR. Nature. 2005;435:1098–1101. doi: 10.1038/nature03661. [DOI] [PubMed] [Google Scholar]
- 3.Marsili E, Sun J, Bond DR. Electroanalysis. 2010;22:865–874. [Google Scholar]
- 4.Reguera G, Nevin KP, Nicoll JS, Covalla SF, Woodard TL, Lovley DR. Appl. Environ. Microbiol. 2006;72:7345–7348. doi: 10.1128/AEM.01444-06. [DOI] [PMC free article] [PubMed] [Google Scholar]
- 5.Malvankar NS, Tuominen MT, Lovley DR. Energy Environ. Sci. 2012;5:5790–5797. [Google Scholar]
- 6.Malvankar NS, Tuominen MT, Lovley DR. Energy Environ. Sci. 2012;5:6247–6249. [Google Scholar]
- 7.Strycharz-Glaven SM, Snider RM, Guiseppi-Elie A, Tender LM. Energy Environ. Sci. 2011;4:4366–4379. [Google Scholar]
- 8.Strycharz-Glaven SM, Tender LM. Energy Environ. Sci. 2012;5:6250–6255. [Google Scholar]
- 9.Malvankar NS, Vargas M, Nevin KP, Franks AE, Leang C, Kim BC, Inoue K, Mester T, Covalla SF, Johnson JP, Rotello VM, Tuominen MT, Lovley DR. Nat. Nanotechnol. 2011;6:573–579. doi: 10.1038/nnano.2011.119. [DOI] [PubMed] [Google Scholar]
- 10.Jain A, Gazzola G, Panzera A, Zanoni M, Marsili E. Electrochim. Acta. 2011;56:10776–10785. [Google Scholar]
- 11.Marcus AK, Torres CI, Rittmann BE. Biotechnol. Bioeng. 2007;98:1171–1182. doi: 10.1002/bit.21533. [DOI] [PubMed] [Google Scholar]
- 12.Liu Y, Kim H, Franklin R, Bond DR. Energy Environ. Sci. 2010;3:1782–1788. [Google Scholar]
- 13.Babauta JT, Nguyen HD, Harrington TD, Renslow R, Beyenal H. Biotechnol. Bioeng. 2012;109:2651–2662. doi: 10.1002/bit.24538. [DOI] [PMC free article] [PubMed] [Google Scholar]
- 14.Franks AE, Nevin KP, Jia HF, Izallalen M, Woodard TL, Lovley DR. Energy Environ. Sci. 2009;2:113–119. [Google Scholar]
- 15.Marcus AK, Torres CI, Rittmann BE. Bioresource Technology. 2011;102:253–262. doi: 10.1016/j.biortech.2010.03.100. [DOI] [PubMed] [Google Scholar]
- 16.Bond DR, Strycharz-Glaven SM, Tender LM, Torres CI. Chemsuschem. 2012;5:1099–1105. doi: 10.1002/cssc.201100748. [DOI] [PubMed] [Google Scholar]
- 17.Torres CI, Marcus AK, Rittmann BE. Biotechnol. Bioeng. 2008;100:872–881. doi: 10.1002/bit.21821. [DOI] [PubMed] [Google Scholar]
- 18.Leang C, Qian X, Mester T, Lovley DR. Appl. Environ. Microbiol. 2010;76:4080–4084. doi: 10.1128/AEM.00023-10. [DOI] [PMC free article] [PubMed] [Google Scholar]
- 19.Malvankar NS, Tuominen MT, Lovley DR. Energy Environ. Sci. 2012;5:8651–8659. [Google Scholar]
- 20.Esteve-Nunez A, Rothermich M, Sharma M, Lovley D. Environ Microbiol. 2005;7:641–648. doi: 10.1111/j.1462-2920.2005.00731.x. [DOI] [PubMed] [Google Scholar]
- 21.Liu Y, Kim H, Franklin RR, Bond DR. ChemPhysChem. 2011;12:2235–2241. doi: 10.1002/cphc.201100246. [DOI] [PubMed] [Google Scholar]
- 22.Franks AE, Nevin KP, Glaven RH, Lovley DR. ISME Journal: Multidisciplinary Journal of Microbial Ecology. 2010;4:509–519. doi: 10.1038/ismej.2009.137. [DOI] [PubMed] [Google Scholar]
- 23.Franks AE, Glaven RH, Lovley DR. Chemsuschem. 2012;5:1092–1098. doi: 10.1002/cssc.201100714. [DOI] [PubMed] [Google Scholar]
- 24.Renslow RS, Babauta JT, Majors PD, Beyenal H. Energy Environ. Sci. 2013;6:595–607. doi: 10.1039/C2EE23394K. [DOI] [PMC free article] [PubMed] [Google Scholar]
- 25.Logan BE. Nat Rev Micro. 2009;7:375–381. doi: 10.1038/nrmicro2113. [DOI] [PubMed] [Google Scholar]
- 26.Babauta J, Renslow R, Lewandowski Z, Beyenal H. Biofouling. 2012;28:789–812. doi: 10.1080/08927014.2012.710324. [DOI] [PMC free article] [PubMed] [Google Scholar]
- 27.Logan BE, Hamelers B, Rozendal RA, Schröder U, Keller J, Freguia S, Aelterman P, Verstraete W, Rabaey K. Environmental Science & Technology. 2006;40:5181–5192. doi: 10.1021/es0605016. [DOI] [PubMed] [Google Scholar]
- 28.Lovley DR. Nat Rev Micro. 2006;4:497–508. doi: 10.1038/nrmicro1442. [DOI] [PubMed] [Google Scholar]
- 29.Logan BE, Regan JM. Trends Microbiol. 2006;14:512–518. doi: 10.1016/j.tim.2006.10.003. [DOI] [PubMed] [Google Scholar]
- 30.McLean JS, Majors PD, Reardon CL, Bilskis CL, Reed SB, Romine MF, Fredrickson JK. Journal of microbiological methods. 2008;74:47–56. doi: 10.1016/j.mimet.2008.02.015. [DOI] [PubMed] [Google Scholar]
- 31.Seeliger S, Cord-Ruwisch R, Schink B. J. Bacteriol. 1998;180:3686–3691. doi: 10.1128/jb.180.14.3686-3691.1998. [DOI] [PMC free article] [PubMed] [Google Scholar]
- 32.Renslow RS, Majors PD, McLean JS, Fredrickson JK, Ahmed B, Beyenal H. Biotechnol. Bioeng. 2010;106:928–937. doi: 10.1002/bit.22755. [DOI] [PMC free article] [PubMed] [Google Scholar]
- 33.Nevin KP, Richter H, Covalla SF, Johnson JP, Woodard TL, Orloff AL, Jia H, Zhang M, Lovley DR. Environ Microbiol. 2008;10:2505–2514. doi: 10.1111/j.1462-2920.2008.01675.x. [DOI] [PubMed] [Google Scholar]
- 34.Reguera G. Biochemical Society transactions. 2012;40:1227–1232. doi: 10.1042/BST20120162. [DOI] [PubMed] [Google Scholar]
- 35.Cologgi DL, Lampa-Pastirk S, Speers AM, Kelly SD, Reguera G. Proceedings of the National Academy of Sciences of the United States of America. 2011;108:15248–15252. doi: 10.1073/pnas.1108616108. [DOI] [PMC free article] [PubMed] [Google Scholar]
- 36.Anderson RT, Vrionis HA, Ortiz-Bernad I, Resch CT, Long PE, Dayvault R, Karp K, Marutzky S, Metzler DR, Peacock A, White DC, Lowe M, Lovley DR. Appl. Environ. Microbiol. 2003;69:5884–5891. doi: 10.1128/AEM.69.10.5884-5891.2003. [DOI] [PMC free article] [PubMed] [Google Scholar]
- 37.Burgos WD, McDonough JT, Senko JM, Zhang G, Dohnalkova AC, Kelly SD, Gorby Y, Kemner KM. Geochimica Et Cosmochimica Acta. 2008;72:4901–4915. [Google Scholar]
- 38.Senko JM, Kelly SD, Dohnalkova AC, McDonough JT, Kemner KM, Burgos WD. Geochimica Et Cosmochimica Acta. 2007;71:4644–4654. [Google Scholar]
- 39.Schrott GD, Bonanni PS, Robuschi L, Esteve-Nunez A, Busalmen JP. Electrochim. Acta. 2011;56:10791–10795. [Google Scholar]
- 40.Soussan L, Riess J, Erable B, Delia M-L, Bergel A. Electrochemistry Communications. 2013;28:27–30. [Google Scholar]
- 41.Gregory KB, Bond DR, Lovley DR. Environ Microbiol. 2004;6:596–604. doi: 10.1111/j.1462-2920.2004.00593.x. [DOI] [PubMed] [Google Scholar]
- 42.Dumas C, Basseguy R, Bergel A. Electrochim. Acta. 2008;53:2494–2500. [Google Scholar]
- 43.Nealson KH, Finkel SE. Mrs Bulletin. 2011;36:380–384. [Google Scholar]
- 44.Cao B, Majors PD, Ahmed B, Renslow RS, Silvia CP, Shi L, Kjelleberg S, Fredrickson JK, Beyenal H. Environ Microbiol. 2012;14:2901–2910. doi: 10.1111/j.1462-2920.2012.02850.x. [DOI] [PMC free article] [PubMed] [Google Scholar]
- 45.Richter H, McCarthy K, Nevin KP, Johnson JP, Rotello VM, Lovley DR. Langmuir. 2008;24:4376–4379. doi: 10.1021/la703469y. [DOI] [PubMed] [Google Scholar]
- 46.Miller TL, Wolin MJ. Applied microbiology. 1974;27:985–987. doi: 10.1128/am.27.5.985-987.1974. [DOI] [PMC free article] [PubMed] [Google Scholar]
- 47.Segre CU, Leyarovska NE, Chapman LD, Lavender WM, Plag PW, King AS, Kropf AJ, Bunker BA, Kemner KM, Dutta P, Duran RS, Kaduk J. AIP Conference Proceedings. 2000;521:419–422. [Google Scholar]
- 48.Ravel B, Newville M. Journal of synchrotron radiation. 2005;12:537–541. doi: 10.1107/S0909049505012719. [DOI] [PubMed] [Google Scholar]
Associated Data
This section collects any data citations, data availability statements, or supplementary materials included in this article.


