Abstract.
Photoacoustic tomography (PAT) offers structural and functional imaging of living biological tissue with highly sensitive optical absorption contrast and excellent spatial resolution comparable to medical ultrasound (US) imaging. We report the development of a fully integrated PAT and US dual-modality imaging system, which performs signal scanning, image reconstruction, and display for both photoacoustic (PA) and US imaging all in a truly real-time manner. The back-projection (BP) algorithm for PA image reconstruction is optimized to reduce the computational cost and facilitate parallel computation on a state of the art graphics processing unit (GPU) card. For the first time, PAT and US imaging of the same object can be conducted simultaneously and continuously, at a real-time frame rate, presently limited by the laser repetition rate of 10 Hz. Noninvasive PAT and US imaging of human peripheral joints in vivo were achieved, demonstrating the satisfactory image quality realized with this system. Another experiment, simultaneous PAT and US imaging of contrast agent flowing through an artificial vessel, was conducted to verify the performance of this system for imaging fast biological events. The GPU-based image reconstruction software code for this dual-modality system is open source and available for download from http://sourceforge.net/projects/patrealtime.
Keywords: real time, photoacoustic imaging, parallel computing, ultrasound, dual-modality imaging
1. Introduction
After 20 years of development and study,1–9 biomedical photoacoustic (PA) imaging technologies are now ready for many clinical and preclinical applications. Offering a similar depth plane resolution as ultrasound (US) but with different optical contrast, photoacoustic tomography (PAT) is a natural complement to and can be integrated with US to realize dual-modality imaging. It should be a substantial advance to have such a system image the same object with PA and US functions simultaneously, both in a truly real-time manner. That is, all steps including data acquisition, image reconstruction, and image display are performed concurrently at a usefully real-time frame rate or rates. In this way, the practitioners do not have to shift back and forth between the two modalities. This might be particularly useful for diagnosis, treatment guidance, or treatment assessment when biological events occur at a less than steady repetition rate, or when a short term, usually single event occurs, such as bolus injection or intervention. Not only morphological information based on the two different contrasts is acquired, but also rich functional information, such as blood flow, perfusion, volume, and oxygenation level, all crucial physiological markers of many diseases including cancer.
Olafsson et al.10 proposed a real-time PAT method for imaging mouse cancer. Although the data acquisition is real time, the image reconstruction still needs to be conducted offline. The work conducted by Kolkman et al.11 is similar. Although PA and US images can be acquired in real time, display is offline. Li et al.12 introduced a study of the hemodynamics within the entire cerebral cortex of a mouse using real-time PAT, without US at the same time, at a limited frame rate of . Another system designed by Zemp et al.13 achieved a truly real-time imaging for PAT only by using a multicore computer. With a real-time reconstruction and display system, Kim et al.14 would propose a better PA and US merging image system for noninvasive sentinel lymph node imaging. The main challenge to achieve a truly real-time PA and US imaging simultaneously is the large computational cost for the reconstruction of high resolution tomographic PA images.
In this article, we propose an optimized back-projection (BP) algorithm to accelerate the reconstruction of PA images. Other than reducing the computational cost, the optimized reconstruction algorithm also facilitates parallel computation and, hence, can be executed on a recent graphics processing unit (GPU) card. Based on this development, a PA and US dual-modality imaging system has been built on an experimental US unit working with a PC containing a GPU card. Using a linear array probe, the performance of this system to acquire PA and US images simultaneously, both in a truly real-time manner, has been examined through the experiments on both tissue phantoms and human peripheral joints in vivo.
2. Background
For reconstruction of a two-dimensional (2-D) PA image, the following equation is used:15
| (1) |
where is the measured acoustic pressure at position and time , is the initial PA pressure, is the solid angle subtended by the entire surface of the transducer aperture with respect to the reconstruction point , is the vector of the probe element, and is defined as
| (2) |
where is the normal vector of . Considering the solid directivity of the transducer, the discrete formulation of Eq. (1) is
| (3) |
where is the sample interval of the transducer, is the directivity function of each probe element which can be described as
| (4) |
where and are the half widths of the transducer aperture, is the mass density of the tissue, is the wavelength of the sound, and and are the projection angles of the vector on the plane and plane.
Using Eq. (3) to reconstruct PA images, we must perform a traversal calculation on all points repeatedly. The calculation complexity is when the reconstruction area contains pixels and the number of probe elements is . To achieve real-time reconstruction of PA images, we need a computer that offers both a high level parallel computing structure and a large memory to store source data. According to our experiment, using a recent 12-core CPU-based computer (Apple Mac Pro, 2 six-core Xeon processors, 24GB DDR3 memory, cost about $5,000), it still requires 3.3 s to reconstruct a -pixel PA image from 128-channel signals each with a data length of 2048.
3. Optimized Parallel PAT Method and the Implementation
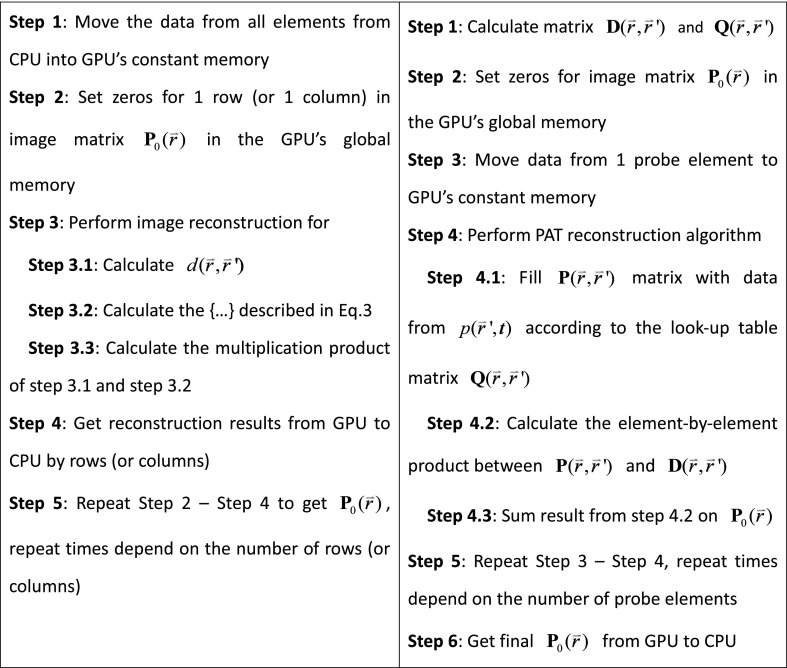
Instead of using sample data from all probe elements to reconstruct each PA image by pixels, we optimize the BP algorithm by building a time series of PA images progressively by each probe element so that more calculations can be done in parallel. The matrix form of Eq. (3) can be expressed as
| (5) |
where is the image matrix with dimension of . , with dimension of , indicates the contribution to the image from the probe element at , where each element in represents the in Eq. (3). The directivity function matrix , whose elements are defined in Eq. (4) with dimension of , can also be calculated in advance. In Eq. (5), the operation means performing multiplication element-by-element between two matrices.
For a given linear probe and a given image plane, is fixed for each pair of probe element and pixel. Therefore, , , and in Eq. (3) can all be calculated in advance. To speed up the computation of for each probe element, we create an dimension look-up table matrix , whose elements’ values are defined as . The matrix gives the correspondent address of each image pixel for the signal from this element and can be calculated before the image reconstruction. Instead of calculating all the elements’ values in , they can be filled quickly according to the address information in once the PA signal from each probe element is known.
The total computational capability of a GPU chip is drastically enhanced by the large number of the GPU cores in the chip although one GPU core has limited capability compared with one CPU core.16 Figure 1 shows the NVidia GPU (GeForce GTX690 GPU card, 3072 CUDA cores, NVidia, cost less than $1,000) structure. The maximum number of parallel computing threads in an NVidia GeForce GTX690 is . This number will decrease as the computation complexity or memory required in each thread increases. Every independent calculation core in the GPU needs its own copy of the data to be used. The traditional BP algorithm reconstructs PA images by pixels, which means that the sample data from all probe elements have to be copied to the GPU memory for each GPU core. In this way, the parallel reconstruction of all image pixels requires enormous memory. Restricted by the memory size of the GPU, we can only build the PA image by rows (or columns) using a traditional BP algorithm, as illustrated in Fig. 2.
Fig. 1.
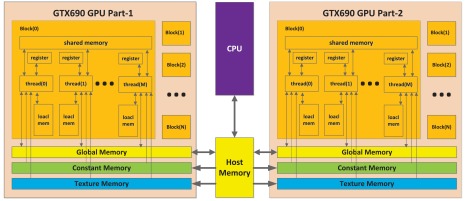
Structure of NVidia GTX690 GPU.
Fig. 2.
(Left) Traditional back-projection (BP) algorithm versus (right) optimized BP algorithm. The GPU-based image reconstruction software code for this dual-modality system is open source and available for download from http://sourceforge.net/projects/patrealtime.
With the optimized BP algorithm, we can build the whole PA image progressively as shown in Fig. 2. The total memory consumption is lowered because every GPU core only needs the data from one probe element. The comparison among different reconstruction methods for the same PA image from 128-channel signals, each with 2048 data length, is shown in Table 1.
Table 1.
Performance in PA image reconstruction (image size: ).
| Reconstruction method | CPU time | GPU time | Total time | Memory usage | Cores usage |
|---|---|---|---|---|---|
| CPU (without parallel) | 29.5 s | — | 29.5 s | 8 MB from host memory | 1 CPU core |
| CPU (with parallel) | 3.3 s | — | 3.3 s | 96 MB from host memory | 12 CPU cores |
| GPU (traditional BP) by rows | 13 ms | 352 ms | 365 ms | 256 MB from GPU | 512 GPU cores |
| GPU (traditional BP) whole image | Cannot be realized due to the insufficiency in memory | Unavailable 256 GB from GPU | 524,288 GPU cores | ||
| GPU (optimized BP) whole image | 8 ms | 50 ms | 58 ms | 2 GB from GPU | 524,288 GPU cores |
As shown in Table 1, the total GPU parallel calculation time when employing the optimized BP algorithm decreases by a factor of 500 compared to the result using a single CPU and traditional BP algorithm. The optimized algorithm increases the efficiency by approximately 500% compared to the traditional unoptimized algorithm. Considering the reconstruction of each image takes 58 ms, our system can achieve a frame rate of up to in the PA imaging mode. The current frame rate for our 2-D PAT is usually limited by the laser’s repetition rate of 10 Hz at full power.
4. Real-Time Dual PA and US Tomography Modality
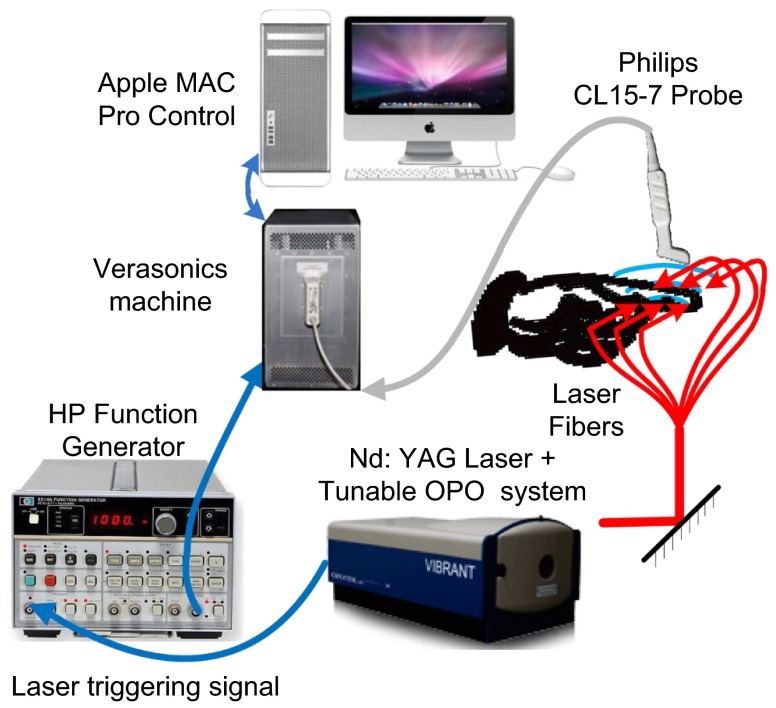
The schematic of the imaging system is shown in Fig. 3. A tunable optical parametric oscillator (OPO) laser (Vibrant B, Opotek Inc., Carlsbad, CA) pumped by the second harmonic output of a Nd:YAG pulsed laser (Brilliant B, Quantel, Bozeman, MT) is used to illuminate the sample with a repetition rate of 10 Hz and pulse duration of 5.5 ns. The laser system is tuned to 720 nm which gives the maximum output energy of . The Verasonics US unit (Model V3, Redmond, WA) is programmed to work along with the multicore computer equipped with the NVidia GeForce GTX690 GPU card. The probe connected to the Verasonics US imaging system for this work is a linear array (CL15-7, Philips North America Corporation, Andover, MA) with 128 elements, 11.25 MHz center frequency, and 75% bandwidth.
Fig. 3.
Schematic of the imaging system.
The internal pulse generator in the laser outputs a TTL trigger signal at 10 Hz. By using a function generator (3314A, HP) to create a square wave synchronized to the trigger from the laser, the Verasonics US unit works on the PA mode triggered by the rising edge of the square wave. Triggered by the falling edge, which is 40 ms after the rising edge, the US unit turns on the transmission and the rest of the US mode. By switching the transmission on and off, exactly synchronized with the laser pulses, the system employs the PA and US modes alternatively, both at a frame rate of 10 Hz. The reconstructed PA and US images from the same imaging plane are displayed simultaneously on the screen. PA and US images are reconstructed using hardware parallel computing techniques. The US image reconstruction and display are performed entirely with the multicore CPU. The PA image reconstruction is conducted mostly on the multicore GPU and takes only about 20% of the CPU computing resource. Therefore, there is no conflict in the computational and display procedures between the two imaging modes.
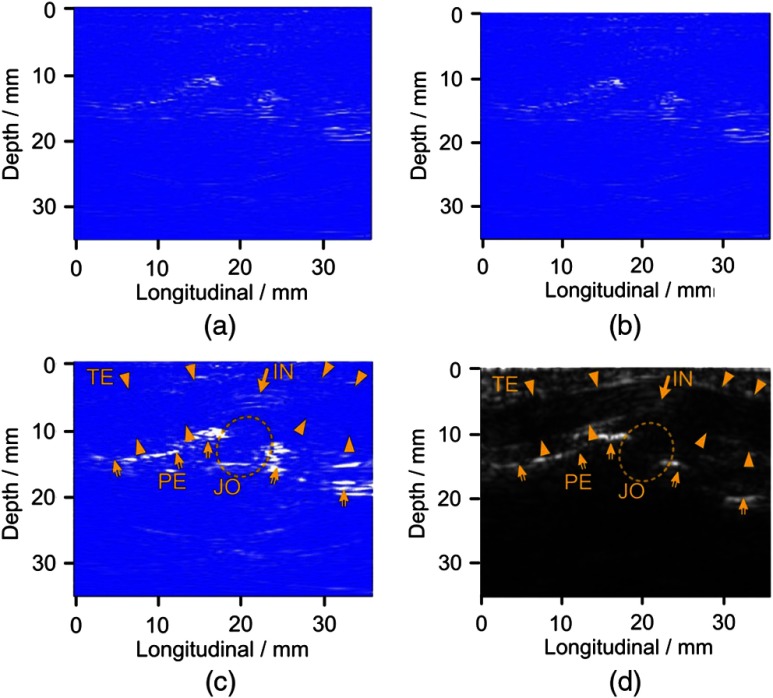
To examine the image quality that can be achieved with this system, noninvasive imaging of human peripheral joints in vivo was conducted. Figure 4 illustrates the result from the proximal interphalangeal joint of the index finger of a normal volunteer. The light energy density on the skin surface is approximately , significantly lower than the American National Standards Institute (ANSI) safety limit. The image reconstructed using the GPU and the optimized BP algorithm, as illustrated in Fig. 4(a), shows no obvious differences from that computed using the CPU and the traditional BP algorithm illustrated in Fig. 4(b). This indicates that the new technique can drastically elevate the computational speed without sacrificing image quality.
Fig. 4.
PA and US imaging of a human proximal interphalangeal joint. (a) PA image using traditional BP method. (b) PA image using optimized BP method. (c) PA image after envelop detection of the image in (b). (d) Gray scale US image. TE: tendon, JO: joint, PE: periosteum, BO: bone, and IN: inner structure of tendon.
Figure 4(c) shows the PA image reconstructed with the optimized BP algorithm followed by envelope detection using the equation of , where is the Hilbert transform of . Figure 4(d) shows the gray scale B-scan US image from the same joint consisting of 128 beams.17 We can discern comparable morphological features between the PA and US images, including the contour of the bone and the tendon.
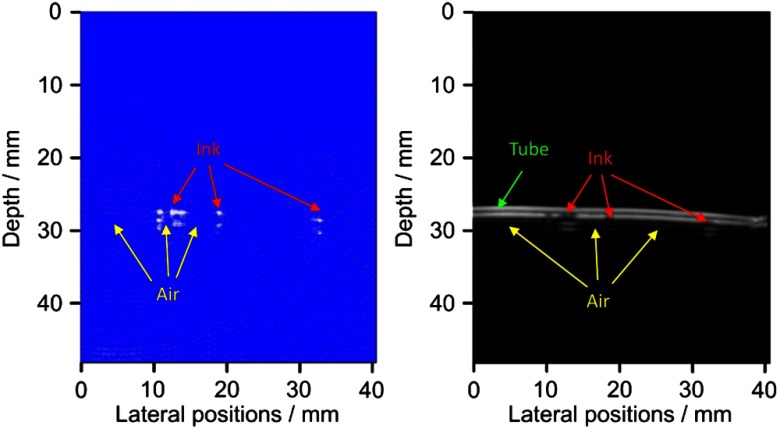
To validate the performance of this system to image moving events in biological samples, artificial vessels made from an optically transparent soft tube with a diameter of 3 mm were employed. By immersing the body of the soft tube in a water tank, periodic red ink droplets and air bubbles were pushed through the tube manually by using a syringe, with a speed of about . Using this dual-modality system, we imaged the moving of the ink droplets and the air bubbles, as illustrated in Video 1 and Fig. 5, at a frame rate of 10 Hz. In images with the optical and ultrasonic contrasts, respectively, we can see the ink droplets with satisfactory contrast-to-noise ratio. A video showing the real-time imaging results in both PA and US modes can also be found online at http://sourceforge.net/projects/patrealtime.
Fig. 5.
5. Conclusion
Based on different contrasts, US and PAT each can reveal different tissue morphological features and functional properties. A dual-modality system facilitating both imaging functions should offer more comprehensive information in biological tissues for improved diagnostic imaging and therapeutic planning and monitoring. In this work, after optimizing the code for BP-based image reconstruction and by taking advantage of the excellent parallel computational capability of the GPU, we have for the first time achieved truly real-time PA and US dual-modality imaging using a practical experimental system. On the PA imaging mode, when the image size is pixels and the data volume of signals is 128 channels by 2048 points, the maximum frame rate achievable with this system is , sufficient for visually continuous real-time imaging. When the image size or the data volume is reduced, and the pulse repetition rate of the laser is increased, the dual-modality frame rate is increased correspondingly. The GPU-based image reconstruction software code for this dual-modality system is made freely available. We expect that such a system, enabling the evaluation of fast functional activities by accessing the intrinsic optical contrast in tissues, could lead to new discoveries in clinic and basic research. This technique may also prove useful in guiding therapies or interventions and in evaluating the function of organs or tissues by quantifying the delivery or perfusion of optically absorbing contrast agents. Because US imaging of the same object can also be conducted in real-time without being affected, the US, which has been accepted as a standard tool, can assist in guiding PA procedures and helping in the interpretation of PA image findings. Our next step for updating this dual-modality system is to synthesize PA and US images into one image18 in real time to merge individual information from both imaging methods.
Acknowledgments
This research was supported by the National Natural Science Foundation of China under grant numbers 61201425, 61100111, and 11028408, and the National Institutes of Health of the United States under grant numbers R01AR060350, R01CA91713, and R01AR055179.
References
- 1.Xu M., Wang L. V., “Photoacoustic imaging in biomedicine,” Rev. Sci. Instrum. 77(4), 041101 (2006). 10.1063/1.2195024 [DOI] [Google Scholar]
- 2.Wang X., et al. , “Photoacoustic imaging with a commercial ultrasound system and a custom probe,” Ultrasound Med. Biol. 37(3), 484–492 (2011). 10.1016/j.ultrasmedbio.2010.12.005 [DOI] [PMC free article] [PubMed] [Google Scholar]
- 3.Wang Y., et al. , “In vivo three-dimensional photoacoustic imaging based on a clinical matrix array ultrasound probe,” J. Biomed. Opt. 17(6), 061208 (2012). 10.1117/1.JBO.17.6.061208 [DOI] [PMC free article] [PubMed] [Google Scholar]
- 4.Kim S., et al. , “In vivo three-dimensional spectroscopic photoacoustic imaging for monitoring nanoparticle delivery,” Biomed. Opt. Express 2(9), 2540–2550 (2011). 10.1364/BOE.2.002540 [DOI] [PMC free article] [PubMed] [Google Scholar]
- 5.Niederhauser J. J., et al. , “Combined ultrasound and optoacoustic system for real-time high-contrast vascular imaging in vivo,” IEEE Trans. Med. Imag. 24(4), 436–440 (2005). 10.1109/TMI.2004.843199 [DOI] [PubMed] [Google Scholar]
- 6.Laufer J., et al. , “In vivo preclinical photoacoustic imaging of tumor vasculature development and therapy,” J. Biomed. Opt. 17(5), 056016 (2012). 10.1117/1.JBO.17.5.056016 [DOI] [PubMed] [Google Scholar]
- 7.Luke G. P., Yeager D., Emelianov S. Y., “Biomedical applications of photoacoustic imaging with exogenous contrast agents,” Ann. Biomed. Eng. 40(2), 422–437 (2012). 10.1007/s10439-011-0449-4 [DOI] [PubMed] [Google Scholar]
- 8.Stein E. W., Maslov K., Wang L. V., “Noninvasive, in vivo imaging of blood-oxygenation dynamics within the mouse brain using photoacoustic microscopy,” J. Biomed. Opt. 14(2), 020502 (2009). 10.1117/1.3095799 [DOI] [PMC free article] [PubMed] [Google Scholar]
- 9.Wang X., et al. , “Noninvasive laser-induced photoacoustic tomography for structural and functional in vivo imaging of the brain,” Nat. Biotechnol. 21(7), 803–806 (2003). 10.1038/nbt839 [DOI] [PubMed] [Google Scholar]
- 10.Olafsson R., et al. , “Real-time, contrast enhanced photoacoustic imaging of cancer in a mouse window chamber,” Opt. Express 18(18), 18625–18632 (2010). 10.1364/OE.18.018625 [DOI] [PubMed] [Google Scholar]
- 11.Kolkman R. G., et al. , “Real-time in vivo photoacoustic and ultrasound imaging,” J. Biomed. Opt. 13(5), 050510 (2008). 10.1117/1.3005421 [DOI] [PubMed] [Google Scholar]
- 12.Li C., et al. , “Real-time photoacoustic tomography of cortical hemodynamics in small animals,” J. Biomed. Opt. 15(1), 010509 (2010). 10.1117/12.842159 [DOI] [PMC free article] [PubMed] [Google Scholar]
- 13.Zemp R. J., et al. , “Realtime photoacoustic microscopy in vivo with a 30-MHz ultrasound array transducer,” Opt. Express 16(11), 7915–7928 (2008). 10.1364/OE.16.007915 [DOI] [PMC free article] [PubMed] [Google Scholar]
- 14.Kim C., et al. , “Performance benchmarks of an array-based hand-held photoacoustic probe adapted from a clinical ultrasound system for noninvasive sentinel lymph node imaging,” Philos. Trans. R. Soc. A Math. Phys. Eng. Sci. 369(1955), 4644–4650 (2011). 10.1098/rsta.2010.0353 [DOI] [PMC free article] [PubMed] [Google Scholar]
- 15.Xu M., Wang L. V., “Universal back-projection algorithm for photoacoustic computed tomography,” Phys. Rev. E 71(1), 016706 (2005). 10.1103/PhysRevE.71.016706 [DOI] [PubMed] [Google Scholar]
- 16.Alerstam E., et al. , “Next-generation acceleration and code optimization for light transport in turbid media using GPUs,” Biomed. Opt. Express 1(2), 658–675 (2010). 10.1364/BOE.1.000658 [DOI] [PMC free article] [PubMed] [Google Scholar]
- 17.Strobel D., et al. , “Phase inversion harmonic imaging versus contrast-enhanced power Doppler sonography for the characterization of focal liver lesions,” Int. J. Colorectal Dis. 18(1), 63–72 (2003). 10.1007/s00384-002-0397-4 [DOI] [PubMed] [Google Scholar]
- 18.Kim C., et al. , “Performance benchmarks of an array-based hand-held photoacoustic probe adapted from a clinical ultrasound system for noninvasive sentinel lymph node imaging,” Philos. Trans. R. Soc. A Math. Phys. Eng. Sci. 369(1955), 4644–4650 (2011). 10.1098/rsta.2010.0353 [DOI] [PMC free article] [PubMed] [Google Scholar]
Associated Data
This section collects any data citations, data availability statements, or supplementary materials included in this article.


