

Abstract
The association between obstructive sleep apnea (OSA) and hypertension by race/ethnicity has not been well characterized in a national sample. Adult participants in the 2007–2008 National Health and Nutrition Examination Survey were reviewed by self‐report of sleep apnea diagnosis, snorting, gasping or stopping breathing during sleep, and snoring to derive whether OSA was probable (pOSA). Multivariable logistic regression determined whether pOSA predicted hypertension in the overall cohort, and by body mass index (BMI) group and ethno‐racial strata. pOSA predicted hypertension in several groups: (1) Within BMI strata, there was a significant association among overweight individuals [odds ratio [OR], 1.82; 95% confidence interval [CI], 1.26–2.62); (2) In race/ethnicity subgroups, the association was significant among Hispanic/Latinos (OR, 1.69; 95% CI, 1.13–2.53) and whites (OR, 1.40; 95% CI, 1.07–1.84); (3) In models stratified by both race/ethnicity and BMI, pOSA predicted hypertension among overweight black/African Americans (OR, 4.74; 95% CI, 1.86–12.03), overweight whites (OR, 1.65; 95% CI, 1.06–2.57), and obese Hispanic/Latino participants (OR, 2.01; 95% CI, 1.16–3.49). A simple, self‐report tool for OSA was strongly associated with hypertension, and may serve as a potential future opportunity for OSA diagnosis.
Obstructive sleep apnea (OSA) is a common sleep disorder1, 2 and is characterized by intermittent collapse of the upper airway during sleep.3 Diagnosis of OSA relies on polysomnography (PSG), which counts the number of apneas (flow cessations) or hypopneas (flow reductions) per hour of sleep to compute the apnea‐hypopnea index.4 OSA has been linked to hypertension in cross‐sectional5 and longitudinal6, 7 studies. A recent meta‐analysis of randomized controlled trials as well as recent findings from a randomized controlled trial in nonsleepy individuals concluded that treating OSA with positive airway pressure (PAP) lowers blood pressure (BP).8, 9 While the pooled estimate of the effect of PAP was modest, the reduction was more prominent in groups with more severe apnea and higher compliance with PAP therapy. Accordingly, the American Heart Association listed OSA among treatable causes of hypertension.10 These data provide a compelling case for widespread identification and treatment of OSA among patients with hypertension.
The diagnostic gold standard for OSA remains PSG; however, PSG relies on a sleep laboratory, requires technical expertise, is expensive, and is often inaccessible.11 These characteristics make PSG unsuitable for population‐wide case finding. While portable, limited‐channel testing is gaining attention, the need persists for a quick, easy, and inexpensive strategy to assess risk on a population‐wide level, so that diagnostic testing can be targeted to select groups at highest risk.
Body mass index (BMI) has been used for measuring obesity, which is a risk factor for OSA,12 and identifies apnea with reasonable accuracy.13, 14, 15 Among nonobese referrals to sleep centers, however, certain self‐reported symptoms may add value in risk assessment.13 While choking, gasping, and apneas witnessed during sleep by others are common symptoms of apnea, self‐reported snoring is not only a sensitive symptom of OSA16, 17, 18, 19 but has also been associated with hypertension in OSA.20, 21 This relationship between OSA symptoms and hypertension may be mediated by race and ethnicity,22, 23 but availability of robust data in subgroups such as Hispanic/Latinos is limited. Additionally, typical symptom experience, such as witnessed apneas or morning headaches, have been purported to be less useful among women.24, 25
To date, limited evidence exists regarding the association between OSA and hypertension by race/ethnicity group in a national, ethnically diverse sample. Accordingly, using data from the National Health and Nutrition Examination Survey (NHANES) (2007–2008) cohort, we aimed to determine whether: (1) self‐reported probable sleep apnea, based on snoring, snorting, or previous diagnosis, is significantly associated with hypertension; and (2) differences persist in this association when stratifying by race/ethnicity and obesity categories.
Methods
Study Sample
NHANES (2007–2008) is a nationally representative sample of noninstitutionalized individuals, and recruitment of participants, survey design, and sampling methodology have been explained elsewhere.26, 27 The overall response rates for the 2007–2008 survey was 10,149 patients (78.4%) for the health interview and 9762 (75.4%) for the physical examination. Because a primary aim was to evaluate associations by race, we first excluded participants in the “other race” category (n=465); we next excluded participants younger than 18 years (n=3715); and, subsequently, anyone with missing covariate data of interest (n=1551). Our final analysis sample (N=4418) included participants with complete data for the primary exposure (sleep apnea symptoms) and outcome (hypertension). All study participants gave informed consent before participation in the examination and study protocol.
Probable OSA
The primary outcome was the probable OSA (pOSA) score, which utilized 3 different questions from the survey items to identify likely sleep apnea. These included self‐reported (1) previous sleep apnea diagnosis; (2) snorting, gasping, or stopping breathing during sleep; and (3) snoring during sleep. Participants were asked “In the past 12 months, how often did you [a. snore] or [b. snort, gasp, stop breathing] while you were sleeping?” and possible questionnaire responses were: (1) “never”; (2) “1 or 2 nights per week”; (3) “3 or 4 nights per week”; (4) “5 or more nights per week.” Participants responding to either snoring ≥3 to 4 times per week or snorting ≥3 to 4 times per week or who reported previous sleep apnea diagnosis were identified as having pOSA.28
Hypertension
Participants were identified as having hypertension or not if they had a systolic BP ≥140 mm Hg or diastolic BP ≥90 mm Hg, or if they were taking BP‐lowering medications.
Sleep Characteristics
Additional survey items on sleep that were assessed evaluated nonrestorative sleep and daytime sleepiness. For nonrestorative sleep, participants were asked “Over the past month, how often do you feel unrested during the day, no matter how many hours of sleep you have had?” Daytime sleepiness was measured using the following question: “In the past month, how often do you feel excessively or overly sleepy during the day?” Response options for both questions included: (1) never; (2) rarely (1 time permonth); (3) sometimes (2–4 times per month); (4) often (5–15 times per month); (5) almost always (16–30 times per month).
Covariates
A number of covariates were considered in regression models, including socioeconomic status (SES) and health characteristics (Table 2). SES characteristics were measured via self‐report from the in‐person interview and were considered for the analysis given that they are associated with sleep complaints and hypertension. Objectively measured anthropometrics were obtained according to NHANES protocols, including height (m) and weight (kg) in order to calculate BMI (kg/m2) and waist circumference (cm).28 Health behaviors were evaluated based on interview questions. Participants were asked “Over the past month, how often did you …?” Depression status was measured using the 9‐item symptom depression scale based on the Patient Health Questionnaire (PHQ‐9).29
Table 2.
Demographics, Sleep Characteristics, and Anthropometrics by Hypertension Status
| Predictor | Subgroup | Overall (N=4418) | Hypertension | ||
|---|---|---|---|---|---|
| No (n=2220) | Yes (n=2198) | P Valuea | |||
| Probable OSA, % | No | 66.70 | 71.64 | 57.64 | <.0001 |
| Yes | 33.30 | 28.36 | 42.36 | ||
| Apnea, % | No | 95.23 | 97.40 | 91.24 | <.0001 |
| Yes | 4.77 | 2.60 | 8.76 | ||
| Snore, % | Never | 29.56 | 32.81 | 23.26 | <.0001 |
| Rarely | 18.37 | 20.05 | 15.11 | ||
| Occasionally | 19.19 | 18.85 | 19.87 | ||
| Frequently | 32.88 | 28.29 | 41.76 | ||
| Snort, % | Never | 78.86 | 80.78 | 75.24 | .0001 |
| Rarely | 8.41 | 8.54 | 8.16 | ||
| Occasionally | 6.57 | 5.85 | 7.94 | ||
| Frequently | 6.16 | 4.84 | 8.66 | ||
| Daytime sleepiness, % | Never | 31.36 | 30.63 | 32.70 | .1974 |
| Rarely | 21.97 | 21.83 | 22.23 | ||
| Sometimes | 28.00 | 28.66 | 26.79 | ||
| Often | 12.91 | 13.62 | 11.61 | ||
| Almost always | 5.75 | 5.25 | 6.67 | ||
| Unrestful sleep, % | Never | 26.47 | 24.24 | 30.58 | .0002 |
| Rarely | 16.40 | 15.73 | 17.64 | ||
| Sometimes | 28.34 | 29.81 | 25.65 | ||
| Often | 18.03 | 19.57 | 15.19 | ||
| Almost always | 10.76 | 10.66 | 10.95 | ||
| Race, % | Non‐Hispanic white | 75.16 | 73.00 | 79.14 | <.0001 |
| Hispanic/Latinos | 13.35 | 16.45 | 7.65 | ||
| Black/African American | 11.49 | 10.55 | 13.21 | ||
| BMI, kg/m2 | 28.7±6.6 | 27.7±5.8 | 30.5±7.8 | <.0001 | |
| Waist circumference, cm | 98.6±16.3 | 95.2±14.5 | 104.7±17.6 | <.0001 | |
| BMI group, % | BMI <25 | 30.79 | 36.23 | 20.79 | <.0001 |
| BMI 25–30 | 34.94 | 35.41 | 34.08 | ||
| BMI ≥30 | 34.27 | 28.36 | 45.12 | ||
| Sex,% | Female | 51.85 | 52.34 | 50.95 | .4735 |
| Male | 48.15 | 47.66 | 49.05 | ||
Abbreviations: BMI, body mass index; OSA, obstructive sleep apnea. P value from t test (for continuous variables) or chi‐square test (for categoric variables) comparing patients with hypertension with patients without hypertension.
Statistical Analysis
We summarized demographics, clinical characteristics, and sleep measures among race/ethnicity groups using proportions for categorical variables and means (±standard deviations [SDs]) for continuous variables. Comparisons among race/ethnicity groups (Table 1 and Table S1) were assessed using analysis of variance for continuous characteristics and chi‐square tests for categorical covariates (a P<.05 means that at least one of the 3 groups is different). We then compared the sleep characteristics, race/ethnicity and anthropometrics across hypertension status using t tests or chi‐square tests for continuous or categoric covariates, respectively (Table 2).To evaluate the adjusted association between sleep apnea risk and hypertension, we subsequently performed multivariable logistic regression analysis. In the multivariable models we added covariates (described above) that were theoretically important based on previous literature. Multivariate logistic regression models were also stratified by race/ethnicity group and obesity category (Table 3 and Table 4). Interactions between pOSA and BMI categories (<25, 25–30, ≥30 kg/m2) and race/ethnicity were also evaluated. The sample weights provided with the NHANES data, which reflect the unequal selection probabilities and other adjustments, were used in all analyses to ensure proper and unbiased estimates and standard errors. All analyses were conducted using SAS Software, version 9.3 (SAS Institute Inc, Cary, NC) or Stata, version 12 (StataCorp, College Station, TX).
Table 1.
Demographic Information Stratified by Race/Ethnicity
| Variable | Overall (N=4418) | Non‐Hispanic White (n=2230) | Hispanic/Latinos (n=1255) | Black/African American (n=933) | P Valuea |
|---|---|---|---|---|---|
| Hypertension, % | 35.26 | 37.13 | 20.22 | 40.54 | <.0001 |
| Probable obstructive sleep apnea, % | 33.30 | 33.76 | 33.25 | 30.30 | .2160 |
| Daytime sleepiness (indicating “almost always,” or “often”), % | 18.66 | 20.04 | 12.29 | 17.06 | <.0001 |
| Body mass index, kg/m2 | 28.7±6.6 | 28.4±5.3 | 29.3±9.2 | 30.2±10.5 | <.0001 |
| Age, y | 46.5±16.4 | 48.0±13.6 | 40.3±21.0 | 44.0±21.1 | <.0001 |
| Men, % | 48.15 | 48.16 | 51.15 | 44.64 | .0530 |
| Alcohol use (drinks per day) | 2.03±2.70 | 1.90±1.85 | 3.06±6.73 | 1.75±2.68 | <.0001 |
| Current smoker, % | 23.16 | 23.23 | 19.66 | 26.83 | .0074 |
| Past smoker, % | 48.23 | 50.97 | 38.36 | 41.81 | <.0001 |
P value from analysis of variance (for continuous variables) or chi‐square test (for categoric variables) testing the global null hypothesis of equivalence across the 3 race/ethnicity groups.
Table 3.
Association Between pOSA and Hypertension: Overall and by BMI Group
| Outcome | OSA | Model | Overall (N=4418) | BMI Groups | ||||||
|---|---|---|---|---|---|---|---|---|---|---|
| BMI <25 (n=1233) Normal | BMI 25–30 (n=1551) Overweight | BMI ≥30 (n=1634) Obese | ||||||||
| OR (95% CI) | P Value | OR (95% CI) | P Value | OR (95% CI) | P Value | OR (95% CI) | P Value | |||
| Hypertension | pOSA | m1 | 1.86 (1.58–2.18) | <.0001 | 1.18 (0.78–1.76) | .4333 | 1.77 (1.34–2.34) | .0001 | 1.46 (1.14–1.88) | .0029 |
| m2 | 1.40 (1.13–1.75) | .0025 | 0.91 (0.54–1.53) | .7131 | 1.82 (1.26–2.62) | .0014 | 1.32 (0.96–1.81) | .0927 | ||
Abbreviations: CI, confidence interval; m1, unadjusted; m2, adjusted for age, sex, race, marital status, education, income to poverty ratio, health status, access to insurance, alcohol intake, current smoking, past smoking, depression, and body mass index (BMI) group (in “Overall” only); OR, odds ratio; pOSA, probable obstructive sleep apnea.
Table 4.
Association Between pOSA and Hypertension: Overall, and by Race/Ethnicity Group
| Outcome | OSA | Model | Overall (N=4418) | Race/Ethnicity Groups | ||||||
|---|---|---|---|---|---|---|---|---|---|---|
| Non‐Hispanic White (n=2230) | Hispanic/Latino (n=1255) | Black/African American (n=933) | ||||||||
| OR (95% CI) | P Value | OR (95% CI) | P Value | OR (95% CI) | P Value | OR (95% CI) | P Value | |||
| Hypertension | pOSA | m1 | 1.86 (1.58–2.18) | <.0001 | 1.78 (1.46–2.18) | <.0001 | 2.88 (2.18–3.80) | <.0001 | 1.88 (1.39–2.55) | <.0001 |
| m2 | 1.40 (1.13–1.75) | .0025 | 1.40 (1.07–1.84) | .0149 | 1.69 (1.13–2.53) | .0105 | 1.34 (0.88–2.03) | .1734 | ||
Abbreviations: CI, confidence interval; m1, unadjusted; m2, adjusted for age, sex, body mass index; group, marital status, education, income to poverty ratio, health status, access to insurance, alcohol intake, current smoking, past smoking, depression, and race (in “Overall” only); OR, odds ratio; pOSA, probable obstructive sleep apnea.
Results
The mean (±SD) age of the cohort was 46.5 (±16.4) years. More than half of the participants were women (51.9%) and married (56.6%), and 25.4% were college graduates. Thirty‐five percent of participants in the cohort met the criteria for high BP and were identified as having hypertension, and 33.3% were identified as having pOSA (Table 1). When stratifying by race/ethnicity, Hispanic/Latino participants had the lowest prevalence of hypertension (20.2%) and black/African Americans had the highest prevalence (40.5%) (P<.001). While only 13.2% of non‐Hispanic whites were uninsured, 24.2% of black/African Americans and 45.2% of Hispanic/Latinos reported not having health insurance (P<.001). Individuals with hypertension had a greater BMI (30.5 kg/m2±7.8 vs 27.7 kg/m2±5.8, P<.001) and waist circumference (104.7 cm±17.6 vs 95.2 cm±14.5, P<.001) than nonhypertensive patients (Table 2). When comparing sleep characteristics by hypertension status, hypertensive individuals were more likely to have apnea symptoms (P<.001), including previous physician diagnosis of sleep apnea (P<.001), frequent snoring (P<.001), and nonrestorative sleep (P<.001); however, there were no differences between hypertensive and nonhypertensive participants for daytime sleepiness (P=.197), which was consistent with previous reports (Table 2).13
We evaluated whether pOSA predicted hypertension first in the entire cohort, then within BMI and race/ethnicity strata. Among the entire cohort, pOSA was a significant predictor of hypertension in unadjusted models (odds ratio [OR], 1.86; 95% confidence interval [CI], 1.58–2.18) and in models adjusted for age, sex, race, marital status, education, income to poverty ratio, health status, access to insurance, alcohol intake, current and past smoking, and depression (OR, 1.40; 95% CI, 1.13–1.75) (Table 3 and Table 4). In obesity subgroups, the strongest significant association was observed among overweight individuals (OR, 1.82; 95% CI, 1.26–2.62), and this was not significant among normal (BMI <25 kg/m2) or obese (BMI ≥30 kg/m2) groups in fully adjusted models (Table 3). When stratifying by race/ethnicity, pOSA was the strongest predictor of hypertension among Hispanic/Latinos in unadjusted models (OR, 2.88; 95% CI, 2.18–3.80), and this association remained significant in fully adjusted models (OR, 1.69; 95% CI, 1.13–2.53) (Table 4). Among black/African American patients, pOSA was not a significant predictor of hypertension in fully adjusted models (Table 4), but effect modification by BMI group was evident (P value for interaction=.009). In multivariate models stratified by race/ethnicity and BMI, pOSA was associated with greater than a 4‐fold odds of hypertension among overweight black/African Americans (OR, 4.74; 95% CI, 1.86–12.03) (Figure 1, Table S2). This association was also significant among overweight non‐Hispanic whites (OR, 1.65; 95% CI, 1.06–2.57) in fully adjusted models. A significant association between pOSA and hypertension demonstrated a 2‐fold increased odds in fully adjusted models among obese Hispanic/Latino participants (OR, 2.01; 95% CI, 1.16–3.49), but not among overweight Hispanic/Latinos (OR, 1.59; 95% CI, 0.71–3.55) (Figure 1, Table S2).
Figure 1.
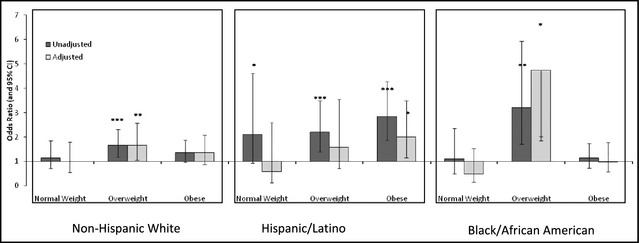
Association between probable obstructive sleep apnea and hypertension stratified by race and body mass index group. CI indicates confidence interval.
Discussion
These findings suggest that a pOSA score, which was based on symptoms and/or previous diagnosis, is an independent predictor of hypertension in an ethnically diverse sample. pOSA was most useful in overweight individuals (BMI of 25–30 kg/m2) and among Hispanic/Latinos. A strong and significant association was also demonstrated between pOSA and hypertension among obese Hispanic/Latinos, unlike the other race/ethnicity groups, where obesity may have “overshadowed” any additive risk conferred by background sleep apnea.
Convincing evidence suggested that sleep apnea symptoms are associated with hypertension among overweight individuals. OSA among obese populations has been widely studied30; however, our findings suggest that these self‐reported symptoms are more relevant in patients who are overweight but not obese. A possible reason for this is that obesity or morbid obesity already confers significant risk for cardiovascular disease, independent of the presence of OSA. However, in overweight groups such symptom assessment is helpful in marking those with hypertension, and future studies utilizing OSA screening should target this weight group.
The majority of large US sleep cohorts evaluating this topic have been relatively homogeneous, consisting mostly of non‐Hispanic white participants.31, 32, 33 The present study offers a more ethno‐racially diverse sample and highlights both the increased odds of hypertension among black/African Americans and Hispanic/Latinos with pOSA, as well as the need for further investigation and oversampling of these race groups in future studies.32
This recommendation is supported by the finding that the prevalence of hypertension and uncontrolled hypertension is disproportionately high among black/African Americans compared with non‐Hispanic whites (OR, 2.54; 95% CI, 1.90–3.40),34 and prevalence of hypertension among this race group has significantly increased from 1988 to 1994 through 2007 to 2008 (P=.04).35, 36 In addition, very little evidence exists regarding sleep health among Hispanic/Latinos, the fastest‐growing minority population in the United States.37 The Hispanic/Latino population has disproportionately high levels of obesity, hypertension, and cardiovascular disease,38, 39, 40 all of which are linked to sleep apnea. Our findings indicate that pOSA was associated with a 69% increased odds of hypertension among Hispanic/Latinos independent of sociodemographics and traditional cardiovascular risk factors. Although the prevalence of OSA in Hispanic/Latinos is unknown, studies suggest a greater prevalence of snoring among Hispanic/Latinos compared with their non‐Hispanic white counterparts (OR, 2.30; 95% CI, 1.43–3.69 for men and OR, 2.25; 95% CI, 1.48–3.42 for women).41 Thus, given the observed differences in race‐stratified adults, a better understanding of risk factors and treatment opportunities for sleep apnea and hypertension among black/African Americans and Hispanic/Latinos is needed when developing novel, population‐wide preventative and therapeutic strategies.
The nation‐wide obesity epidemic may be contributing to rising sleep apnea rates in the United States. As previously noted, PSG assessment is costly, time‐consuming, and not accessible to a large proportion of the US population. Access to healthcare, a sleep specialist, or even a general health provider is unavailable for many. Symptom‐based screening offers an attractive alternative, given the risk of adverse cardiovascular outcomes associated with untreated OSA. According to these data, although approximately 19% of the overall population reported being uninsured, this number was disproportionately higher (45%) among Hispanic/Latino individuals. Therefore, PSG testing, case identification, initiation of treatment, and potential benefits of that treatment, including potential BP‐lowering effects, would be inaccessible to just less than half of the Hispanic/Latinos in this study. Implementing a simple tool such as pOSA, as well as exploring treatment options, is all the more critical in this ethno‐racial group given the current limitations in clinical application.
Limitations
We note several limitations and strengths of the current study. The cross‐sectional study design limits causal inference. Additionally, self‐reports may have introduced misclassification. We surmise that such misclassification would be nondifferential with respect to the presence of OSA, and so we expect that the utility of the pOSA score would be biased toward the null. We recognize that the prevalence of overweight and obese individuals in our sample was relatively high and that we did not have an even distribution of lower‐weight individuals. In an effort to address this issue, we presented all models stratified by BMI group in addition to the overall results. Residual confounding is also inherent in the observational study design; however, this robust dataset allows us to evaluate differences by race/ethnicity, an area of sleep research that remains under‐explored. We used a nationally representative sample, which has clear benefits in generalizability compared with prior studies that draw from specialized, clinic‐based cohorts. Finally, the tool we developed relies on simple symptoms of OSA, which are easily obtainable and feasible on a mass scale and were strongly associated with increased BP.
Conclusions
Symptom‐based identification of OSA is an important area for future prevention efforts, especially given the rising rates of obesity and sleep apnea. Symptoms had the strongest association with hypertension among overweight individuals, a group that deserves attention in prospective evaluations in the future. Future studies should also attempt to validate our sleep apnea assessment tool by conducting confirmatory sleep studies in a community‐based sample. Additionally, differences persisted by race/ethnicity groups, and further exploration of this association in studies that oversample for Hispanic/Latino and black/African American patients is warranted. Finally, prior studies have shown that PAP therapy yields greater BP reductions in some subgroups than others.8 Whether these differences are a function of race/ethnicity deserves investigation.
Disclosures
The authors report no specific funding in relation to this research and no conflicts of interest to disclose. With regards to grant funding, Dr Sands‐Lincoln is supported by NIH grant T32HL07713‐19; Dr Grandner was supported by the American Heart Association (12SDG9180007), the National Heart, Lung, and Blood Institute (K23HL110216), the National Institute for Environmental Health Sciences (R21ES022931), and a fellowship from the Institute for Translational Medicine and Therapeutics, funded by UL1RR024134 (Penn CTSA); and Dr Gurubhagavatula is funded by RO1‐OH009149.
Supporting information
Table S1. Demographic information stratified by race.
Table S2. Association between probable obstructive sleep apnea and hypertension stratified by race and body mass index group [see Figure 2].
Acknowledgments
We would like to thank the Centers for Disease Control and Prevention for collecting these data and making them available, as well as the NHANES participants.
J Clin Hypertens (Greenwich). 2013;15:593–599. ©2013 Wiley Periodicals, Inc.23889723
References
- 1. Young T, Palta M, Dempsey J, et al. The occurrence of sleep‐disordered breathing among middle‐aged adults. N Engl J Med. 1993;328:1230–1235. [DOI] [PubMed] [Google Scholar]
- 2. Punjabi NM. The epidemiology of adult obstructive sleep apnea. Proc Am Thorac Soc. 2008;5:136–143. [DOI] [PMC free article] [PubMed] [Google Scholar]
- 3. Somers VK, White DP, Amin R, et al. Sleep apnea and cardiovascular disease: an American Heart Association/American College of Cardiology Foundation Scientific Statement from the American Heart Association Council for High Blood Pressure Research Professional Education Committee, Council on Clinical Cardiology, Stroke Council, and Council on Cardiovascular Nursing. J Am Coll Cardiol. 2008;52:686–717. [DOI] [PubMed] [Google Scholar]
- 4. Young T, Skatrud J, Peppard PE. Risk factors for obstructive sleep apnea in adults. JAMA. 2004;291:2013–2016. [DOI] [PubMed] [Google Scholar]
- 5. Nieto FJ, Young TB, Lind BK, et al. Association of sleep‐disordered breathing, sleep apnea, and hypertension in a large community‐based study. Sleep Heart Health Study. JAMA. 2000;283:1829–1836. [DOI] [PubMed] [Google Scholar]
- 6. Peppard PE, Young T, Palta M, Skatrud J. Prospective study of the association between sleep‐disordered breathing and hypertension. N Engl J Med. 2000;342:1378–1384. [DOI] [PubMed] [Google Scholar]
- 7. Marin JM, Agusti A, Villar I, et al. Association between treated and untreated obstructive sleep apnea and risk of hypertension. JAMA. 2012;307:2169–2176. [DOI] [PMC free article] [PubMed] [Google Scholar]
- 8. Haentjens P, Van Meerhaeghe A, Moscariello A, et al. The impact of continuous positive airway pressure on blood pressure in patients with obstructive sleep apnea syndrome: evidence from a meta‐analysis of placebo‐controlled randomized trials. Arch Intern Med. 2007;167:757–764. [DOI] [PubMed] [Google Scholar]
- 9. Barbe F, Duran‐Cantolla J, Sanchez‐de‐la‐Torre M, et al. Effect of continuous positive airway pressure on the incidence of hypertension and cardiovascular events in nonsleepy patients with obstructive sleep apnea: a randomized controlled trial. JAMA. 2012;307:2161–2168. [DOI] [PubMed] [Google Scholar]
- 10. Lenfant C, Chobanian AV, Jones DW, et al. Seventh report of the Joint National Committee on the Prevention, Detection, Evaluation, and Treatment of High Blood Pressure (JNC 7): resetting the hypertension sails. Hypertension. 2003;41:1178–1179. [DOI] [PubMed] [Google Scholar]
- 11. Pack AI. Sleep‐disordered breathing: access is the issue. Am J Respir Crit Care Med. 2004;169:666–667. [DOI] [PubMed] [Google Scholar]
- 12. Schwartz AR, Patil SP, Laffan AM, et al. Obesity and obstructive sleep apnea: pathogenic mechanisms and therapeutic approaches. Proc Am Thorac Soc. 2008;5:185–192. [DOI] [PMC free article] [PubMed] [Google Scholar]
- 13. Maislin G, Pack AI, Kribbs NB, et al. A survey screen for prediction of apnea. Sleep. 1995;18:158–166. [DOI] [PubMed] [Google Scholar]
- 14. Valencia‐Flores M, Orea A, Castano VA, et al. Prevalence of sleep apnea and electrocardiographic disturbances in morbidly obese patients. Obes Res. 2000;8:262–269. [DOI] [PubMed] [Google Scholar]
- 15. Malhotra A, White DP. Obstructive sleep apnoea. Lancet. 2002;360:237–245. [DOI] [PubMed] [Google Scholar]
- 16. Kump K, Whalen C, Tishler PV, et al. Assessment of the validity and utility of a sleep‐symptom questionnaire. Am J Respir Crit Care Med. 1994;150:735–741. [DOI] [PubMed] [Google Scholar]
- 17. Bearpark H, Elliott L, Grunstein R, et al. Snoring and sleep apnea. A population study in Australian men. Am J Respir Crit Care Med. 1995;151:1459–1465. [DOI] [PubMed] [Google Scholar]
- 18. Collop NA. Obstructive sleep apnea syndromes. Semin Respir Crit Care Med. 2005;26:13–24. [DOI] [PubMed] [Google Scholar]
- 19. Morris LG, Kleinberger A, Lee KC, et al. Rapid risk stratification for obstructive sleep apnea, based on snoring severity and body mass index. Otolaryngol Head Neck Surg. 2008;139:615–618. [DOI] [PubMed] [Google Scholar]
- 20. Lindberg E, Janson C, Gislason T, et al. Snoring and hypertension: a 10 year follow‐up. Eur Respir J. 1998;11:884–889. [DOI] [PubMed] [Google Scholar]
- 21. Gislason T, Benediktsdottir B, Bjornsson JK, et al. Snoring, hypertension, and the sleep apnea syndrome. An epidemiologic survey of middle‐aged women. Chest. 1993;103:1147–1151. [DOI] [PubMed] [Google Scholar]
- 22. Gottlieb DJ, Redline S, Nieto FJ, et al. Association of usual sleep duration with hypertension: the Sleep Heart Health Study. Sleep. 2006;29:1009–1014. [DOI] [PubMed] [Google Scholar]
- 23. Redline S, Tishler PV, Hans MG, et al. Racial differences in sleep‐disordered breathing in African‐Americans and Caucasians. Am J Respir Crit Care Med. 1997;155:186–192. [DOI] [PubMed] [Google Scholar]
- 24. Shepertycky MR, Banno K, Kryger MH. Differences between men and women in the clinical presentation of patients diagnosed with obstructive sleep apnea syndrome. Sleep. 2005;28:309–314. [PubMed] [Google Scholar]
- 25. Dursunoglu N, Ozkurt S, Sarikaya S. Is the clinical presentation different between men and women admitting to the sleep laboratory? Sleep Breath. 2009;13:295–298. [DOI] [PubMed] [Google Scholar]
- 26. Koskenvuo M, Kaprio J, Telakivi T, et al. Snoring as a risk factor for ischaemic heart disease and stroke in men. Br Med J (Clin Res Ed). 1987;294:16–19. [DOI] [PMC free article] [PubMed] [Google Scholar]
- 27. National NCfHS, (NHANES) . HANES. http://www.cdc.gov/nchs/nhanes.htm. Accessed February 3, 2013.
- 28. Norton PG, Dunn EV. Snoring as a risk factor for disease: an epidemiological survey. Br Med J (Clin Res Ed). 1985;291:630–632. [DOI] [PMC free article] [PubMed] [Google Scholar]
- 29. Kroenke K, Spitzer RL, Williams JB. The PHQ‐9: validity of a brief depression severity measure. J Gen Intern Med. 2001;16:606–613. [DOI] [PMC free article] [PubMed] [Google Scholar]
- 30. Krishnan V, Patel SR. Sleep apnea and obesity. In: Shiromani P, Horvath T, Redline S, Van Cauter E, eds. Sleep Loss and Obesity. New York, NY: Springer, 2012:119–131. [Google Scholar]
- 31. Young T, Peppard P, Palta M, et al. Population‐based study of sleep‐disordered breathing as a risk factor for hypertension. Arch Intern Med. 1997;157:1746–1752. [PubMed] [Google Scholar]
- 32. Villaneuva AT, Buchanan PR, Yee BJ, Grunstein RR. Ethnicity and obstructive sleep apnoea. Sleep Med Rev. 2005;9:419–436. [DOI] [PubMed] [Google Scholar]
- 33. Peppard PE. Is obstructive sleep apnea a risk factor for hypertension?–differences between the Wisconsin Sleep Cohort and the Sleep Heart Health Study. J Clin Sleep Med. 2009;5:404–405. [PMC free article] [PubMed] [Google Scholar]
- 34. Ong KL, Cheung BM, Man YB, et al. Prevalence, awareness, treatment, and control of hypertension among United States adults 1999‐2004. Hypertension. 2007;49:69–75. [DOI] [PubMed] [Google Scholar]
- 35. Egan BM, Zhao Y, Axon RN. US trends in prevalence, awareness, treatment, and control of hypertension, 1988–2008. JAMA. 2010;303:2043–2050. [DOI] [PubMed] [Google Scholar]
- 36. Ostchega Y, Yoon SS, Hughes J, Louis T. Hypertension awareness, treatment, and control–continued disparities in adults: United States, 2005–2006. NCHS Data Brief. 2008;Jan;(3):1–8. [PubMed] [Google Scholar]
- 37. Kapsimalis F, Kryger M. Sleep breathing disorders in the U.S. female population. J Womens Health (Larchmt). 2009;18:1211–1219. [DOI] [PMC free article] [PubMed] [Google Scholar]
- 38. Sundquist J, Winkleby MA. Cardiovascular risk factors in Mexican American adults: a transcultural analysis of NHANES III, 1988–1994. Am J Public Health. 1999;89:723–730. [DOI] [PMC free article] [PubMed] [Google Scholar]
- 39. Goslar PW, Macera CA, Castellanos LG, et al. Blood pressure in Hispanic women: the role of diet, acculturation, and physical activity. Ethn Dis. 1997;7:106–113. [PubMed] [Google Scholar]
- 40. Crespo CJ, Loria CM, Burt VL. Hypertension and other cardiovascular disease risk factors among Mexican Americans, Cuban Americans, and Puerto Ricans from the Hispanic Health and Nutrition Examination Survey. Public Health Rep. 1996;111(suppl 2):7–10. [PMC free article] [PubMed] [Google Scholar]
- 41. O'Connor GT, Lind BK, Lee ET, et al. Variation in symptoms of sleep‐disordered breathing with race and ethnicity: the Sleep Heart Health Study. Sleep. 2003;26:74–79. [PubMed] [Google Scholar]
Associated Data
This section collects any data citations, data availability statements, or supplementary materials included in this article.
Supplementary Materials
Table S1. Demographic information stratified by race.
Table S2. Association between probable obstructive sleep apnea and hypertension stratified by race and body mass index group [see Figure 2].