

Abstract
Salient cues can prompt the rapid interruption of planned actions. It has been proposed that fast, reactive behavioral inhibition involves specific basal ganglia pathways, and we tested this by comparing activity in multiple rat basal ganglia structures during performance of a stop-signal task. Subthalamic nucleus (STN) neurons showed low-latency responses to Stop cues, irrespective of whether actions were successfully canceled or not. By contrast, neurons downstream in the substantia nigra pars reticulata (SNr) responded to Stop cues only in trials with successful cancellation. Recordings and simulations together indicate that this sensorimotor gating arises from the relative timing of two distinct inputs to neurons in the SNr dorsolateral “core” subregion: cue-related excitation from STN and movement-related inhibition from striatum. Our results support race models of action cancellation, with successful stopping requiring Stop cue information to be transmitted from STN to SNr before increased striatal input creates a point of no return.
The ability to suppress and cancel actions is a core component of cognitive control, and impairments in this ability contribute to impulsive and compulsive behaviors including drug addiction and attention-deficit hyperactivity disorder1-5. Action suppression is often assessed using the stop-signal task, which has been widely applied in both humans and experimental animals3,6-8. On most trials subjects are given a “Go” cue that prompts a specific, rapid movement. On the remaining trials the same Go cue is followed by a “Stop” signal indicating that they should cancel that movement before it begins. The interval between Go and Stop cues is adjusted so that subjects sometimes succeed in stopping, and sometimes fail. In general, stop-signal task performance is well described by theoretical models in which the Go and Stop cues respectively initiate stochastic Go and Stop processes that race for completion. The outcome of this race determines whether stopping is successful3,4.
Extensive evidence for basal ganglia involvement in action suppression comes from pharmacological manipulations9,10, lesions6,11, stimulation12,13, imaging1,14, and computational modeling2,15. It has been proposed that the conceptual race between Go and Stop processes corresponds to a literal race between distinct neural pathways1, converging on basal ganglia output nuclei that provide tonic inhibition of actions16,17. Specifically, striatal “direct” pathway neurons are thought to promote movements (“Go!”) by inhibiting SNr, while STN neurons serve as a brake on behavior (“Stop!”) by exciting the same SNr cells2,18 (Fig. 1a). Here we test this hypothesis by comparing the fine timing of Stop- and Go- related activity within each basal ganglia structure. Our results support the basic notion of a race between Go and Stop processes that initially evolve in separate neural circuits, while also providing evidence for multiple basal ganglia mechanisms in behavioral inhibition14,19.
Figure 1.
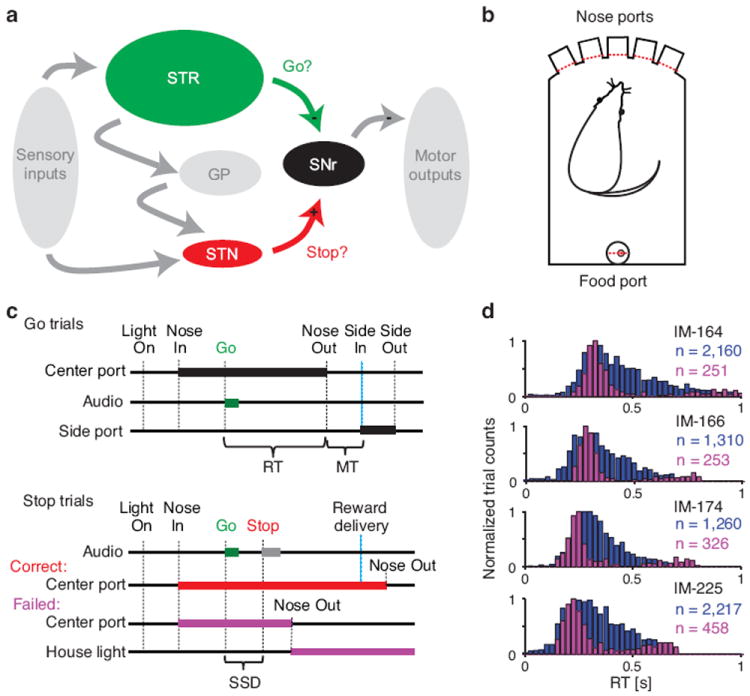
Task events and behavior. (a) Simplified scheme of neural circuitry under investigation during the stop-signal task. Projections from striatum (STR) and STN converge on SNr, which provides tonic inhibition of motor output. (b) Configuration of the operant chamber with five nose ports on one side and a food port on the opposite side. Entry into any port is detected by photodiode beam breaks (red dashes). (c) The task events in Go trials and Stop trials are shown in sequence from left to right. Thick bars indicate occurrence of sensory cues (‘Audio’ and ‘House light’) and rat position within center and side ports. The reaction time (RT) is measured between Go cue onset and movement onset (i.e. ‘Nose Out’ of the center port). Movement time (MT) is the time it takes the rat to go from the center port to the side port. In Stop trials, the stop-signal delay (SSD) is the time between the Go cue and Stop cue onsets. (d) Reaction time distributions for Experiment 1 (rats 10–13, top-bottom). Correct Go trials are shown in blue, and Failed Stop trials in purple. Note that Failed Stop trials have similar reaction times to the faster part of the Go trial distribution.
RESULTS
To assess the correspondence between distinct basal ganglia pathways and hypothesized cognitive processes, we applied the high spatio-temporal resolution of single-unit electrophysiology to a stop-signal task based around our prior studies of rodent decision-making20,21 (Fig. 1, Table S1). Each rat was trained to place its nose in a central port until the onset of a Go cue (1kHz or 4kHz tone) that directed a brief lateral head movement (to left or right; see Supplemental Movie). On 30% of trials the Go tone was followed by a Stop cue (white noise), instructing that the rat should stay in the central port (Fig. 1b,c). For both Go trials and Stop trials correct performance was rewarded by delivery of a sugar pellet. As typically observed for stop-signal tasks, reaction times for Failed Stop trials corresponded to the faster portion of the Go trial reaction time distribution (Fig. 1d). This is consistent with race models: when the Go process happens more quickly, a Stop process is less likely to successfully suppress behavior.
For our first set of recordings (Experiment 1), well-trained subjects (n=4) received tetrode implants that simultaneously targeted striatum, STN, globus pallidus (GP), and SNr (for further details see ref. 21). We isolated spikes from individual neurons during task performance, from each brain region (for anatomical locations see Fig. S1). A challenge when studying behavioral inhibition is to disentangle neural activity specifically linked to stopping, rather than going. To do this, we followed a latency matching procedure22,23 (see Methods), which exploits the similarity in reaction times -and thus presumably the Go process - between Failed Stop trials and Fast Go trials. We compared the firing rate of each neuron between these trial types, and between Correct Stop trials and Slow Go trials. We then assessed the fraction of each neuronal population that showed significant differences at each moment in time (Fig. 2a).
Figure 2.
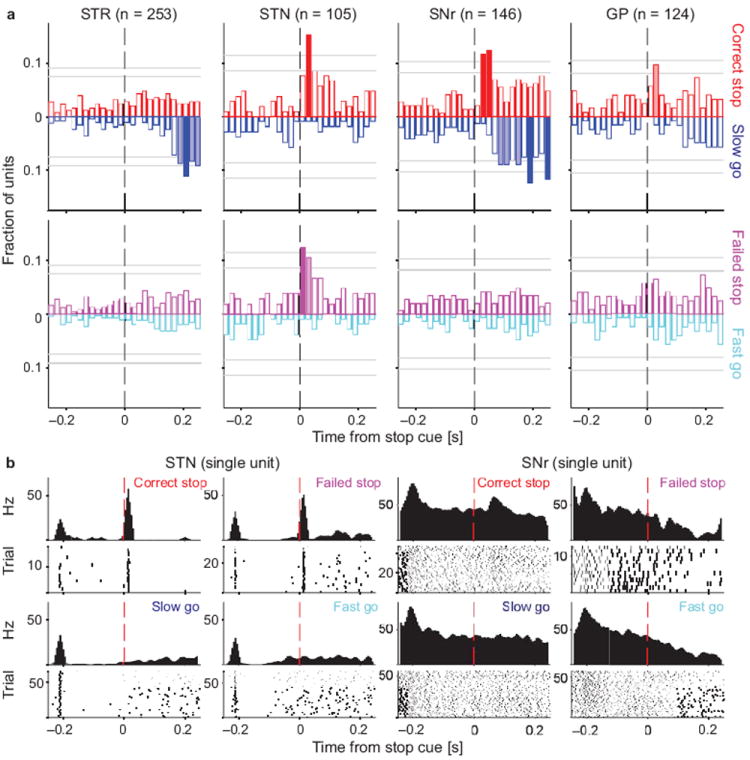
Distinct processing of the Stop cue across basal ganglia components. (a) For each brain area, bars indicate the fraction of neurons whose firing rate significantly differs between the trial types under comparison. To screen for Stop-related activity, we compared Correct Stop trials with Slow Go trials (top), and Failed Stop trials with Fast Go trials (bottom). For example, movement-related activity is very similar on Fast Go and Failed Stop trials, so it does not show up in this comparison. Activity is aligned on Stop cue onset (or for Go trials, the point at which the Stop signal would have been presented had it been a Stop trial). Upwards bars denote the fraction of units that fired more on Stop trials; downward bars denote the fraction of units that fired more on Go trials. Filled bars indicate times when this fraction significantly exceeded chance level (binomial test; p < 0.05 with pale bars uncorrected and dark bars corrected for multiple comparisons; horizontal grey lines mark respective significance thresholds). All data shown are for contralateral Stop and Go trials (see Fig. S2 for ipsilateral trials and for a direct comparison of Correct and Failed Stop trials). (b) Illustrative examples of individual neuron activity in STN and SNr during Go trials in the four relevant trial types as indicated (both ipsi- and contralateral movements are shown). The STN unit showed a fast, transient increase in activity after the Stop cue in both Correct and Failed Stop trials. On Correct Stop trials the SNr unit also showed a fast increase in firing, and no movement-linked pause. By contrast, on Failed Stop trials the SNr unit simply showed a movement-linked decrease in firing rate and no response to the Stop cue, very similar to Fast Go trials.
Striatal neurons showed little or no fast population-level response to Stop cues. In contrast, both STN and SNr contained a significant proportion of neurons with rapid responses to the Stop signal (Fig. 2a, red and purple filled bars). For STN, this population response was the same for Correct and Failed Stop trials (for the two STN bins just after Stop cue onset, p = 0.17 and 0.21, shuffle test) and thus resembled a fast “sensory”-like response to the Stop cue (see Fig. 2b for a representative single unit example). Strikingly however, for SNr this fast change in activity was only observed for Correct, rather than Failed Stop trials (for the two filled red SNr bins, p = 0.008 and 0.005, shuffle test; see also Fig. 2b for a single unit example and Fig. S3 for a direct comparison between Correct and Failed Stop trials). Thus, while the activity in STN was consistent with a sensory response, activity in SNr instead reflected the behavioral outcome on each trial.
Our GP recordings did not yield such unambiguous results. Although the initial screen indicated that some neurons may selectively respond for Correct Stops (Fig. 2a), the direct comparison did not confirm a selective GP response in Correct, rather than Failed Stop trials (Fig. S3). We therefore focus on STN and SNr below.
We next examined the time course of activity in these Stop-related STN and SNr neurons. STN neurons responded to the Stop cue onset with transiently increased firing (Fig. 3a), that in some cases took the form of just a single, precisely timed extra spike (Fig. 2b). These STN increases had consistently very low latencies (peak response ~15 ms; Fig. 3b; see ref. 24 for similarly low STN latencies) that were not different between Correct and Failed Stop trials (p = 0.41, paired t-test; Fig. 3b). The magnitude of the peak STN response also showed no systematic population preference for Correct versus Failed Stop trials (Fig. 3c). SNr neurons also increased firing to the Stop cue (Fig. 3a), but with a longer latency (peak response ~36ms; Fig. 3b; p = 0.004 comparing STN to SNr latencies, one-sided Kolmogorov-Smirnov test) and preferentially on Correct Stop trials (Fig. 3c). This latency difference was seen even when the analysis was restricted to units recorded in the same session (n = 15 pairs; STN cells preceded SNr cells by an average of 13.6 ms, p = 0.041, shuffling statistic). All SNr neurons that responded to the Stop cue on Correct trials did so before the Stop-Signal Reaction Time (SSRT; grey lines in Fig. 3a), a standard, inferred behavioral measure for how quick a process must be to influence stopping performance3,4,7. Thus, SNr activity not only distinguishes between Correct and Failed Stop trials, it does so quickly enough to affect the trial outcome.
Figure 3.
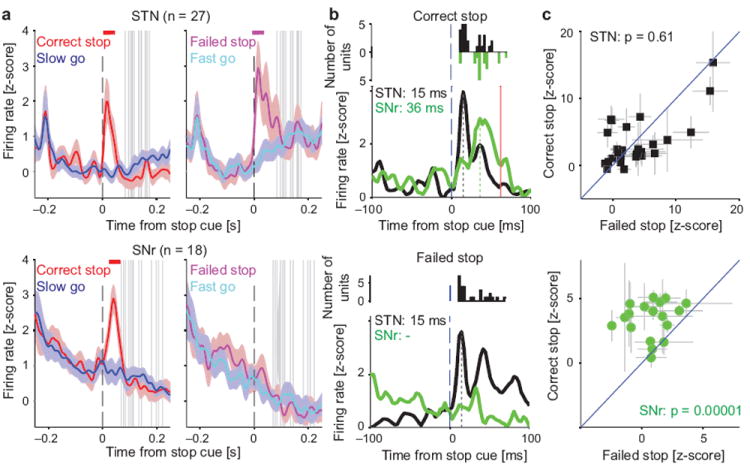
Stop cues increase firing in STN before SNr. (a) Firing rate time courses for the neuronal subpopulations that distinguish Stop from Go trials (in contralateral trials; see Fig. 2 and Methods). In each case colored lines show the mean (± s.e.m.) z-score of the firing rate across units (rat breakdown: 11 and 16 STN units from rats 10,11 respectively; 14, 2, and 2 SNr units from rats 10, 12, 13 respectively; see Table S1). Horizontal colored bars at the top of each panel indicate times with significantly different Stop vs Go firing rates (shuffle test, p < 0.05, corrected for multiple comparisons). Vertical grey bars show SSRTs for the corresponding recording sessions. (b) Comparison of Stop cue response latencies for the same STN (black) and SNr (green) units (top, Correct Stop trials; bottom, Failed Stop trials). To aid comparison, baselines are shifted so that lowest activity is in all cases at zero. Vertical dashed lines indicate latency of peak response (STN 15 ms; SNr 36 ms); red line marks shortest SSRT. Inset panels give distributions of single unit response latencies. (c) Peak Stop cue response amplitudes for individual neurons in Correct versus Failed Stop trials (top STN; bottom SNr; grey lines ± s.e.m.). Shown p-values were derived from shuffle tests.
Most of the SNr units with fast Stop cue responses (10/18) also markedly decreased their activity beginning just before movement initiation (Fig. S3). This suggests that the Stop cue may not alter SNr activity globally, but rather have a selective influence over cells and subregions involved in controlling the specific movement that needs to be inhibited. We therefore performed a second set of recordings (Experiment 2) using both high-density silicon probes (n = 3 rats, Fig. 4a) and more tetrodes (n = 2 rats) to target a wide range of SNr locations. Combining all SNr results together revealed a clear “hotspot” of SNr cells that fired significantly more on Correct than on Failed Stop trials, briefly after the Stop cue (Figs. 4, S4a–d). This hotspot corresponds remarkably well to to the SNr sensorimotor “core” subregion described in anatomical studies25, located dorsolaterally and extended along the rostral-caudal axis. This subregion projects to specific parts of the superior colliculus involved in orienting movements25,26, so the Stop signal influences activity in an SNr subregion that is likely critical for exerting fast behavioral control27.
Figure 4.
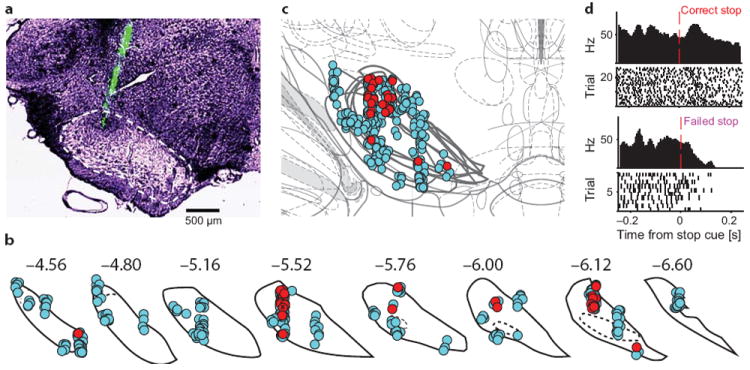
An SNr hotspot for Stop cue responses. (a) Example of a silicon probe recording from SNr. Tips of the 8 probe shanks were coated in DiO (green) for histological visualization. One tip is visible here (the others were more anterior and posterior). SNr boundary is marked with dashes. (b) Reconstructed locations of SNr single-units from all 9 rats, on SNr coronal atlas boundaries51. Neurons showing significant differences between Correct and Failed Stop trials (20–100ms after Stop cue in either ipsi- or contralateral trials) are shown in red, others in cyan. Numbers indicate approximate anterior/posterior coordinate relative to bregma. (c) Functional map obtained by stacking atlas sections. Note the dorsolateral cluster of outcome-dependent SNr units (10, 11, and 3 units from rats 11, 15, 18 respectively; see Tab. S1). This cluster was observed when either ipsi- or contralateral movements had to be stopped, and also in latency-matched control comparisons (Fig. S4a–d). (d) Representative unit from the hotspot (from rat 15, marked by small ‘x’ in b) showing similar activity patterns to SNr units from Experiment 1.
The distinct latencies of STN and SNr cue responses are consistent with Stop information being conveyed along the STN - SNr pathway. Yet, the selectivity of this transmission to Correct Stop trials suggests some form of gating mechanism. In other words: given that the glutamatergic STN cells spike on Failed Stop trials, why are SNr neurons not responsive to this input? The answer may lie in the movement-related firing rate decreases of SNr neurons (Figs. S3 and S4e,f). Such SNr firing pauses are well-known from studies of eye and limb movements27,28, and are thought to facilitate action through disinhibition of superior colliculus and other structures more directly linked to motor output16,29. SNr pauses are driven by increased firing of the GABAergic striatal direct pathway neurons17,30, plausible participants in a Go process.
To assess how striatal neurons may contribute to movement preparation and initiation, we looked for units that distinguish movement direction before movement onset. We found an abrupt increase in contralateral coding starting ~140ms before movements (arrow in Fig. 5a, right). When we compared the activity of these direction-selective striatal cells (n = 74) between different trial types, we observed a rapid acceleration of firing rate just before movement onset31 (Fig. 5b, right), that followed the same trajectory for Fast Go, Slow Go and Failed Stop trials. Aligned on the earlier Go cue, this striatal activity remained very similar between Fast Go and Failed Stop trials, but distinct to Slow Go and Correct Stop trials (Fig. 5b, left).
Figure 5.
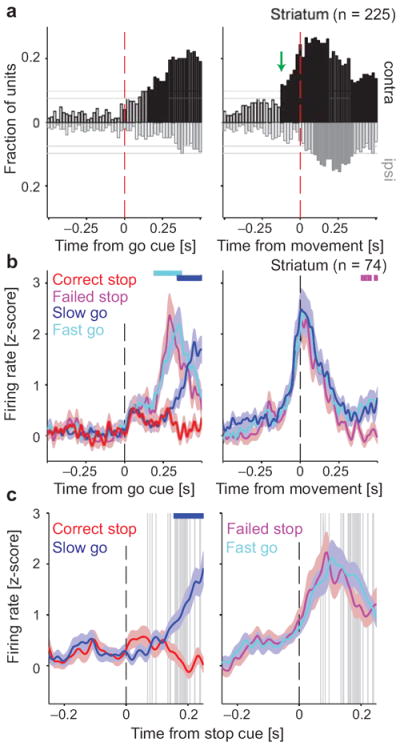
Variable timing of a striatal Go process critically determines whether stopping is successful. (a) Fractions of striatal units distinguishing between contra- and ipsilateral movements, at each time point during Go trials. Layout is as Fig. 2. On right, the black solid bars before the red dashed line indicate significant coding of movement direction before movement onset. The 74 units that contributed to these bars were considered potential contributors to a Go process (rat breakdown: 5, 23, 11, and 35 units from rats 10–13, respectively; see Tab. S1). For corresponding analysis of other brain regions, see Fig. S5. (b) Mean (± s.e.m.) firing rate z-score for these 74 striatal units (see Fig. S6 for activity separated by cell type). Cyan bar at the top indicates times with significantly different firing rates on Fast vs. Slow Go trials, blue bar indicates the same for Slow Go vs. Correct Stop trials, and purple bar for Fast Go vs. Failed Stop trials (shuffle test, p < 0.05, corrected for multiple comparisons). (c) Activity of the same striatal units aligned to the Stop cue. Note the different time scale than in (b). Format is as Fig. 3a.
These results fit well with a simple race model, in which variability in the timing of a striatal-based Go process determines the outcome on Stop trials. On Failed Stop trials, movement-related striatal activity has already begun to increase by the time of Stop cue onset (Figs. 5c, S6). This effect was particularly pronounced when examining individual presumed striatal projection neurons (Fig. S6b). Therefore, the lack of SNr responses to the Stop cue on Failed Stop trials may be due to the early arrival of striatal GABAergic input, shunting away the effects of glutamatergic inputs from STN.
To confirm the viability of this idea we studied gating of the Stop cue responses in a simple integrate-and-fire model of an SNr neuron. This neuron received excitatory pulses, mimicking STN sensory responses to Stop cues, and (as in prior basal ganglia models32,33) this excitatory input was influenced by GABAergic inhibition34,35 (see Methods). For GABAergic input we used the average striatal population activity during movement initiation (Fig. 5b) to approximate real input patterns. We adjusted synaptic strengths of inhibitory and excitatory inputs to provide a good qualitative match with the cue-evoked increases and movement-related decreases in SNr firing.
A critical parameter in the model is the relative timing of excitation and inhibition. We define Δ as the interval between Stop cue onset and the point in the striatal output at which movements begin on Go trials. If the Stop cue begins long before movement onset (Fig. 6a; Δ = 200ms), striatal inhibition is low at that time and the Stop cue evokes a full response in the SNr cell. By contrast, if the Stop cue occurs only briefly before movement onset (Fig. 6a; Δ = 50ms), a high level of striatal inhibition suppresses the SNr cue response. A systematic variation of Δ in the behaviorally relevant range yielded a gating curve that quantified the model response to the Stop cue (Fig. 6b,c). The gating phenomenon required strong divisive inhibition, e.g. through shunting inhibition, rather than simple summation of inhibitory and excitatory conductances (Fig. 6c, right). We then used the behavioral data of each rat to estimate the actual distribution of Δ for both Correct and Failed Stop trials (Fig. S7). These Δ distributions could then be used to calculate model firing rates for these trial types (Fig. 6d). Importantly, just as in real rat SNr cells, the model SNr cell selectively responded to the Stop cue in Correct but not Failed Stop trials. We conclude that the integration of distinct excitatory and inhibitory synaptic inputs by individual SNr neurons provides a straightforward, mechanistic account of how Go and Stop processes can “race” within the brain.
Figure 6.
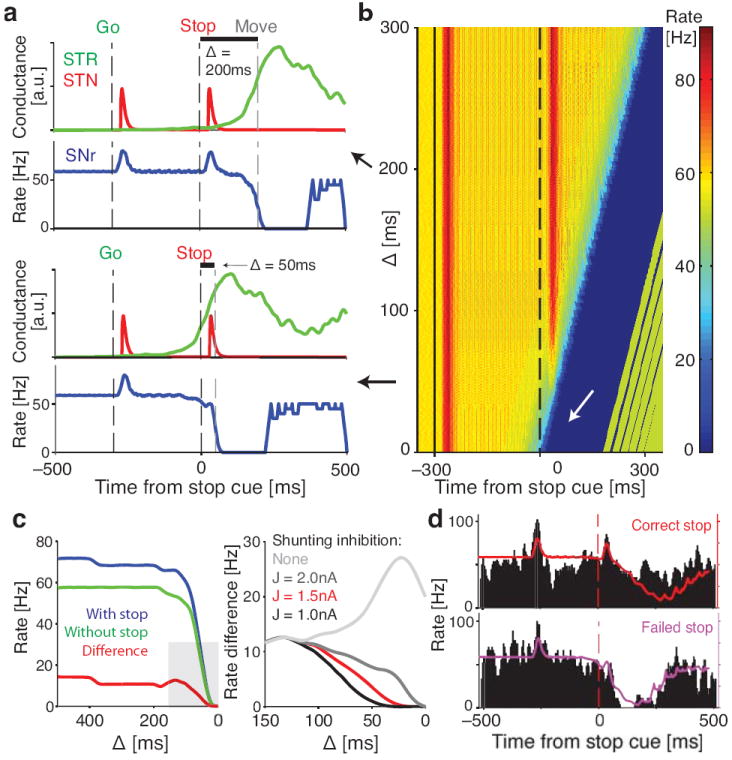
Modeling sensorimotor gating in SNr neurons. (a) Model responses for two illustrative values of Δ, the interval between Stop cue and Move onset. Red and green lines indicate STN and striatal (STR) inputs to the SNr model, and blue line shows the output firing rate of the model SNr cell. Note the clear SNr response to the Stop cue with Δ = 200ms, but not with Δ = 50ms. (b) SNr model responses to the Stop cue over a range of Δ. For small Δ, strong shunting inhibition from striatum prevents STN-evoked spiking to the Stop cue (white arrow). (c) (left) Comparison between model output with and without Stop cue, measured in the 50 ms after STN input reaches SNr. (right) Enlarged view of the grey area, for the range of Δ where Stop cue gating occurs. Red line is the same as on the left panel, other lines show the effects of different levels of shunting inhibition. In all cases the lines indicate the difference between model SNr firing rate with and without the Stop cue. Note that without shunting inhibition the model does not gate the Stop cue as observed in the experimental SNr data. (d) Model SNr output (colored lines) exhibits response to the Stop cue in Correct Stop trials (top) but not in Failed Stop trials (bottom). Failed and Correct Stop trials in the model are based on rat reaction time data (see Fig. S7). Black histogram shows one example rat SNr cell for qualitative comparison to the model. Note that in the model, increased firing to the Stop cue response was always followed by a movement-related decrease as, for simplicity, we did not incorporate our observation that striatal output is subsequently suppressed on Correct Stop trials (Fig. 5b,c; see Discussion).
DISCUSSION
Race models have been central to theories of action suppression for decades, yet clear evidence that they actually describe neural processes has been elusive. Here we have demonstrated that activity in two key basal ganglia pathways for action control closely resembles a race between Go and Stop processes. Individual SNr neurons show both movement-related pauses in firing (driven by striatum) and rapid firing rate increases following Stop cues (driven by STN), and the relative timing of these influences corresponds to whether stopping was successful. These SNr cells are located in a specific dorsolateral subregion, that in turn projects to collicular intermediate layers important for the control of orienting movements25,26. Furthermore, the evidence we found for shunting inhibition of STN inputs by striatal inputs begins to reveal how mechanisms operating within single cells can contribute to sensorimotor gating.
It is important to note that neurons in STN and SNr with fast Stop cue responses also increased spiking with the Go cue that instructed contralateral movement (Figs. S3, S4e,f and S5). Thus the STN-SNr pathway does not solely convey signals that instruct stopping, but also other task-relevant cues. The effect of both Go and Stop cues was to transiently increase firing of a population of SNr neurons that decrease firing with movement onset (Fig. S3). We found that trials in which STN and SNr responded more strongly to the Go cue had longer reaction times (Fig. S9), consistent with a role for STN-SNr transmission in delaying behavioral output2, rather than causing outright stopping (see below). A rapid, “automatic” inhibition of behavioral responses by task-relevant cues may help prevent responses that are impulsive or premature (i.e. when movement preparation is incomplete), and also explain why even cues that instruct subjects not to stop, but instead continue as planned, result in longer reaction times36. Further, our results contribute to the ongoing debate about whether certain brain areas contribute to action inhibition, versus cue-evoked reorienting of attention36-38, by indicating that these functions are not necessarily distinct.
The very low, fixed latency of cue-evoked activity in STN is informative in several ways. First, race models often incorporate variable timing of both Go and Stop processes, yet we found that the STN Stop cue response occurred at the same time in Correct and Failed Stop trials. Thus, if these responses are part of a Stop process, performance variability arises directly from the variable timing of the Go process (i.e. variable reaction times), at least in this version of the stop-signal task. This result is consistent with recent simulations of basal ganglia networks during inhibitory control39: STN provides the same fast signal to pause action, whether Stopping is actually successful or not.
Second, increased STN spiking within just 15 ms of cue onset constrains the sophistication of prior information processing, and which afferents can be driving this response. Recent human studies have emphasized the role of frontal cortical inputs to STN in action suppression1,14, but it is not clear that cue information can be passed quickly enough through cortex to cause this fast STN spiking. Our implementation of the stop-signal task encouraged very quick responses, and may have increased the importance of subcortical pathways that support sensory processing and fast orienting-like movements. In particular, many neurons in the thalamic intralaminar complex (centromedian/parafascicular nuclei, CM/Pf) and pedunculopontine nucleus (PPN) have short-latency responses to salient auditory stimuli40,41 and project to a range of basal ganglia targets, including STN42,43. CM/Pf projections to striatum are important for behavioral switching and learning following unexpected cues44-46. We hypothesize that the STN responses we observed are one component of a broader “interrupt” system, mediated by CM/Pf and/or PPN, that coordinates a response to salient cues across multiple timescales using multiple pathways (Fig. S10). In this scheme, very fast yet transient excitation of STN and SNr serves to delay actions that are close to execution, similar to previous descriptions of STN “buying time” during decision-making47.
However, the STN-driven increase in SNr firing is highly transient; in our simulation it would delay, but not fully cancel, the striatum-driven decrease in firing that releases movements (Fig. 6e). We also found evidence that a second, slower mechanism may act within striatum to help shut down the Go process. Movementrelated striatal activity abruptly decreases in Correct Stop trials, compared to Slow Go trials (Fig. 5b,c and S6), and a similar suppression of contralateral-coding striatal activity was observed in an antisaccade task48. Such suppression of a Go process is a key feature of “interactive race” models of stop-signal performance4. Yet striatum-based processing by itself is unlikely to account for stop-signal performance, as the reduction in striatal output was not consistently before the SSRT (Fig. 5c). It thus appears that complementary mechanisms allow action suppression to be both fast (via STN) and selective (via striatum)19,39,48. Future studies will investigate how the striatal Go process is suppressed in correct Stop trials. Direct pathway neurons can be inhibited in many ways, and some (non-exclusive) possibilities include the influences of indirect pathway cells39,48,49 and cholinergic interneurons40,46.
We used a basic stop-signal task, designed to investigate “reactive” aspects of behavioral inhibition (responding to a Stop cue). This task does not assess all the complexities of behavioral inhibition, such as “proactive” components (i.e. preparedness to stop). It has been proposed that proactive inhibition involves yet another basal ganglia circuit, the indirect pathway from striatum50 through GP19. In follow-up studies we plan to investigate whether systematically varying preparedness to stop reveals a clear role for GP that was not apparent here.
Finally, we previously reported21 (using the Experiment 1 data) that salient task cues cause a rapid reset of beta oscillatory phase throughout the basal ganglia, whether or not the cues actually direct behavior on a given trial. By contrast, cue-induced increases in beta power only occur for cues that are “used” - for example, after the Stop cue on Correct but not Failed Stop trials. This distinction corresponds closely to the difference between STN and SNr described here: events that caused abrupt increases in STN firing also produced beta phase reset, while those events that additionally increased SNr firing subsequently produced beta power increases. Furthermore, there is evidence that other oscillatory frequencies such as delta/theta can influence the parameters of behavioral control, such as decision thresholds47. An important direction for future investigation will be to determine the mechanistic relationships between rapid firing rate changes and altered dynamic states within basal ganglia circuitry.
ONLINE METHODS
Experimental procedures
Behavioral electrophysiology methods have been previously described in detail20,21,52. All animal experiments were approved by the University of Michigan Committee for the Use and Care of Animals. Subjects were adult male Long-Evans rats, housed on a 12:12 reverse light:dark cycle and tested during the dark phase. Rats were housed in groups of 3–4 with moderate environmental enrichment (toys, variety of bedding, 59×39×20cm cages) during pre-surgical training, then singly-housed after surgery. The operant chamber had 5 nose-poke holes on one wall and a food dispenser on the opposite wall. At the start of each trial, one of the three more-central holes (chosen randomly) was illuminated, indicating that the rat should poke and hold its nose in that port. After a variable hold delay (500–1,200 ms), a tone (Go cue; 65 dB, 50 ms) instructed the rat to move promptly into the adjacent hole either to the left (1 kHz tone) or right (4 kHz tone); correct choices triggered immediate delivery of a sugar pellet reward (signaled by an audible click of the food dispenser). To encourage rats to respond quickly, on Go trials rats had to leave the initial port within a “limited hold” period, and then poke the adjacent hole within a “movement hold” (see Table S1). On Stop trials (30 %), the Go cue was followed after a short delay (the stop-signal delay, SSD) by a Stop cue (white noise burst, 65 dB, 125 ms). If the rat moved before the SSD, the Stop cue was not played and the trial was treated as a Go trial. To successfully complete a Stop trial, the rat had to maintain its nose in the initial port until the limited hold period would have expired on a Go trial. At that point, the audible click of the food dispenser signaled reward delivery. Errors of any type produced a time-out (houselight on, 8 s). Otherwise, the next trial was initiated after the rat obtained its reward. The computer-controlled sequence of trials was randomized and experimenters were blind to the trial sequence. However, to discourage the animal from adopting a holding-strategy without Go responses, the animal had to perform a correct Go trial before a Stop trial could occur. Other randomization or blinding procedures were not performed in this study.
After achieving stable task performance (typically ~2–3 months of training, > 70 % correct choices on Go trials) rats in Experiment 1 received implants containing 21 individually drivable tetrodes targeting basal ganglia structures (STR, GP, STN, and SNr), and recording sessions began approximately one week later. SSD was held constant within each recording session to facilitate electrophysiological analyses, but was adjusted between stop-signal sessions so that Correct and Failed Stop trials were approximately equal in number. On alternate days rats performed the stop-signal task and a go/nogo task, which was identical in most respects to the stop-signal task but with an SSD of zero (on NoGo trials the white noise was played instead of a Go cue). During task performance wide-band (1–9,000 Hz) brain signals were recorded continuously at 31.25 kHz. Tetrodes were usually moved by at least 80 μm between two stop-signal sessions. In some cases, (e.g. if the number of trials was low in one recording session), tetrodes were not moved between sessions, and we only included the better session in the analysis. Individual neurons were isolated offline using wavelet-based filtering52 followed by standard manual spike-sorting, and classification into different presumed cell types53. No statistical methods were used to pre-determine sample sizes.
Experiment 2 examined whether Stop responses are localized to a specific subregion of SNr. To facilitate a systematic functional mapping, three rats received 8-shank, 64-channel silicon probes (Neuronexus Inc.) into SNr. Silicon probe shanks were coated in the lipophilic dye DiO before implantation and not moved after initial surgery. For these fixed-location silicon probes we only included data from a single session per animal, to avoid including duplicate cells. Two further rats received similar tetrode implants as in Experiment 1.
Data analysis
All analyses were performed using custom MATLAB routines. Data distribution was not formally tested for normality, but we instead mostly used statistical methods that are robust for non-normal-distributed data (Kolmogoroy-Smirnov and shuffling tests). SSRTs were estimated for each session individually by the integration method54, as follows. First, we determined the fraction of Failed Stop trials f. Then we calculated the stopping time as the f-th percentile of the distribution of Go trial reaction times. The SSRT is then the stopping time minus the SSD (for further details see ref. 54). This SSRT value was also used to separate Go trials in the same session into “Fast Go” and “Slow Go”.
To examine the activity of each neuron we used 40 ms time bins (sliding in steps of 20 ms) to obtain spike count distributions for different trial types, near key task events. A neuron had to exceed a 3 Hz firing rate in at least one time bin to be included in subsequent analyses. To best isolate activity associated with Stop cues, we compared trial types for which the activity associated with movement preparation is most similar. That is, we compared Failed Stop trials with Fast Go trials, and Correct Stop trials with Slow Go trials22,23 (latency-matching). For Stop trials neural activity was aligned to the onset of the Stop cue, and for Go trials we used the time at which the Stop signal would have occurred, i.e. Go cue onset + SSD. For a few Failed Stop trials reaction times were very long (Fig. 1d). We interpreted these as trials for the initial stopping was actually successful, but subsequent holding on for reward was not (both spike and LFP measures were consistent with this interpretation; data not shown). We therefore excluded Failed Stop trials with reaction times > 500 ms from all analyses.
To compare whether spike rates were different between two trial types, we used a shuffle test for each time bin. We shuffled the trial type labels 10,000 times, and for each shuffle we compared the means of the two resulting spike count distributions. To yield a p-value we determined the fraction of shuffles in which the difference between the shuffled means was larger (or smaller) than the difference between the two actually observed means. We used a p-value of 0.05 to determine significant coding of trial types. It follows that 5 % of a population of randomly active units should, on average, be classified as “coding” (all false positives). A binomial test was then used to determine whether the empirically measured fraction of coding units was significantly higher than that expected by chance. We corrected for multiple testing with respect to the overall time-window around task events (e.g. for Fig. 2, each single test was done for a 40 ms time-window, yielding 500/40 independent tests around the task events). This correction is overly conservative for some key time points of interest, since we hypothesized a priori that firing-rates would change shortly after cue onset. Therefore we also (in Fig. 2a) indicate times when the p-value was below 0.05 without adjusting for multiple comparisons.
The analyses shown in Fig. 3 include only STN and SNr units identified as “Stop-related” (in the screen shown in Fig. 2a). For STN we included units that contributed to the significant responses in either correct or Failed Stop trials (i.e. the filled red and magenta bars for STN in Fig. 2a). As the overall population of SNr units did not reach significance in Failed Stop trials, we included those individual SNr units that only contributed to the significant Stop cue response in Correct Stop trials (i.e. the filled red bars for SNr in Fig. 2a). The firing rate time course of each unit was then estimated by averaging spike counts over trials of the same type (e.g. Failed Stop-right trials) with a sliding 20 ms window in steps of 5 ms around important task events (e.g. the Stop cue; Fig. 4a), and then smoothing with a 3-point average. To compare mean firing rate time courses between trial types, activity of each unit was first transformed to z-scores using the mean and standard deviation of session-wide firing rate estimates (obtained from 1 s wide windows). To compare the magnitude of the Stop response between Correct and Failed Stop trials (Fig. 3c), we used peak firing rates in the range 10–70 ms after Stop cue onset. To more precisely identify the times at which STN and SNr neurons responded to the Stop cue (Fig. 3b), we used non-overlapping 3 ms time windows smoothed with a 3-point average for the firing rate estimation. The latency was taken as the time of peak firing within the range 10–70 ms after Stop cue onset. Units were marked in red (in Figs. 4 and S4a–d) if the corresponding trial types were significantly different in at least two out three bins (each bin 40 ms wide, centered at 40, 60 and 80 ms after the Stop cue). For Fig. 4 we compared trial types separately for ipsi- and contralateral conditions and marked units red if in one or both cases the activity differences were significant. Similarly, in Fig. S2b, a unit is counted in the histogram if it exhibits a significant difference in activity between Failed and Correct Stop trials for ipsi- or contralateral trials.
Computational Modeling
To describe the gating of the Stop cue response, we implemented an integrate-and-fire model of a single SNr cell. Changes in the membrane potential V at time t were given by46: , where τm is the membrane time constant, Em the membrane resting potential, and rm the membrane input resistance. I is a sum of currents: I(t) = Ib(t) + ISTR(t) + ISTN(t). The current Ib was used to mimic the high spontaneous activity observed in SNr cells: Ib(t) = gb (V(t) − Eb) (see below for parameter settings)32,55. Synaptic input from the striatum was summarized by ISTR(t) = gSTR(t)(V(t) − ESTR). The time-dependent synaptic conductance gSTR(t) was modeled using the activity a(t) of Go-related striatal cells during movement initiation shown in Fig. 5b (right panel), averaged over slow and Fast Go trials, as . The scaling factor controls the movement-related decrease in our model SNr cell and was fitted to reproduce the average time course in Fig. S4. This provided an important constraint on the overall strength of striatal inhibition. Although further increases in striatal input strength could block STN inputs without the need for shunting inhibition, this change also produced too early a pause in SNr firing (i.e. a mismatch with the timing of striatal and SNr changes observed in vivo). The sum is over previous activity in the current trial (starting 500ms before movement onset) and is used as a simplified description of facilitation found at striatonigral synapses56. In our model this facilitation effectively lead to a broader peak of the striatal activity ramp and thereby to a broader pause in SNr activity, as we observed in the experimental data. Although real SNr neurons pause at a range of times relative to movement onset (Fig. S3 and ref. 29), for our simple model we used a fixed striatal input time course. We further assumed that STN input to SNr consisted of a single spike at time ts evoked by the Go or Stop cue (see STN example cell in Fig. 2b). Each spike gave rise to a modulated alpha function55 yielding a synaptic current ISTN (t) = h(t) (t,ts)(V(t) − ESTN) with a scaling factor ν and a shunting factor h(t). The scaling factor ν controls the amplitude of the SNr response to the STN input. We choose ν to fit the amplitude of SNr responses to the Go cue. Due to the high baseline activity in SNr mediated by Ib, in some trials STN inputs can shift the spike timing rather than increase the SNr firing rate. When the SNr baseline activity is diminished by inhibitory input, this effect is reduced so that STN input becomes more likely to evoke an SNr spike (see grey line in Fig. 6c, right). The alpha function was zero for t < 0 and otherwise defined as (t,ts) = exp(−(t − ts) /q) − exp(−(t − ts) /0.25q) with a time constant q. The shunting factor h(t) takes values between zero and one depending on the amount of inhibitory current32,33: , where Θ denotes the Heaviside step function. The reference current J controls the efficacy of the shunting inhibition (Fig. 6c).
A spike was generated by the model SNr cell if V(t) reached the threshold voltage Vthr = −50mV. After one millisecond, V(t) was then reset to the equilibrium membrane potential Em = −80 mV. Other parameter values were τm=20 ms; rm = 10MΩ; gb = 0.095μS; Eb = 0 mV; ESTR = −100mV ; ESTN = 0 mV; η = 1/1200; ν = 0.1; q = 10ms; and J = 1, 1.5, and 2 nA for “strong”, “medium” and “weak” shunting inhibition, respectively. Further, complex effects on synaptic integration of GABAA were neglected in our model as for simplicity we set ESTR < Em. However, we performed additional simulations with more realistic values for shunting inhibition where Em < ESTR < Vthr. With appropriately rescaled values for η and J the results remained the same. Therefore, the key feature of inhibition was the divisive ‘vetoing’ effect34,35 on excitatory STN input. For the simulation without shunting inhibition h(t) was always set to one.
In the model we kept the SSD constant at 300 ms, and assumed that STN input reached SNr starting 30 ms after Stop cue onset. The SNr response to the Stop cue was measured as the firing rate within the subsequent 50 ms time window. The interval Δ between movement onset and Stop cue presentation was varied in 1 ms time steps, over the range 0 – 500 ms. For each Δ, 500 trials with and 500 trials without Stop cue were simulated and the average firing rates were then used for the results.
To obtain SNr output for Failed Stop trials, we used the behavioral data of the rats. From the measured reaction times of Failed Stop trials we subtracted the SSD for that session. The resulting distribution of stop-aligned reaction times (Fig. S7) was used as the model parameter Δ for Failed Stop trials.
For Correct Stop trials, no direct reaction time measure is available. However, employing the reaction time distribution on Go trials, it is possible to estimate what the reaction time would have been if the Stop cue had not been presented. More formally, for each rat we have an empirically measured reaction time distribution for Go trials Fgo(t) = P(RT = t), with P denoting probability and RT being stop-aligned reaction times in 50 ms wide bins. With the corresponding probability distribution for Failed Stop trials FfS, the hypothetical distribution of Correct Stop reaction times was estimated as: , where p denotes the overall probability of failing to stop (number of Failed Stop trials divided by the number of Stop trials). Due to noise in the behavioral data in a few cases the estimates of FCS were negative, so we applied a lower bound for FCS(t) of zero and rescaled the whole probability distribution to maintain a total probability of one. The resulting estimates of FCS were then used as the distribution of Δ for Correct Stop trials.
Supplementary Material
Acknowledgments
We thank Veit Stuphorn, Daniel Weissman, Adam Aron, Genela Morris, Mark Churchland, Mark Bevan and David Meyer for their useful comments on earlier versions of this manuscript. Valuable assistance was provided by Jeffrey Pettibone and Alaina Case. This work was supported by DFG-grant SCHM 2745/1-1, the US National Institute on Drug Abuse, and the University of Michigan.
Footnotes
AUTHOR CONTRIBUTIONS
J.B. designed and oversaw the project. D.L. helped develop the behavioral task. D.L, N.M. and F.C. performed electrophysiological experiments. R.S. developed and performed the data analyses and computational modeling. R.S. and J.B. wrote the manuscript.
The authors declare no competing financial interests.
References
- 1.Aron AR, Poldrack RA. Cortical and subcortical contributions to Stop signal response inhibition: role of the subthalamic nucleus. J Neurosci. 2006;26:2424–2433. doi: 10.1523/JNEUROSCI.4682-05.2006. [DOI] [PMC free article] [PubMed] [Google Scholar]
- 2.Frank MJ. Hold your horses: A dynamic computational role for the subthalamic nucleus in decision making. Neural Networks. 2006;19:1120–1136. doi: 10.1016/j.neunet.2006.03.006. [DOI] [PubMed] [Google Scholar]
- 3.Logan GD, Cowan WB, Davis KA. On the ability to inhibit simple and choice reaction time responses: a model and a method. J Exp Psychol Hum Percept Perform. 1984;10:276–291. doi: 10.1037//0096-1523.10.2.276. [DOI] [PubMed] [Google Scholar]
- 4.Boucher L, Palmeri TJ, Logan GD, Schall JD. Inhibitory control in mind and brain: An interactive race model of countermanding Saccades. Psychol Rev. 2007;114:376–397. doi: 10.1037/0033-295X.114.2.376. [DOI] [PubMed] [Google Scholar]
- 5.Robbins TW, Gillan CM, Smith DG, de Wit S, Ersche KD. Neurocognitive endophenotypes of impulsivity and compulsivity: towards dimensional psychiatry. Trends Cogn Sci. 2012;16:81–91. doi: 10.1016/J.Tics.2011.11.009. [DOI] [PubMed] [Google Scholar]
- 6.Eagle DM, et al. Stop-signal reaction-time task performance: role of prefrontal cortex and subthalamic nucleus. Cereb Cortex. 2008;18:178–188. doi: 10.1093/cercor/bhm044. [DOI] [PubMed] [Google Scholar]
- 7.Hanes DP, Schall JD. Neural control of voluntary movement initiation. Science. 1996;274:427–430. doi: 10.1126/science.274.5286.427. [DOI] [PubMed] [Google Scholar]
- 8.Osman A, Kornblum S, Meyer DE. The Point-of-No-Return in Choice Reaction-Time - Controlled and Ballistic Stages of Response Preparation. J Exp Psychol Human. 1986;12:243–258. doi: 10.1037//0096-1523.12.3.243. [DOI] [PubMed] [Google Scholar]
- 9.Hikosaka O, Wurtz RH. Effects on Eye-Movements of a Gaba Agonist and Antagonist Injected into Monkey Superior Colliculus. Brain Res. 1983;272:368–372. doi: 10.1016/0006-8993(83)90586-3. [DOI] [PubMed] [Google Scholar]
- 10.Baunez C, et al. Effects of STN lesions on simple vs choice reaction time tasks in the rat: preserved motor readiness, but impaired response selection. Eur J Neurosci. 2001;13:1609–1616. doi: 10.1046/j.0953-816x.2001.01521.x. [DOI] [PubMed] [Google Scholar]
- 11.Bergman H, Wichmann T, DeLong MR. Reversal of experimental parkinsonism by lesions of the subthalamic nucleus. Science. 1990;249:1436–1438. doi: 10.1126/science.2402638. [DOI] [PubMed] [Google Scholar]
- 12.Ballanger B, et al. Stimulation of the subthalamic nucleus and impulsivity: release your horses. Ann Neurol. 2009;66:817–824. doi: 10.1002/ana.21795. [DOI] [PMC free article] [PubMed] [Google Scholar]
- 13.Majid DS, Cai W, George JS, Verbruggen F, Aron AR. Transcranial Magnetic Stimulation Reveals Dissociable Mechanisms for Global Versus Selective Corticomotor Suppression Underlying the Stopping of Action. Cereb Cortex. 2011 doi: 10.1093/cercor/bhr112. [DOI] [PMC free article] [PubMed] [Google Scholar]
- 14.Jahfari S, et al. Effective Connectivity Reveals Important Roles for Both the Hyperdirect (Fronto-Subthalamic) and the Indirect (Fronto-Striatal-Pallidal) Fronto-Basal Ganglia Pathways during Response Inhibition. J Neurosci. 2011;31:6891–6899. doi: 10.1523/JNEUROSCI.5253-10.2011. [DOI] [PMC free article] [PubMed] [Google Scholar]
- 15.Frank MJ, Samanta J, Moustafa AA, Sherman SJ. Hold your horses: Impulsivity, deep brain stimulation, and medication in parkinsonism. Science. 2007;318:1309–1312. doi: 10.1126/science.1146157. [DOI] [PubMed] [Google Scholar]
- 16.Hikosaka O, Wurtz RH. Visual and oculomotor functions of monkey substantia nigra pars reticulata. I. Relation of visual and auditory responses to saccades. J Neurophysiol. 1983;49:1230–1253. doi: 10.1152/jn.1983.49.5.1230. [DOI] [PubMed] [Google Scholar]
- 17.Kravitz AV, et al. Regulation of parkinsonian motor behaviours by optogenetic control of basal ganglia circuitry. Nature. 2010;466:622–626. doi: 10.1038/nature09159. [DOI] [PMC free article] [PubMed] [Google Scholar]
- 18.Bevan MD, Bolam JP, Crossman AR. Convergent synaptic input from the neostriatum and the subthalamus onto identified nigrothalamic neurons in the rat. Eur J Neurosci. 1994;6:320–334. doi: 10.1111/j.1460-9568.1994.tb00275.x. [DOI] [PubMed] [Google Scholar]
- 19.Aron AR. From reactive to proactive and selective control: developing a richer model for stopping inappropriate responses. Biol Psychiatry. 2011;69:e55–68. doi: 10.1016/j.biopsych.2010.07.024. [DOI] [PMC free article] [PubMed] [Google Scholar]
- 20.Gage GJ, Stoetzner CR, Wiltschko AB, Berke JD. Selective activation of striatal fast-spiking interneurons during choice execution. Neuron. 2010;67:466–479. doi: 10.1016/j.neuron.2010.06.034. [DOI] [PMC free article] [PubMed] [Google Scholar]
- 21.Leventhal DL, et al. Basal Ganglia Beta Oscillations Accompany Cue Utilization. Neuron. 2012;73:523–536. doi: 10.1016/j.neuron.2011.11.032. [DOI] [PMC free article] [PubMed] [Google Scholar]
- 22.Stuphorn V, Brown JW, Schall JD. Role of Supplementary Eye Field in Saccade Initiation: Executive, Not Direct, Control. J Neurophysiol. 2010;103:801–816. doi: 10.1152/jn.00221.2009. [DOI] [PMC free article] [PubMed] [Google Scholar]
- 23.Brown JW, Hanes DP, Schall JD, Stuphorn V. Relation of frontal eye field activity to saccade initiation during a countermanding task. Exp Brain Res. 2008;190:135–151. doi: 10.1007/s00221-008-1455-0. [DOI] [PMC free article] [PubMed] [Google Scholar]
- 24.Cheruel F, Dormont JF, Farin D. Activity of neurons of the subthalamic nucleus in relation to motor performance in the cat. Exp Brain Res. 1996;108:206–220. doi: 10.1007/BF00228095. [DOI] [PubMed] [Google Scholar]
- 25.Deniau JM, Mailly P, Maurice N, Charpier S. The pars reticulata of the substantia nigra: a window to basal ganglia output. Prog Brain Res. 2007;160:151–172. doi: 10.1016/S0079-6123(06)60009-5. [DOI] [PubMed] [Google Scholar]
- 26.Pare M, Hanes DP. Controlled movement processing: superior colliculus activity associated with countermanded saccades. J Neurosci. 2003;23:6480–6489. doi: 10.1523/JNEUROSCI.23-16-06480.2003. [DOI] [PMC free article] [PubMed] [Google Scholar]
- 27.Handel A, Glimcher PW. Quantitative analysis of substantia nigra pars reticulata activity during a visually guided saccade task. J Neurophysiol. 1999;82:3458–3475. doi: 10.1152/jn.1999.82.6.3458. [DOI] [PubMed] [Google Scholar]
- 28.Schultz W. Activity of Pars Reticulata Neurons of Monkey Substantia-Nigra in Relation to Motor, Sensory, and Complex Events. J Neurophysiol. 1986;55:660–677. doi: 10.1152/jn.1986.55.4.660. [DOI] [PubMed] [Google Scholar]
- 29.Basso MA, Sommer MA. Exploring the Role of the Substantia Nigra Pars Reticulata in Eye Movements. Neuroscience. 2011;198:205–212. doi: 10.1016/J.Neuroscience.2011.08.026. [DOI] [PMC free article] [PubMed] [Google Scholar]
- 30.Albin RL, Young AB, Penney JB. The Functional-Anatomy of Basal Ganglia Disorders. Trends in Neurosciences. 1989;12:366–375. doi: 10.1016/0166-2236(89)90074-x. [DOI] [PubMed] [Google Scholar]
- 31.Lo CC, Wang XJ. Cortico-basal ganglia circuit mechanism for a decision threshold in reaction time tasks. Nat Neurosci. 2006;9:956–963. doi: 10.1038/nn1722. [DOI] [PubMed] [Google Scholar]
- 32.Humphries MD, Gurney KN. A pulsed neural network model of bursting in the basal ganglia. Neural Netw. 2001;14:845–863. doi: 10.1016/s0893-6080(01)00060-0. [DOI] [PubMed] [Google Scholar]
- 33.Humphries MD, Stewart RD, Gurney KN. A physiologically plausible model of action selection and oscillatory activity in the basal ganglia. J Neurosci. 2006;26:12921–12942. doi: 10.1523/JNEUROSCI.3486-06.2006. [DOI] [PMC free article] [PubMed] [Google Scholar]
- 34.Blomfield S. Arithmetical operations performed by nerve cells. Brain Res. 1974;69:115–124. doi: 10.1016/0006-8993(74)90375-8. [DOI] [PubMed] [Google Scholar]
- 35.Segev I. In: The handbook of brain theory and neural networks. Arbib Michael A., editor. MIT Press; 1998. pp. 282–289. [Google Scholar]
- 36.Sharp DJ, et al. Distinct frontal systems for response inhibition, attentional capture, and error processing. P Natl Acad Sci USA. 2010;107:6106–6111. doi: 10.1073/Pnas.1000175107. [DOI] [PMC free article] [PubMed] [Google Scholar]
- 37.Shulman GL, et al. Interaction of stimulus-driven reorienting and expectation in ventral and dorsal frontoparietal and basal ganglia-cortical networks. J Neurosci. 2009;29:4392–4407. doi: 10.1523/JNEUROSCI.5609-08.2009. [DOI] [PMC free article] [PubMed] [Google Scholar]
- 38.Levy BJ, Wagner AD. Cognitive control and right ventrolateral prefrontal cortex: reflexive reorienting, motor inhibition, and action updating. Ann N Y Acad Sci. 2011;1224:40–62. doi: 10.1111/j.1749-6632.2011.05958.x. [DOI] [PMC free article] [PubMed] [Google Scholar]
- 39.Wiecki TV, Frank MJ. A computational model of inhibitory control in frontal cortex and basal ganglia. Psychol Rev. 2013;120:329–355. doi: 10.1037/a0031542. [DOI] [PubMed] [Google Scholar]
- 40.Matsumoto N, Minamimoto T, Graybiel AM, Kimura M. Neurons in the thalamic CM-Pf complex supply striatal neurons with information about behaviorally significant sensory events. J Neurophysiol. 2001;85:960–976. doi: 10.1152/jn.2001.85.2.960. [DOI] [PubMed] [Google Scholar]
- 41.Pan WX, Hyland BI. Pedunculopontine tegmental nucleus controls conditioned responses of midbrain dopamine neurons in behaving rats. J Neurosci. 2005;25:4725–4732. doi: 10.1523/JNEUROSCI.0277-05.2005. [DOI] [PMC free article] [PubMed] [Google Scholar]
- 42.Deschenes M, Bourassa J, Doan VD, Parent A. A single-cell study of the axonal projections arising from the posterior intralaminar thalamic nuclei in the rat. Eur J Neurosci. 1996;8:329–343. doi: 10.1111/j.1460-9568.1996.tb01217.x. [DOI] [PubMed] [Google Scholar]
- 43.Kita T, Kita H. Cholinergic and non-cholinergic mesopontine tegmental neurons projecting to the subthalamic nucleus in the rat. Eur J Neurosci. 2011;33:433–443. doi: 10.1111/j.1460-9568.2010.07537.x. [DOI] [PMC free article] [PubMed] [Google Scholar]
- 44.Kimura M, Minamimoto T, Matsumoto N, Hori Y. Monitoring and switching of cortico-basal ganglia loop functions by the thalamo-striatal system. Neuroscience Research. 2004;48:355–360. doi: 10.1016/J.Neures.2003.12.002. [DOI] [PubMed] [Google Scholar]
- 45.McHaffie JG, Stanford TR, Stein BE, Coizet W, Redgrave P. Subcortical loops through the basal ganglia. Trends in Neurosciences. 2005;28:401–407. doi: 10.1016/J.Tins.2005.06.006. [DOI] [PubMed] [Google Scholar]
- 46.Ding JB, Guzman JN, Peterson JD, Goldberg JA, Surmeier DJ. Thalamic Gating of Corticostriatal Signaling by Cholinergic Interneurons. Neuron. 2010;67:294–307. doi: 10.1016/J.Neuron.2010.06.017. [DOI] [PMC free article] [PubMed] [Google Scholar]
- 47.Cavanagh JF, et al. Subthalamic nucleus stimulation reverses mediofrontal influence over decision threshold. Nat Neurosci. 2011 doi: 10.1038/nn.2925. [DOI] [PMC free article] [PubMed] [Google Scholar]
- 48.Watanabe M, Munoz DP. Neural correlates of conflict resolution between automatic and volitional actions by basal ganglia. Eur J Neurosci. 2009;30:2165–2176. doi: 10.1111/j.1460-9568.2009.06998.x. [DOI] [PubMed] [Google Scholar]
- 49.Cui G, et al. Concurrent activation of striatal direct and indirect pathways during action initiation. Nature. 2013;494:238–242. doi: 10.1038/nature11846. [DOI] [PMC free article] [PubMed] [Google Scholar]
- 50.Zandbelt BB, Vink M. On the Role of the Striatum in Response Inhibition. Plos One. 2010;5 doi: 10.1371/journal.pone.0013848. [DOI] [PMC free article] [PubMed] [Google Scholar]
- 51.Paxinos G, Watson C. The rat brain in stereotaxic coordinates. 5. Elsevier Academic Press; 2005. [Google Scholar]
- 52.Wiltschko AB, Gage GJ, Berke JD. Wavelet filtering before spike detection preserves waveform shape and enhances single-unit discrimination. J Neurosci Methods. 2008;173:34–40. doi: 10.1016/j.jneumeth.2008.05.016. [DOI] [PMC free article] [PubMed] [Google Scholar]
- 53.Berke JD. Uncoordinated firing rate changes of striatal fast-spiking interneurons during behavioral task performance. J Neurosci. 2008;28:10075–10080. doi: 10.1523/JNEUROSCI.2192-08.2008. [DOI] [PMC free article] [PubMed] [Google Scholar]
- 54.Verbruggen F, Logan GD. Models of response inhibition in the stop-signal and stop-change paradigms. Neurosci Biobehav R. 2009;33:647–661. doi: 10.1016/j.neubiorev.2008.08.014. [DOI] [PMC free article] [PubMed] [Google Scholar]
- 55.Gerstner W, Kistler WM. Spiking Neuron Models. Cambridge University Press; 2002. [Google Scholar]
- 56.Connelly WM, Schulz JM, Lees G, Reynolds JNJ. Differential Short-Term Plasticity at Convergent Inhibitory Synapses to the Substantia Nigra Pars Reticulata. J Neurosci. 2010;30:14854–14861. doi: 10.1523/Jneurosci.3895-10.2010. [DOI] [PMC free article] [PubMed] [Google Scholar]
Associated Data
This section collects any data citations, data availability statements, or supplementary materials included in this article.