

Abstract
Background Contributions of age-period-cohort effects to increases in BMI and overweight among Chinese adults must be resolved in order to design appropriate interventions. The objectives were to (i) describe the period effect on BMI and overweight among Chinese adults from 1991 to 2009 and assess modification of this effect by age (e.g. cohort effect) and gender, and (ii) quantify the influence of household income and community urbanicity on these effects.
Methods Data are from the China Health and Nutrition Survey, a prospective sample across nine provinces in China; 53 298 observations from 18 059 participants were collected over a 19-year period. A series of mixed effects models was used to explicitly assess differences in BMI within individuals over time (age effect) and population-wide differences in BMI over time (period effect), and implicitly assess differences in the experienced period effect across individuals of varying ages (cohort effect).
Results Stronger period effects on BMI and overweight were observed among males compared with females; and younger cohorts had higher BMIs compared with older cohorts. Simulations predicted that increases in income and urbanicity in the order of magnitude of that observed from 1991 to 2009 would correspond to shifts in the BMIs of average individuals of 0.07 and 0.23 kg/m2, respectively.
Conclusions Although period effects had a stronger influence on the BMI of males, interventions should not overlook younger female cohorts who are at increased risk compared with their older counterparts.
Keywords: Age-period-cohort analysis, China, body mass index, overweight
Introduction
Since the introduction of market-oriented economic reforms in 1978, the urban population of China has tripled.1 The velocity and scale of urbanization in China have no precedent in history; similar magnitudes of growth were only achieved after hundreds of years in today’s developed countries.2 Further, the lack of urban slum proliferation renders the situation in China unique compared with other emerging countries.2 Early migration studies in China supported an important effect of environment relative to genetics on the development of chronic disease risk factors.3 Given that urbanization continues to accelerate in China—the urban population is projected to double between 2000 and 20304—improving our understanding of the health consequences of this exposure is critical.
Closely linked to urbanization is economic development: Chinese per capita GDP (in current USD) increased from $193 in 1980 to $5445 in 2011.5 Concurrent drops in fertility and increases in life expectancy have resulted in one of the most rapid progressions of ageing in the world.6,7 Confounding by this momentous shift in population age structure has distorted previous attempts to evaluate secular trends in health using cross-sectional data.
These pervasive environmental exposures—urbanization and economic development—have transformed the Chinese health care system from one dominated by infectious diseases to one focused on chronic diseases. By 2008, over two-thirds of deaths in China were attributable to chronic disease with obesity being one of the leading risk factors.8 The most recent nationally representative data (2002) revealed a prevalence of overweight among adults of 21.8%.9 The relationship between urbanization, economic development, and obesity is complex. Potential pathways include changes in dietary intake10–12 and physical activity13,14 occurring as part of the nutrition transition.15,16
Whereas the negative effects of economic and social transformations in today’s rapidly developing countries have been evaluated, potential counteractive effects resulting from improved nutritional status during early development have received little attention. Greater health capital endowed on recent cohorts may result in improved physiological capacity.17–19 One study among Taiwanese adults20 found that the economic development occurring over the past 30 years in Taiwan had counteractive effects: individuals born after 1970 tended to have lower BMIs relative to individuals born before 1970. A thorough evaluation of age-period-cohort (APC) effects is essential for understanding observed longitudinal changes in adult Chinese BMI.
Here we utilize data from the China Health and Nutrition Survey (CHNS), a longitudinal sample following multiple Chinese birth cohorts over a 19-year period.21 Whereas sociologists tend to conceptualize the cohort itself as an exposure, and age and period as confounders of the cohort’s effect,22 we use an alternative approach, conceptualizing cohort effects as period effects that are experienced differently across age subgroups.22 We address the nonidentifiability of APC models by focusing on second-order effects rather than using the traditional constraint-based regression techniques23 or Holford models.24–26 This approach allows us to identify age groups at increased risk of high BMI in the current environment. Identification of these high-risk groups is important for two reasons: (i) population-level risk profiling that enables the design of targeted prevention interventions is an essential component of preparing health care systems for tackling chronic diseases, and robust evidence on high-risk groups for obesity in China is lacking; and (ii) it is important to monitor recent cohorts for increased susceptibility to secular trends in order to anticipate sharp rises in the prevalence of obesity as these cohorts reach the peak age of obesity onset. In a country with a population approaching 1.5 billion,27 limited health care resources and increasing disparities in health care access, a thorough evaluation of BMI and overweight trends is urgently needed.
The objectives were to (i) describe the period effect on BMI and overweight among Chinese adults from 1991 to 2009 and assess modification of this effect by age (e.g. cohort effect) and gender, and (ii) quantify the contribution of household income and community urbanicity to these observed effects.
Method
Study sample
Details of study design were described previously.21 Briefly, the CHNS began enrolling individuals in 1989 and completed the eighth wave of data collection in 2009. Multistage random cluster sampling was used to sample the provinces. Procedures were approved by Institutional Review Boards of the University of North Carolina, Chapel Hill and the Chinese Centre for Disease Control.
Questionnaires and anthropometric data were collected in 1989, 1991, 1993, 1997, 2000, 2004, 2006 and 2009. The 1989 survey did not collect data on all age groups and did not use the same standardized procedures, stadiometers or scales as subsequent survey years, and was therefore excluded. Male and non-pregnant female adults aged 18–59 years were included in the present analysis. An age cutpoint of 59 years was chosen because of evidence of sarcopenia in older individuals.28,29 The number of repeat measurements for participants ranged from 1 to 7 with a mean of 3. A total of 5683 individuals had only 1 measurement, 3789 had 2, 2396 had 3, 1921 had 4, 1724 had 5, 1277 had 6 and 1269 had 7. Therefore, the total number of participants and observations were 18 059 and 53 298, respectively.
Variable definitions
Survey year was coded as a categorical variable and specified using indicator variables with the 1991 survey as the referent.
Date of birth and gender were self-reported by participants in interviewer-administered household questionnaires. Age was defined as age at last birthday using the date of birth and date of survey, and was specified continuously using age and an age-squared term to account for the previously hypothesized non-linear relationship between age and BMI.30–32 Total net annual income was calculated at the household level for each survey year and inflated to 2009. Urbanicity was calculated at the community level for each survey year using a multicomponent continuous scale.33 Communities could receive a maximum of 10 points for each of 12 components including population density, economic activity, traditional markets, modern markets, transportation infrastructure, sanitation, communications, housing, education, diversity, health infrastructure and social services.
Weight and height were measured by trained nutritionists. Height was measured to the nearest 0.2 cm using a portable stadiometer and weight was measured to the nearest 0.1 kg using a calibrated beam scale. BMI was calculated as weight (kg) divided by height squared (m2). Overweight was defined according to the World Health Organization guidelines as a BMI ≥25 kg/m2.34
Statistical analysis
Cross-sectional univariate descriptive statistics of the primary outcomes and explanatory variables were calculated and reported as mean ± SD or %, stratified by gender.
Due to changes in inclusion criteria, modifications to sampling methods, attrition, migration and various other factors, CHNS cohort membership varies over time. Potential biases from sample selectivity were addressed using a Heckman two-equation approach.35 The inverse of the predicted probability that an individual was included in each survey given his/her province, community urbanicity and their interaction was included as a time-varying variable in all models (the Mill’s ratio).
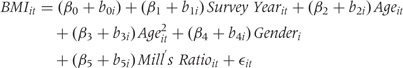
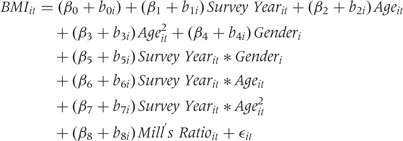
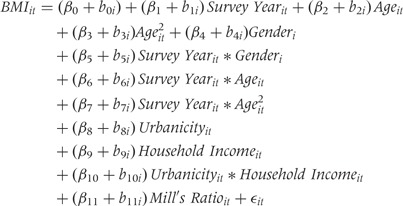
A series of mixed effects models (Series A; models 1, 2, 3) with fixed and random individual-level effects and random slopes was used to explicitly assess differences in BMI within individuals over time (age effect) and population-wide differences in BMI over time (period effect), and implicitly assess differences in the experienced period effect across individuals of varying ages (cohort effect). Mixed effects models were chosen because they can accommodate unbalanced data and continuous covariates, and because the hierarchical nature of the models overcomes the identifiability problem by not assuming that APC effects are linear and additive at the same level of analysis.36,37 (Note: the inclusion of a quadratic term for age further addresses the nonidentifiability of APC effects.) Mixed effects models also allow individuals to have their own intercept and slope, recognizing that at baseline, some individuals will lie above the population mean (β0) and some below; some will have a slope greater than the population mean (β1) and some will have a slope less than β1. This gives the model more flexibility in that it allows for heterogeneity both in response at baseline and in changes in response over time. The series of models analysed included:
 |
(1) |
 |
(2) |
 |
(3) |
where BMIit is the BMI of individual i at time t; β0, β1 … , βk are the population mean intercept and slopes for the explanatory variables (fixed effects); b0i is the difference between β0 and the intercept of individual i (random effect); b1i … , bki are the differences between β1 … , βk and the slopes of individual i (random effects); and εit is the random error within individuals over time.
The linear combination of the coefficients for age and age-squared in Equation 1 can be interpreted as the overall age effect controlling for survey year, gender and study design effects. The coefficients for survey year in Equation 1 can be interpreted as the overall period effect controlling for age, gender and study design effects. The coefficients for the survey year and age interaction terms in Equation 2 can be interpreted as differences in the experienced period effect across individuals of varying ages (cohort effect) and the coefficients for the survey year and gender interaction terms can be interpreted as differences in the experienced period effect between males (referent) and females. The presence of interaction between survey year and age, and between survey year and gender, was formally evaluated using likelihood ratio tests (LRTs). Equation 3 assessed the influence of time-varying household income, community urbanicity and their interaction on the age and period effects.
A series of two-level random intercept logit models (Series B; models 1, 2, 3) was used to assess the likelihood of overweight over time. The series of models analysed was analogous to that described previously (Equations 1–3). Longitudinal models were fitted using the XTMIXED (for BMI) and XTLOGIT (for overweight) programs in Stata 12.0 (StataCorp LP, College Station, TX).
An alternative approach to hierarchical APC analysis of accelerated longitudinal panel study data36,38,39 that explicitly incorporates cohort effects and implicitly incorporates period effects via an age-by-cohort interaction was used to confirm the results relating to cohort effects observed in the entire sample (see Supplementary Appendix 1 available at IJE online).
A complete-case subgroup analysis of individuals with measurements for all survey years (n = 1269) was conducted to visualize longitudinal trends in BMI as individuals age (age effect) and to investigate mean response profiles for BMI by baseline age group (cohort effect).
Results
Cross-sectional analysis across survey years (Table 1) indicated that the prevalence of overweight in Chinese adults nearly tripled from 1991 (11.7%) to 2009 (29.2%). The mean age of the sample also increased from 36.6 to 43.2 years. Together, these observations support the existence of confounding by age on secular increases in BMI and overweight in this sample and provide justification for subsequent APC analyses.
Table 1.
Cross-sectional univariate descriptives of the China Health and Nutrition Survey across survey yearsa
| Survey Year |
|||||||
|---|---|---|---|---|---|---|---|
| 1991 | 1993 | 1997 | 2000 | 2004 | 2006 | 2009 | |
| All Participants | 7397 | 6977 | 8805 | 7849 | 7606 | 7361 | 7303 |
| Male (%) | 47.8 | 47.8 | 50.9 | 48.4 | 48.7 | 48.1 | 48.7 |
| Age (years) | 36.6 ± 11.5 | 37.1 ± 11.4 | 37.0 ± 11.5 | 39.6 ± 11.0 | 41.8 ± 10.9 | 42.7 ± 10.7 | 43.2 ± 10.9 |
| Household Incomec | 12 049 ± 8823 | 13 759 ± 11 859 | 16 719 ± 14 205 | 19 931 ± 19 296 | 24 319 ± 24 339 | 28 934 ± 36 846 | 40 809 ± 49 579 |
| Community Urbanicityd | 46.0 ± 16.1 | 47.4 ± 16.2 | 51.7 ± 18.0 | 58.3 ± 18.3 | 61.6 ± 20.1 | 64.0 ± 20.2 | 67.2 ± 19.3 |
| BMI (kg/m2) | 21.7 ± 2.7 | 21.8 ± 2.7 | 22.3 ± 3.0 | 22.8 ± 3.1 | 23.1 ± 3.2 | 23.2 ± 3.2 | 23.4 ± 3.4 |
| Overweighte (%) | 11.7 | 12.7 | 17.1 | 22.7 | 25.6 | 26.9 | 29.2 |
| Males | 3534 | 3335 | 4481 | 3799 | 3704 | 3543 | 3554 |
| Age (years) | 36.6 ± 11.5 | 37.0 ± 11.5 | 36.7 ± 11.6 | 39.4 ± 11.3 | 41.5 ± 11.1 | 42.5 ± 10.9 | 42.9 ± 11.1 |
| BMI (kg/m2) | 21.4 ± 2.5 | 21.7 ± 2.5 | 22.1 ± 2.8 | 22.7 ± 3.0 | 23.0 ± 3.1 | 23.2 ± 3.2 | 23.5 ± 3.4 |
| Overweighte (%) | 9.1 | 10.4 | 15.3 | 21.5 | 24.7 | 27.2 | 30.4 |
| Females | 3863 | 3641 | 4323 | 4048 | 3902 | 3818 | 3749 |
| Age (years) | 36.5 ± 11.4 | 37.3 ± 11.3 | 37.3 ± 11.5 | 39.7 ± 10.8 | 42.0 ± 10.7 | 42.8 ± 10.5 | 43.4 ± 10.7 |
| BMI (kg/m2) | 21.9 ± 2.9 | 22.0 ± 2.9 | 22.4 ± 3.1 | 22.9 ± 3.2 | 23.1 ± 3.4 | 23.2 ± 3.3 | 23.3 ± 3.4 |
| Overweighte (%) | 14.0 | 14.8 | 18.90 | 23.9 | 26.5 | 26.5 | 28.1 |
aValues presented as numbers for arbitrary values and as mean ± SD or % for other variables.
bNumber of individuals included in sample for specified survey year.
cNet annual. Inflated to 2009.
dMeasured at the community level on a 12-component continuous scale ranging from 0-120 with higher values corresponding to higher levels of urbanicity.
eBMI ≥ 25 kg/m2.
Curvilinear age effects were observed confirming non-linear increases in BMI with age over time (Table 2; Series A, Model 1). Controlling for the age effect, positive period effects on BMI were observed that were particularly substantial (approximately 4 times the size of the age coefficient) from 2004 to 2009 (Table 2; Series A, Model 1). Simulations using the final adjusted model (Table 2; Series A, Model 3) predicted BMIs for an average 45-year-old male of 22.4 kg/m2 in 1991 and 23.9 kg/m2 in 2009, a shift of 1.5 kg/m2 over 19 years (Figure 1). An interaction between survey year and age [LRT chi-square (DF), P-value: 136.6 (12), P < 0.0001] and between survey year and gender [LRT chi-square (DF), P-value: 45.9 (6), P < 0.0001] were observed (Table 2; Series A, Model 2), indicating that the period effect was stronger among men (vs women) and suggesting the existence of a cohort effect independent of age and period effects (Table 2; Series A, Model 3), which was confirmed in APC analyses explicitly modelling cohort effects (see Supplementary Appendix 1, available at IJE online).
Table 2.
Parameter estimates (95% confidence intervals) from linear mixed effects models (Series A) predicting BMI (kg/m2) among Chinese adults
| Model 1 | Model 2 | Model 3 | |
|---|---|---|---|
| Age | 0.22 (0.21, 0.23) | 0.19 (0.16, 0.22) | 0.19 (0.16, 0.22) |
| Age2 | −0.002 (−0.002, −0.002) | −0.002 (−0.002, −0.001) | −0.002 (−0.002, −0.001) |
| Gender | −0.09 (−0.18, −0.01) | 0.001 (−0.100, 0.102) | −0.004 (−0.11, 0.10) |
| 1993 | 0.15 (0.10, 0.20) | −0.15 (−0.69, 0.39) | −0.03 (−0.59, 0.53) |
| 1997 | 0.40 (0.35, 0.46) | −1.53 (−2.17, −0.88) | −1.31 (−1.98, −0.64) |
| 2000 | 0.81 (0.76, 0.87) | −2.12 (−2.81, −1.42) | −1.98 (−2.69, −1.26) |
| 2004 | 0.95 (0.88, 1.02) | −1.92 (−2.71, −1.13) | −1.86 (−2.66, −1.05) |
| 2006 | 0.98 (0.91, 1.05) | −1.89 (−2.73, −1.06) | −1.99 (−2.85, −1.14) |
| 2009 | 1.11 (1.03, 1.19) | −1.98 (−2.87, −1.09) | −1.99 (−2.90, −1.09) |
| 1993*Gender | −0.09 (−0.19, 0.00) | −0.09 (−0.18, 0.01) | |
| 1997*Gender | −0.08 (−0.18, 0.02) | −0.09 (−0.19, 0.02) | |
| 2000*Gender | −0.09 (−0.19, 0.02) | −0.08 (−0.18, 0.02) | |
| 2004*Gender | −0.20 (−0.30, −0.09) | −0.18 (−0.29, −0.07) | |
| 2006*Gender | −0.30 (−0.41, −0.19) | −0.29 (−0.40, −0.17) | |
| 2009*Gender | −0.36 (−0.48, −0.24) | −0.35 (−0.47, −0.23) | |
| 1993*Age | 0.02 (−0.01, 0.05) | 0.01 (−0.02, 0.04) | |
| 1997*Age | 0.10 (0.07, 0.14) | 0.09 (0.06, 0.13) | |
| 2000*Age | 0.15 (0.11, 0.19) | 0.14 (0.10, 0.18) | |
| 2004*Age | 0.14 (0.10, 0.18) | 0.13 (0.09, 0.17) | |
| 2006*Age | 0.14 (0.10, 0.18) | 0.14 (0.09, 0.18) | |
| 2009*Age | 0.14 (0.10, 0.10) | 0.13 (0.09, 0.18) | |
| 1993*Age2 | −0.0002 (−0.0006, 0.0002) | −0.0001 (−0.0005, 0.0003) | |
| 1997*Age2 | −0.001 (−0.002, −0.001) | −0.001 (−0.002, −0.001) | |
| 2000*Age2 | −0.002 (−0.002, −0.001) | −0.002 (−0.002, −0.001) | |
| 2004*Age2 | −0.001 (−0.002, −0.001) | −0.001 (−0.002, −0.001) | |
| 2006*Age2 | −0.001 (−0.002, −0.001) | −0.001 (−0.002, −0.001) | |
| 2009*Age2 | −0.001 (−0.002, −0.001) | −0.001 (−0.002, −0.001) | |
| Community Urbanicitya | 0.007 (0.005, 0.009) | ||
| Household Incomeb | 4.43e−06 (2.28e−06, 6.57e−06) | ||
| Urbanicity* Household Income | −5.76e−08 (−8.88e−08, −2.63e−08) | ||
| Mill’s Ratioc | −0.05 (−0.07, −0.02) | −0.04 (−0.07, −0.02) | −0.03 (−0.05, 0.00) |
aMeasured at the community level on a 12-component continuous scale ranging from 0-120 with higher values corresponding to higher levels of urbanicity.
bNet annual. Inflated to 2009.
cInverse predicted probability of being included in a given survey year.
Figure 1.

Predicted BMI (kg/m2) from final adjusted linear mixed effects model (Series A, Model 3) for an average 25- and 45-year-old male and female in 1991 compared with 2009 at mean values for covariates (household income, community urbanicity and Mill’s ratio) over all survey years. The change in BMI from 1991 to 2009 was greatest for the older male (1.50 kg/m2) and lowest for the younger female (0.23 kg/m2)
Household income and community urbanicity were positive predictors of BMI (Table 2; Series A, Model 3): model estimates, holding all other explanatory variables constant, predicted that an increase in household income of 2 SD above the mean (mean ± SD across all survey years: 22 294 ± 28 572) would correspond to an increase in BMI of 0.07 kg/m2; and an increase in community urbanicity of 2 SD above the mean (mean ± SD across all survey years: 56.5 ± 19.9) would correspond to an increase in BMI of 0.23 kg/m2. The inclusion of these distal predictors attenuated the period effect up to survey year 2000, after which they did not appear to have a strong influence: the change-in-estimate was greater than 10% (range: 14–22%) for survey years 1993, 1997 and 2000.
Additional adjustment for physical activity [total metabolic equivalents (h/week) from domestic and occupational activities], and 3-day average energy (kcal) and fat intake (percent calories from fat) from 24-h dietary recalls indicated that both physical activity and energy intake were predictors of BMI [beta coefficient (95% confidence interval): -0.0004 (-0.0005, -0.0003) and 0.00004 (0.00001, 0.00006), respectively]. Although the inclusion of these individual-level predictors further attenuated the period effect up to survey year 2004, a secular trend in BMI remained (see Supplementary Appendix 2, available as Supplementary data at IJE online).
Similar to the longitudinal trends observed for BMI, curvilinear age and positive period effects were estimated for overweight from 1991 to 2009 (Table 3; Series B, Model 1). An interaction (Table 3; Series B, Model 2) was observed between survey year and gender [LRT chi-square (DF), P-value: 32.8 (6), P < 0.0001]; however, no interaction was observed between survey year and age [LRT chi-square (DF), P-value: 7.7 (12), P = 0.8]. Household income and community urbanicity were positive predictors of overweight (Table 3; Series B, Model 3) and the magnitude of the effect was greater for the models predicting overweight compared with the models predicting BMI: change-in-estimates were greater than 10% (range: 33–75%) for survey years 2004, 2006 and 2009. Most dramatic was the change-in-estimate for 2006, which went from 3.15 (unadjusted) to 2.40 (adjusted).
Table 3.
Parameter estimates (95% confidence intervals) from longitudinal random intercept logit models (Series B) predicting overweight (BMI ≥25 kg/m2) among Chinese adults
| Model 1 | Model 2 | Model 3 | |
|---|---|---|---|
| Age | 0.42 (0.38, 0.46) | 0.42 (0.31, 0.53) | 0.42 (0.31, 0.53) |
| Age2 | −0.004 (−0.005, −0.004) | −0.004 (−0.005, −0.003) | −0.004 (−0.005, −0.003) |
| Gender | 0.06 (−0.10, 0.22) | 0.62 (0.31, 0.93) | 0.62 (0.31, 0.93) |
| 1993 | 0.31 (0.14, 0.48) | 0.91 (−1.52, 3.34) | 0.96 (−1.52, 3.43) |
| 1997 | 0.82 (0.64, 0.10) | 1.27 (−1.38, 3.91) | 1.35 (−1.34, 4.03) |
| 2000 | 1.69 (1.51, 1.86) | 1.75 (−0.90, 4.40) | 1.72 (−0.98, 4.42) |
| 2004 | 1.99 (1.80, 2.17) | 2.31 (−0.54, 5.15) | 1.98 (−0.90, 4.86) |
| 2006 | 2.02 (1.83, 2.22) | 3.15 (0.28, 6.02) | 2.40 (−0.52, 5.31) |
| 2009 | 2.32 (2.12, 2.52) | 4.66 (1.83, 7.49) | 4.32 (1.45, 7.16) |
| 1993*Gender | −0.19 (−0.54, 0.15) | −0.17 (−0.52, 0.18) | |
| 1997*Gender | −0.38 (−0.73, −0.03) | −0.39 (−0.75, −0.04) | |
| 2000*Gender | −0.53 (−0.87, −0.19) | −0.53 (−0.87, −0.18) | |
| 2004*Gender | −0.63 (−0.97, −0.28) | −0.58 (−0.94, −0.23) | |
| 2006*Gender | −0.81 (−1.16, −0.46) | −0.80 (−1.15, −0.44) | |
| 2009*Gender | −0.94 (−1.29, −0.58) | −0.92 (−1.28, −0.56) | |
| 1993*Age | −.021 (−0.15, 0.10) | −0.03 (−0.15, 0.10) | |
| 1997*Age | 0.002 (−0.13, 0.14) | −0.01 (−0.14, 0.13) | |
| 2000*Age | 0.03 (−0.11, 0.16) | 0.01 (−0.13, 0.15) | |
| 2004*Age | 0.01 (−0.14, 0.15) | 0.00 (−0.14, 0.15) | |
| 2006*Age | −0.02 (−0.16, 0.12) | −0.00 (−0.15, 0.14) | |
| 2009*Age | −0.08 (−0.22, 0.06) | −0.09 (−0.23, 0.06) | |
| 1993*Age2 | 0.0002 (−0.001, 0.002) | 0.0003 (−0.001, 0.002) | |
| 1997*Age2 | −0.0002 (−0.002, 0.002) | −0.0001 (−0.002, 0.002) | |
| 2000*Age2 | −0.0005 (−0.002, 0.001) | −0.0003 (−0.002, 0.001) | |
| 2004*Age2 | −0.0001 (−0.002, 0.002) | −0.0001 (−0.002, 0.002) | |
| 2006*Age2 | 0.0001 (−0.002, 0.002) | −0.0001 (−0.002, 0.002) | |
| 2009*Age2 | 0.0008 (−0.001, 0.003) | 0.0008 (−0.001, 0.003) | |
| Community urbanicitya | 0.03 (0.02, 0.03) | ||
| Household incomeb | 0.00001 (8.74e−06, 0.00002) | ||
| Urbanicity* Household income | −1.99e−07 (−2.85e−07, −1.14e−07) | ||
| Mill’s ratioc | −0.17 (−0.23, −0.11) | −0.16 (−0.22, −0.10) | −0.10 (−0.16, −0.04) |
aMeasured at the community level on a 12-component continuous scale ranging from 0 to 120 with higher values corresponding to higher levels of urbanicity.
bNet annual. Inflated to 2009.
cInverse predicted probability of being included in a given survey year.
Results of the complete-case analysis confirmed that BMI increases non-linearly with age (Figure 2). Furthermore, at any given age, individuals who were younger at baseline had higher mean BMIs compared with individuals older at baseline. For example, females born between 1957 and 1961 had a mean BMI of approximately 21 kg/m2 whereas females born between 1967 and 1973 had a mean BMI of ∼22.5 kg/m2 (Figure 2). Plots of the survey year coefficients for baseline age group- and gender-stratified longitudinal mixed effects models predicting BMI illustrate this cohort effect more succinctly (Figure 3).
Figure 2.

Response profiles of 1269 participants with measurements for all 7 surveys stratified by baseline age group (cohort) among (a) males and (b) females. Points represent mean BMI (kg/m2) at mean age (years) for each cohort across survey years (1991, 1993, 1997, 2000, 2004, 2006 and 2009). The difference between lines represents differences in the experienced period effect by baseline age group, equivalent to a cohort effect
Figure 3.

Secular trends in BMI (kg/m2) for 1269 participants with measurements for all 7 surveys among (a) males and (b) females. Bars represent differences from referent BMI (1991), estimated by unadjusted linear mixed effects models stratified by baseline age group (cohort). Results indicate that the period effect was strongest for younger baseline age groups
Discussion
Over the past two decades, the prevalence of overweight in Chinese adults has nearly tripled from 11.7% to 29.2%. Longitudinal analyses confirmed that age-related increases in BMI and secular trends underlie this alarming observation. For 45-year-old males, the secular trend predicted an increase in mean BMI of 1.5 kg/m2 over the 19-year observation period. A BMI increase of 2 kg/m2 among Chinese adults has previously been associated with an increase in the relative risk of coronary heart disease of 15.4% and of ischaemic stroke of 18.8%.40 Increases in household income and community urbanicity were associated with these population increases in BMI and overweight.
Consistent with previous reports,9,41–43 period effects on BMI and overweight were stronger among males compared with females, perhaps due to differences in occupation. Although participation in the labour force is high among both men and women in China,44 analysis of CHNS data indicated that men had 68% greater odds of light vs heavy occupational activity compared with 51% among women,14 suggesting that differences in energy expenditure may explain observed differences in the period effect. Gender differences in period effects have also been reported among Taiwanese adults: between 1996 and 2006, although BMI increased among men it decreased slightly among women.20
More recent Chinese cohorts had higher age-specific mean BMIs compared with older cohorts, even given similar environmental exposures. Previous APC analyses among Korean men also support larger changes in obesity among younger cohorts.45 In the USA, one previous APC analysis of obesity reported no cohort effect,22 whereas other analyses have found moderate cohort effects, particularly among Black females.46–48 Our data suggest that younger cohorts in China may more readily adopt unhealthy eating behaviours such as snacking, eating away from home and sedentary behaviours compared with their older counterparts.13,49,51
The magnitude of the association between community urbanicity and BMI was substantially larger than that of household income, perhaps indicating that urbanicity is a stronger driver of secular increases in BMI. Of note, the secular trends in BMI remained after adjustment for household income and community urbanicity, and after adjustment for mediating factors—physical activity, energy intake and fat intake—indicating that additional environmental forces not captured by these predictors may be contributing to the increases in BMI over time. A similar result was reported among women in the Philippines.30 Future work should examine alternative theories of BMI change in China.
This is the largest longitudinal analysis of BMI and overweight to be conducted in a diverse sample of Chinese adults. The outcome measures used standardized protocols, eliminating information bias from self-report. Our use of a multicomponent scale for urbanicity captured changes better than the binary variable based on administrative district used in previous studies,41,42,52,53 and our assessment of household income was more comprehensive, including all income-producing activities by each person in the household, both in and out of the formal market. Some researchers have petitioned for the use of an Asian-specific cutpoint to reflect the increased risk of comorbidities at lower BMIs in this population;54,55 our analysis therefore provides conservative estimates of overweight. Although previous studies have reported similar increases in BMI and overweight in China,41–43,52 all analyses have been cross-sectional and only one has included data collected within the past 5 years.41
The increase in BMI and subsequent rise in the prevalence of overweight among Chinese adults has substantial implications for the Chinese health care system. Obesity is an important risk factor for several chronic diseases, and indeed we have observed elevated risk for diabetes, hypertension, dyslipidaemia and inflammation in the CHNS.56,57 Policy efforts to address overweight are slowly emerging.58,59 Given the limited medical infrastructure and current health care funding system imposing large out-of-pocket expenses on patients in China, the development of these comorbidities among overweight individuals has the potential to significantly affect future economic development.60 New approaches are needed to reverse the reported trends in BMI and overweight, particularly in younger cohorts.
Supplementary Data
Supplementary data are available at IJE online.
Funding
The China National Institute of Nutrition and Food Safety; the China Centre for Disease Control; the National Institutes of Health [grant numbers R01HD30880, P30DK056350, R21DK089306, R01HL108427 and R01HD38700]; the Fogarty International Center of the National Institutes of Health; the China-Japan Friendship Hospital; and the Chinese Ministry of Health.
Conflict of interest: None declared.
KEY MESSAGES.
Until contributions of age-period-cohort effects to increases in BMI and overweight are adequately resolved, interventions to address this chronic disease risk factor cannot be appropriately designed.
Period effects on BMI and overweight were stronger among males compared with females, and more recent cohorts had higher BMIs compared with their older counterparts.
We report that the large increase in urbanicity over the past 2 decades in China may be partially responsible for the period effects on BMI and overweight, and represents a missed opportunity for improving health outcomes in the post-economic reform era.
Supplementary Material
References
- 1.National Bureau of Statistics of China. China's total population and structural changes in 2011. 2012. http://www.stats.gov.cn/english/newsandcomingevents/t20120120_402780233.htm (26 December 2012, date last accessed)
- 2.Gong P, Liang S, Carlton EJ, et al. Urbanisation and health in China. Lancet. 2012;379:843–52. doi: 10.1016/S0140-6736(11)61878-3. [DOI] [PMC free article] [PubMed] [Google Scholar]
- 3.He J, Klag MJ, Whelton PK, et al. Migration, blood pressure pattern, and hypertension: the Yi Migrant Study. Am J Epidemiol. 1991;134:1085–101. doi: 10.1093/oxfordjournals.aje.a116012. [DOI] [PubMed] [Google Scholar]
- 4.Cao G-GY. Urban growth in China: past, prospect, and its impacts. Popul Environ. 2012;33:137–60. [Google Scholar]
- 5.World Bank. World development indicators. 2012. http://data.worldbank.org/data-catalog/world-development-indicators (26 December 2012, date last accessed)
- 6.Kincannon CL, He W, West LA. Demography of aging in China and the United States and the economic well-being of their older populations. J Cross Cult Gerontol. 2005;20:243–55. doi: 10.1007/s10823-006-9015-1. [DOI] [PubMed] [Google Scholar]
- 7.Flaherty JH, Liu ML, Ding L, et al. China: The aging giant. J Am Geriatr Soc. 2007;55:1295–300. doi: 10.1111/j.1532-5415.2007.01273.x. [DOI] [PubMed] [Google Scholar]
- 8.Yang G, Kong L, Zhao W, et al. Emergence of chronic non-communicable diseases in China. Lancet. 2008;372:1697–705. doi: 10.1016/S0140-6736(08)61366-5. [DOI] [PubMed] [Google Scholar]
- 9.Wang Y, Mi J, Shan XY, Wang QJ, Ge KY. Is China facing an obesity epidemic and the consequences? The trends in obesity and chronic disease in China. Int J Obes (Lond) 2007;31:177–88. doi: 10.1038/sj.ijo.0803354. [DOI] [PubMed] [Google Scholar]
- 10.Popkin BM, Lu B, Zhai F. Understanding the nutrition transition: measuring rapid dietary changes in transitional countries. Public Health Nutr. 2002;5:947. doi: 10.1079/PHN2002370. [DOI] [PubMed] [Google Scholar]
- 11.Drewnowski A, Popkin BM. The nutrition transition: New trends in the global diet. Nutr Rev. 1997;55:31–43. doi: 10.1111/j.1753-4887.1997.tb01593.x. [DOI] [PubMed] [Google Scholar]
- 12.Du S, Lu B, Zhai F, Popkin BM. A new stage of the nutrition transition in China. Public Health Nutr. 2002;5:169. doi: 10.1079/PHN2001290. [DOI] [PubMed] [Google Scholar]
- 13.Ng SW, Norton EC, Popkin BM. Why have physical activity levels declined among Chinese adults? Findings from the 1991-2006 China Health and Nutrition Surveys. Soc Sci Med. 2009;68:1305–14. doi: 10.1016/j.socscimed.2009.01.035. [DOI] [PMC free article] [PubMed] [Google Scholar]
- 14.Monda KL, Gordon-Larsen P, Stevens J, Popkin BM. China's transition: The effect of rapid urbanization on adult occupational physical activity. Soc Sci Med. 2007;64:858–70. doi: 10.1016/j.socscimed.2006.10.019. [DOI] [PMC free article] [PubMed] [Google Scholar]
- 15.Popkin BM, Keyou G, Zhai F, Guo X, Ma H, Zohoori N. The nutrition transition in China: a cross-sectional analysis. Eur J Clin Nutr. 1993;47:333–46. [PubMed] [Google Scholar]
- 16.Popkin BM. The nutrition transition in low-income countries: an emerging crisis. Nutr Rev. 1994;52:285–98. doi: 10.1111/j.1753-4887.1994.tb01460.x. [DOI] [PubMed] [Google Scholar]
- 17.Crimmins EM, Reynolds SL, Saito Y. Trends in health and ability to work among the older working-age population. J Gerontol B Psychol Sci Soc Sci. 1999;54:S31–40. doi: 10.1093/geronb/54b.1.s31. [DOI] [PubMed] [Google Scholar]
- 18.Freedman VA, Martin LG. Understanding trends in functional limitations among older Americans. Am J Public Health. 1998;88:1457–62. doi: 10.2105/ajph.88.10.1457. [DOI] [PMC free article] [PubMed] [Google Scholar]
- 19.Fogel RW, Costa DL. A theory of technophysio evolution, with some implications for forecasting population, health care costs, and pension costs. Demography. 1997;34:49–66. [PubMed] [Google Scholar]
- 20.Tu YK, Chien KL, Burley V, Gilthorpe MS. Unravelling the effects of age, period and cohort on metabolic syndrome components in a Taiwanese population using partial least squares regression. BMC Med Res Methodol. 2011;11:82–98. doi: 10.1186/1471-2288-11-82. [DOI] [PMC free article] [PubMed] [Google Scholar]
- 21.Popkin BM, Du S, Zhai F, Zhang B. Cohort Profile: The China Health and Nutrition Survey—monitoring and understanding socio-economic and health change in China, 1989–2011. Int J Epidemiol. 2010;39:1435–40. doi: 10.1093/ije/dyp322. [DOI] [PMC free article] [PubMed] [Google Scholar]
- 22.Keyes KM, Utz RL, Robinson W, Li G. What is a cohort effect? Comparison of three statistical methods for modeling cohort effects in obesity prevalence in the United States, 1971-2006. Soc Sci Med. 2010;70:1100–08. doi: 10.1016/j.socscimed.2009.12.018. [DOI] [PMC free article] [PubMed] [Google Scholar]
- 23.Mason KO, Mason WM, Winsborough HH, Poole WK. Some methodological issues in cohort analysis of archival data. Am Sociol Rev. 1973;38:242–58. [Google Scholar]
- 24.Holford TR. The estimation of age, period and cohort effects for vital rates. Biometrics. 1983;39:311–24. [PubMed] [Google Scholar]
- 25.Holford TR. Analysing the temporal effects of age, period and cohort. Stat Methods Med Res. 1992;1:317–37. doi: 10.1177/096228029200100306. [DOI] [PubMed] [Google Scholar]
- 26.Holford TR. Understanding the effects of age, period, and cohort on incidence and mortality rates. Annu Rev Public Health. 1991;12:425–57. doi: 10.1146/annurev.pu.12.050191.002233. [DOI] [PubMed] [Google Scholar]
- 27. Jiantang M, National Bureau of Statistics of China. Press Release on Major Figures of the 2010 National Population Census. 2011 http://www.stats.gov.cn/english/newsandcomingevents/t20110428_402722237.htm (26 December 2012, date last accessed)
- 28.Stookey JD, Adair L, Stevens J, Popkin BM. Patterns of long-term change in body composition are associated with diet, activity, income and urban residence among older adults in China. J Nutr. 2001;131:2433S–440S. doi: 10.1093/jn/131.9.2433S. [DOI] [PubMed] [Google Scholar]
- 29.Stookey JD, Adair LS, Popkin BM. Do protein and energy intakes explain long-term changes in body composition? J Nutr Health Aging. 2005;9:5–17. [PubMed] [Google Scholar]
- 30.Adair LS, Gultiano S, Suchindran C. 20-year trends in Filipino women's weight reflect substantial secular and age effects. J Nutr. 2011;141:667–73. doi: 10.3945/jn.110.134387. [DOI] [PMC free article] [PubMed] [Google Scholar]
- 31.Field AAE. Weight status in childhood as a predictor of becoming overweight or hypertensive in early adulthood. Obes Res. 2005;13:163–69. doi: 10.1038/oby.2005.21. [DOI] [PMC free article] [PubMed] [Google Scholar]
- 32.Hardy RR. The influence of childhood weight and socioeconomic status on change in adult body mass index in a British national birth cohort. Int J Obes Relat Metab Disord. 2000;24:725–34. doi: 10.1038/sj.ijo.0801238. [DOI] [PubMed] [Google Scholar]
- 33.Jones-Smith JC, Popkin BM. Understanding community context and adult health changes in China: development of an urbanicity scale. Soc Sci Med. 2010;71:1436–46. doi: 10.1016/j.socscimed.2010.07.027. [DOI] [PMC free article] [PubMed] [Google Scholar]
- 34.World Health Organization. Obesity: Preventing and Managing the Global Epidemic. Report of a WHO consultation on obesity. Geneva: WHO, 1998. [PubMed] [Google Scholar]
- 35.Heckman JJ. Sample selection bias as a specification error. Econometrica. 1979;47:153–61. [Google Scholar]
- 36.Yang Y, Lee LC. Dynamics and heterogeneity in the process of human frailty and aging: Evidence from the U.S. older adult population. J Gerontol B Psychol. 2010;65B:246–55. doi: 10.1093/geronb/gbp102. [DOI] [PMC free article] [PubMed] [Google Scholar]
- 37.Yang Y, Lee LC. Sex and race disparities in health: Cohort variations in life course patterns. Social Forces. 2009;87:2093–124. [Google Scholar]
- 38.Yang Y, Land KC. A mixed models approach to the age-period-cohort analysis of repeated cross-section surveys, with an application to data on trends in verbal test scores. Sociological Methodology. 2006;36:75–97. [Google Scholar]
- 39.Yang Y. Is old age depressing? Growth trajectories and cohort variations in late-life depression. J Health Soc Behav. 2007;48:16–32. doi: 10.1177/002214650704800102. [DOI] [PubMed] [Google Scholar]
- 40.Zhou BF. Effect of body mass index on all-cause mortality and incidence of cardiovascular diseases–report for meta-analysis of prospective studies open optimal cut-off points of body mass index in Chinese adults. Biomed Environ Sci. 2002;15:245–52. [PubMed] [Google Scholar]
- 41.Xi B, Liang Y, He T, et al. Secular trends in the prevalence of general and abdominal obesity among Chinese adults, 1993-2009. Obes Rev. 2012;13:287–96. doi: 10.1111/j.1467-789X.2011.00944.x. [DOI] [PMC free article] [PubMed] [Google Scholar]
- 42.Dearth-Wesley T, Wang H, Popkin BM. Under- and overnutrition dynamics in Chinese children and adults (1991-2004) Eur J Clin Nutr. 2008;62:1302–07. doi: 10.1038/sj.ejcn.1602853. [DOI] [PubMed] [Google Scholar]
- 43.Wildman RP, Gu D, Muntner P, et al. Trends in overweight and obesity in Chinese adults: between 1991 and 1999-2000. Obes Res. 2008;16:1448–53. doi: 10.1038/oby.2008.208. [DOI] [PubMed] [Google Scholar]
- 44.Bauer JJ. Gender inequality in urban China: Education and employment. Modern China. 1992;18:333–70. [Google Scholar]
- 45.Kwon JW, Song YM, Park H, Sung J, Kim H, Cho SI. Effects of age, time period, and birth cohort on the prevalence of diabetes and obesity in Korean men. Diabetes Care. 2008;31:255–60. doi: 10.2337/dc07-0531. [DOI] [PubMed] [Google Scholar]
- 46.Komlos J, Brabec M. The trend of mean BMI values of US adults, birth cohorts 1882-1986 indicates that the obesity epidemic began earlier than hitherto thought. Am J Hum Biol. 2010;22:631–38. doi: 10.1002/ajhb.21055. [DOI] [PubMed] [Google Scholar]
- 47.Reither EN, Hauser RM, Yang Y. Do birth cohorts matter? Age-period-cohort analyses of the obesity epidemic in the United States. Soc Sci Med. 2009;69:1439–48. doi: 10.1016/j.socscimed.2009.08.040. [DOI] [PMC free article] [PubMed] [Google Scholar]
- 48.Robinson WR, Keyes KM, Utz RL, Martin CL, Yang Y. Birth cohort effects among US-born adults born in the 1980s: foreshadowing future trends in US obesity prevalence. Int J Obes (Lond) 2013;37:448–54. doi: 10.1038/ijo.2012.66. [DOI] [PMC free article] [PubMed] [Google Scholar]
- 49.Ng SW, Norton E, Guilkey DK, Popkin BM. Estimation of a dynamic model of weight. Empirical Economics. 2012;42:413–443. [Google Scholar]
- 50.Dearth-Wesley T, Gordon-Larsen P, Adair LS, Zhang B, Popkin BM. Longitudinal, cross-cohort comparison of physical activity patterns in Chinese mothers and children. Int J Behav Nutr Phys Act. 2012;9:39. doi: 10.1186/1479-5868-9-39. [DOI] [PMC free article] [PubMed] [Google Scholar]
- 51.Wang Z, Zhai F, Zhang B, Popkin BM. Trends in Chinese snacking behaviors and patterns and the social-demographic role between 1991 and 2009. Asia Pac J Clin Nutr. 2012;21:253–62. [PMC free article] [PubMed] [Google Scholar]
- 52.Wang H, Du S, Zhai F, Popkin BM. Trends in the distribution of body mass index among Chinese adults, aged 20-45 years (1989-2000) Int J Obes (Lond) 2007;31:272–78. doi: 10.1038/sj.ijo.0803416. [DOI] [PubMed] [Google Scholar]
- 53.Doak CM, Adair LS, Monteiro C, Popkin BM. Overweight and underweight coexist within households in Brazil, China and Russia. J Nutr. 2000;130:2965–71. doi: 10.1093/jn/130.12.2965. [DOI] [PubMed] [Google Scholar]
- 54.Deurenberg P, Deurenberg-Yap M, Guricci S. Asians are different from Caucasians and from each other in their body mass index/body fat per cent relationship. Obes Rev. 2002;3:141–46. doi: 10.1046/j.1467-789x.2002.00065.x. [DOI] [PubMed] [Google Scholar]
- 55.WHO Expert Consultation. Appropriate body-mass index for Asian populations and its implications for policy and intervention strategies. Lancet. 2004;363:157–63. doi: 10.1016/S0140-6736(03)15268-3. [DOI] [PubMed] [Google Scholar]
- 56.Yan S, Li J, Li S, et al. The expanding burden of cardiometabolic risk in China: the China Health and Nutrition Survey. Obes Rev. 2012;13:810–21. doi: 10.1111/j.1467-789X.2012.01016.x. [DOI] [PMC free article] [PubMed] [Google Scholar]
- 57.Gordon-Larsen P, Adair LS, Meigs JB, et al. Discordant risk: Overweight and cardiometabolic risk in Chinese adults. Obes Res. 2012 doi: 10.1038/oby.2012.152. doi: 10.1038/oby.2012.152. [DOI] [PMC free article] [PubMed] [Google Scholar]
- 58.Zhai F, Fu D, Du S, Ge K, Chen C, Popkin BM. What is China doing in policy-making to push back the negative aspects of the nutrition transition? Public Health Nutr. 2002;5:273–77. doi: 10.1079/phn2001303. [DOI] [PubMed] [Google Scholar]
- 59.Hu FB, Liu Y, Willett WC. Preventing chronic diseases by promoting healthy diet and lifestyle: public policy implications for China. Obes Rev. 2011;12:552–59. doi: 10.1111/j.1467-789X.2011.00863.x. [DOI] [PubMed] [Google Scholar]
- 60.Popkin BM. Will China's nutrition transition overwhelm its health care system and slow economic growth? Health Aff (Millwood) 2008;27:1064–76. doi: 10.1377/hlthaff.27.4.1064. [DOI] [PMC free article] [PubMed] [Google Scholar]
Associated Data
This section collects any data citations, data availability statements, or supplementary materials included in this article.