Abstract
We describe the application of matrix-assisted laser desorption/ionisation time-of-flight mass spectrometry (MALDI-TOF MS) for the characterisation of short tandem repeat (STR) sequences by the analysis of endonuclease cleaved RNA transcripts. Several simple bovine STR loci as well as interrupted and compound microsatellites were chosen as model loci to evaluate the capabilities of MALDI-TOF MS for STR analysis. In short, the described approach consists of a PCR amplification of the investigated STR sequence, which then is transcribed into RNA and cleaved by G-specific RNase T1. Base-specific cleavage of the transcript results in high informative fragment patterns from both the repetitive core sequence and the flanking region. Since sequence specificity from endonuclease cleavage is combined with the accuracy of MALDI-TOF measurements, this technique allows for fast and reliable determination of simple repeat lengths as well as for further characterisation of STR allele sequences, which is of high interest especially in more complex STR loci.
INTRODUCTION
In recent years, matrix-assisted laser desorption/ionisation coupled with time-of-flight mass spectrometry (MALDI-TOF MS) has become a powerful analytical tool with tremendously growing applications in current genomics and proteomics.
In genomics, a number of MALDI-TOF-based approaches, e.g. SNP-scoring (1–4) or estimation of SNP allele frequencies (5) have become common practice and allow large-scale sample processing at relatively low cost. Though the number of specified SNPs and their application as genetic markers is growing rapidly, SNP maps are far from complete in animal or plant genetics. Thus, short tandem repeats (STRs) still are the markers of choice in many fields of genomic research.
Compared to single point mutations, MALDI-TOF analysis of length polymorphisms such as STR sequences is more challenging. STR length determination is severely hindered by the length of the DNA product since fragmentation processes and affinity to cations (e.g. Na+ and K+) are proven to increase with enlarged product size while resolution and sensitivity decrease (6,7). Nevertheless, several strategies have been developed for MALDI-TOF-based genotyping of STR loci.
A number of methods utilise the improved analysis of single-stranded DNA. One approach is based on strand separation of biotinylated PCR products by use of streptavidin-coated magnetic particles prior to mass spectrometric analysis (8,9). Thus, only the non-labelled strand of the PCR product is measured. Another method consists of a primer oligo base extension reaction (PROBE) after PCR amplification of the STR sequence (10,11). Here, a detection primer is annealed to the 5′-end of the repetitive core sequence and extended by a DNA polymerase. After complete extension through the repeat region the primer extension is aborted by the incorporation of a dideoxy nucleotide not present in the repetitive sequence but in the flanking region. This allows for the generation of single-stranded and relative short products, which are more amenable to MALDI-TOF analysis.
A technique earlier established by our group (12) for the first time took advantage of the increased mass resolution and the higher sensitivity reported for RNA (13–15). The principle of this method is the generation of a ribozyme-cleaved RNA transcript derived from a PCR product of the STR sequence, which is subsequently analysed by mass spectrometry. This approach was proven to permit high-resolution STR genotyping in simple dinucleotide repeats with spectra qualities superior to that of DNA.
Beside STR genotyping, MALDI-TOF analysis of biological and synthetic RNA transcripts is used in widespread fields of genomic research. There, post-transcriptional cleavage of RNA transcripts is often performed in order to increase information content of the mass spectra. MALDI-TOF analysis of RNA fragments derived from base-specific cleavage reactions has successfully been performed in applications such as RNA sequence determination (16), detection of post-transcriptional modifications (17), screening for effective sites in antisense technology (18), SNP detection (19,20) and comparative sequence analysis in general (20).
Results of these works again prove RNA to be ideally suited for MALDI-TOF analysis. Additionally, use of base-specific ribonucleases in RNA sequence analysis is shown to allow for exact determination of sequence variations within the investigated RNA transcript.
In the present study, a G-specific cleavage reaction with RNase T1 is performed on RNA transcripts derived from simple as well as interrupted and compound STR loci, in order to evaluate its benefits for an improved characterisation of this kind of length polymorphisms.
MATERIALS AND METHODS
STR-sequences
Eight STR loci (Table 1) consisting of different types of repetitive core sequences were chosen for evaluation of the presented approach. Based on information available from GenBank, four of the selected loci were simple dinucleotide (RM067, BM1224) or trinucleotide repeats (BMS3004, BMS3013). Two STRs (BM1824, BMS1561) were interrupted repeats whereas the remaining two (BM315 and INRA037) were compounds of two different repetitive elements.
Table 1. Investigated STR loci: repeat types, GenBank accession number (acc. no.) and primer sequences including promoter tailing (T7-, T3-).
| Locus | Repeat type | Acc. no. | Primer 1 | Primer 2 |
|---|---|---|---|---|
| RM067 | CA | U32914 | T7- tagtggttccttaaaaagaca | ctttggccatatgaagagctt |
| BM1224 | GT | G18381 | T7- tcgagcgactttctcac | gacaggaagacaaagaaagc |
| BMS3004 | CCA | G19041 | T7- tcagcacagacttagcga | taggcgtgtgccgactct |
| BMS3013 | GGT | G19037 | T7- caaagaatcggacatgtattg | agttccctggattgtctgcaa |
| BM1824 | GTGC(GT)n | G18394 | T3- ctaagtgacatgactaagcaac | gagcaaggtgtttttccaatc |
| BMS1561 | (CCAT)nCCGT(CCAT)n | G18674 | T3- acccacatgtttgggagg | agggaaaggccaaagcac |
| BM315 | (CA)n(CACG)n(CA)n(CACG)n | G18514 | T7- cttccggtccctgacaat | gctcctagccctgcacac |
| INRA037 | (TG)n(CATG)n | X71551 | T3- aaaattccatggagagagaaac | gatcctgcttatatttaaccac |
T7 promoter sequence: taatacgactcactatagggag.
T3 promoter sequence: aattaaccctcactaaaggg.
PCR amplification
PCR (10 µl) contained of 10 ng genomic DNA, 0.3 U of Platinum Taq DNA polymerase (Invitrogen, Karlsruhe), 1× reaction buffer (as supplied), 1.5 mM MgCl2, 5 pmol of forward and reverse primer (Table 1; MWG Biotech), 0.1 mM of each dNTP and 0.25 µl BSA (10 mg/ml). Each primer pair contained one 5′-tagged primer to attach T3 or T7 promoter sequences for subsequent transcription. Oil-free PCRs were performed in a Primus 96 thermocycler with heated lid (MWG Biotech) under following cycling conditions: 3 min at 95°C, 35 cycles at 94°C for 30 s, 58–62°C for 1 min, 72°C for 1 min, and a final extension step of 72°C for 3 min.
Transcription and RNase T1 cleavage
For in vitro transcription of the amplified STRs, 7.5 µl transcription mix was added to an aliquot of 5 µl PCR product. The final transcription reaction contained of 12 U T7 or T3 RNA polymerase (Promega, Madison, WI), respectively, 1× transcription buffer, 0.5 mM of each rNTP and 10 mM DTT, and was incubated at 37°C for 2 h. Prior to digestion with RNase T1, transcripts were desalted on a membrane filtration plate (Multiscreen SEQ, Millipore, Bedford, MA) by washing twice with 20 µl bidistilled water and twice with 20 µl 10 mM dibasic ammonium citrate. Then, samples were resuspended in 5 µl of RNA-denaturing buffer (5 mg/ml 3-HPA in 2% acetonitrile) and digested with 15 U of Guanosine-specific RNase T1 (Roche Diagnostics, Mannheim, Germany) (37°C for 1 h) in order to obtain allele specific fragments for mass spectrometric analysis.
MALDI analysis
After digestion, 0.5 µl of the sample was spotted on a dried droplet of matrix (0.5 µl of saturated 3-hydroxy picolinic acid in 50% acetonitrile containing 10 mg/ml dibasic ammonium citrate) on a stainless steel target plate (Scout™ 384, Bruker Daltonik, Germany). Fragment analysis was carried out on a Biflex III mass spectrometer (Bruker Daltonik). Mass spectra were recorded in negative ion mode with an acceleration voltage of 19 kV, IS/2 potentials of 16.85–17.45 kV (depending on the selected mass range) and an extraction delay of 400 ns. Usually, 80–100 shots were accumulated per sample spot, before spectra were smoothed (Golay-Savitzky) and baseline-corrected.
For spectra interpretation, RNA fragment patterns resulting from RNase T1 digest of the transcribed STR sequence were calculated by RnaseCut 1.01 software available at our homepage (http://www.vetmed.uni-muenchen.de/gen/forschung.html) (19).
Gel electrophoretic analysis
For fragment length determination of STR alleles, samples were amplified with fluorescent-labelled primer pairs and analysed on an ABI 377 automated sequencer using 4% denaturing polyacrylamide gels. Scoring was performed with Genotyper 2.0 software.
Sequencing
Cycle sequencing of STR alleles was performed with the DYEnamic ET Terminator Cycle Sequencing Kit (Amersham Pharmacia Biotech) according to the manufacturer’s recommendations. Both amplification primers were used as sequencing primers to ensure unambiguous results. Prior to gel analysis, samples were purified from surplus DYE-dideoxy-terminators on a membrane filtration plate (Multiscreen SEQ, Millipore, Bedford, MA). Automated sequence analysis was performed on an ABI Prism 377 using DNA sequencing software 2.1.1.
RESULTS AND DISCUSSION
Genotyping of simple STR loci
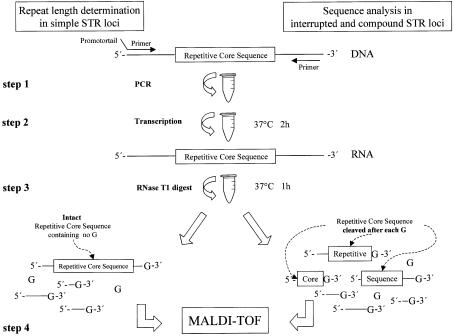
Four simple di- (RM067, BM1224) and trinucleotide repeats (BMS3004, BMS3013) were chosen as model loci for mass spectrometric analysis (Table 1). For PCR amplification (Fig. 1, step 1), primer tailing was adapted to the type of repeat in the investigated locus. CA- and CCA-loci were amplified using 5′ promoter-tagged forward primers in order to obtain RNA transcripts from the sense strand of the PCR product, with no guanosine in the repeat region, while PCR of GT- and GGT-repeats was done with 5′ promoter-tagged reverse primers, respectively. This resulted in RNA transcripts of the desired complementary strand of the amplicon during in vitro transcription (Fig. 1, step 2). Subsequently, a base-specific cleavage reaction was performed by digestion of the transcript with RNase T1 (Fig. 1, step 3). Incubation with this enzyme resulted in G-specific enzymatic decomposition of the RNA transcript. This allowed for the generation of allele-specific digestion patterns with relative long fragments arising from the intact repetitive core sequence and regularly smaller fragments from the flanking regions, which subsequently were analysed by MALDI-TOF (Fig. 1, step 4).
Figure 1.
Assay design for repeat length determination in simple repeats and enhanced sequence analysis in interrupted and compound microsatellites. STR loci are amplified with promoter-tagged primers (step 1) and transcribed into RNA by viral RNA polymerases (step 2). A G-specific RNA cleavage reaction is performed (step 3) to extract the intact repetitive core sequence (containing no G) from the full-length transcript in simple STRs. The resulting fragments then are analysed according to the number of repeat units (step 4). However, cleavage of RNA transcripts from interrupted and compound STRs containing Gs in the repetitive core sequence, allows for further characterisation of mutational events by MALDI-TOF analysis of the cleavage products (step 4).
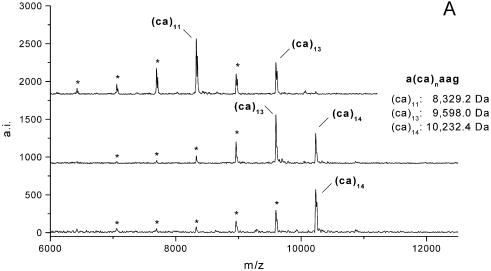
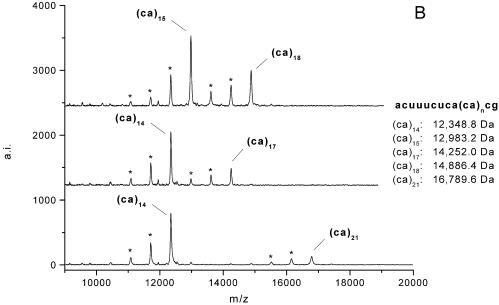
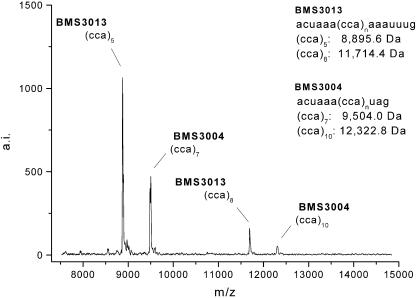
In all four loci, G-specific digestion resulted in characteristic fragment patterns of the molecular masses calculated by RNaseCut software (19) before. Figures 2 and 3 show representative MALDI-TOF mass spectra of the dinucleotide repeats RM067 (Fig. 2A) and BM1224 (Fig. 2B) and the trinucleotide repeats BMS3004 and BMS3013 (Fig. 3).
Figure 2.
Genotyping examples in simple dinucleotide repeat loci. At locus RM067 (A) the upper spectrum shows alleles of 11 and 13 CA-repetitions within the repetitive core sequence of a heterozygous animal. Another animal was heterozygous for alleles of 13 and 14 repeat units (second spectrum), whereas the animal in the lower spectrum was homozygous for 14 CA-repetitions. (B) Typical mass spectra recorded for locus BM1224 are displayed. All animals shown were heterozygous at this locus for alleles of 15 and 18 (upper spectrum), 14 and 17 (second spectrum) and 14 and 21 repeat units (lower spectrum), respectively. Peaks marked by an asterisk in both illustrations correspond to shadow peaks due to amplification artefacts.
Figure 3.
Multiplexing example of two simple trinucleotide STRs. Simultaneous amplification, transcription and digestion of the STR loci BMS3004 and BMS3013. The examined animal is heterozygous at both loci for alleles containing 5 and 8 CCA-repeat units at locus BMS3013 and for alleles of 7 and 10 CCA-repetitions at locus BMS3004.
In all loci, alleles could unambiguously be assigned to their number of repeat units in the repetitive core sequence and all genotypes determined by MALDI-TOF analysis completely agreed with results from conventional polyacrylamide gel electrophoresis (PAGE). In digestion patterns of loci RM067 and BM1224, ‘shadow peaks’ (mass signals marked by an asterisk in Fig. 2) corresponding to loss of one or more repeat units were detected in addition to mass signals of the true STR length. These mass signals were less intense than correct allele peaks and arose from artefacts known to occur during PCR amplification of dinucleotide repeats (21,22).
RNase T1-mediated cleavage of in vitro transcripts simplified RNA-based genotyping of STR sequences in several ways. First, G-specific cleavage of the transcript fully eliminated 3′-heterogeneities produced by viral RNA polymerases (14,23). Heterogeneous 3′-ends of the transcripts were cleaved off after the last guanosine during RNase T1 digest, which is proven to be of particular importance for unambiguous and correct allele assignment (12).
Second, G-specific cleavage of long RNA transcripts resulted in sequence dependent fragment patterns of relative small products. Short stretches of nucleotides are known to generate more intense and sharper ion signals in mass spectrometric analysis due to higher stability and less interference with residual sample impurities (7,24). Hence, reproducible spectra quality is easily obtained, which also favours an automated data acquisition and interpretation process, a prerequisite for high sample throughput.
In addition, this approach provided full flexibility in primer design. Since base-specific cleavage of long RNA transcripts results in a mixture of small nucleotide fragments, there are no constraints concerning primer positioning, e.g. there is no need to position PCR primers near to the repetitive core sequence in order to obtain short products for mass spectrometric analysis. In fact, full-length transcripts can reach lengths of up to 1 kb without negative effects on genotyping results (data not shown) and thereby enable additional comparative sequence analysis of the flanking regions.
Compared to STR genotyping by hammerhead-cleaved RNA transcripts, primer design for subsequent enzymatic cleavage reactions is very straightforward. Specific cleavage of RNA by autocatalytic hammerhead sequences requires elaborate primer design of the ‘hammerhead’-tagged primer in order to ensure the correct secondary structure of the RNA transcript. In contrast, only one promoter-tagged primer is needed to insert the promoter sequence for transcription and subsequent enzymatic cleavage. Though enzymatic cleavage reactions are proven to be affected by secondary structure as well (25,26), uniform cleavage is easily performed under denaturing conditions as described in Materials and Methods.
Nevertheless, it is necessary to pay attention to one criterion in primer design. Since fragment masses strictly depend on STR sequence, care should be taken to ensure that no peaks arising from the flanking sequence overlap with possible allele peaks. This can easily be proven by mass calculation with RnaseCut 1.01 software.
Last but not least, base-specific cleavage of RNA transcripts allowed complete multiplex analysis of STR loci (Fig. 3), which is of considerable importance concerning short analysis time and low costs per genotype. Simultaneous handling of two or more loci is easily accomplished, when PCR primers are tagged with one promoter sequence so that PCR products can be transcribed in one transcription system. However, different loci can by chance exhibit similar or even identical allele masses, since fragment masses after base-specific cleavage depend on the STR sequence. Those loci clearly restrict multiplexing as soon as the mass difference between allele signals becomes too small to be resolved sufficiently. Nevertheless, in such cases it is still possible to amplify these loci simultaneously in one PCR using different promoter tags and then split for transcription in different transcription systems.
Determination of sequence variation in interrupted and compound STRs
In a second part of the work, RNase T1 digest of RNA transcripts was used to investigate the molecular structure of alleles in interrupted and compound microsatellites. Two interrupted STRs (BM1824 and BMS1561) and two loci compound of different repeat stretches (BM315 and INRA037) were employed as model loci for evaluation.
In order to obtain information about the molecular allele structure, cleavage sites within the repetitive core sequence were utilised during RNase T1 digest. Thus, the repetitive core sequence itself was split up into distinct fragments, which then were analysed by mass spectrometry (Fig. 1). In combination with allele size information from routine gel electrophoresis, mass spectrometric results were used to predict the repeat sequence of an examined STR allele. For confirmation of proposed allele structures, sequencing was performed as described in Materials and Methods.
In the following, locus BM315 is chosen to demonstrate spectra interpretation and sequence analysis is more detailed.
The polymorphic core sequence of locus BM315 is composed of two CA-stretches and two strings of CACG-repetitions (Tables 1 and 2). G-specific cleavage of the sense transcript resulted in enzymatic decomposition of the CACG-components into tetranucleotide fragments while pure CA-stretches remained intact and could be investigated concerning their number of dinucleotide repetitions.
Table 2. STR locus BM315: gel electrophoretic allele sizes in bp, repetitive core sequences and cleavage products resulting from G-specific endonuclease digest of the investigated transcript.
| BM315 (n = 102) |
|
…acaaucacacacacacacacacacacgcacgcacacacacgcacgcacgcacg… |
|||
|---|---|---|---|---|---|
| Allele size in bp |
Seq. |
Repetitive core sequence |
Cleavage products from repetitive core sequence |
||
| acaau(ca)ncacg | (ca)3cacg 3206.0 Da | cacg 1302.8 Da | |||
| 106 | X | (ca)14(cacg)2 | (ca)14: 11 783.4 Da | 1x | |
| 106 | X | (ca)10(cacg)4 | (ca)10: 9245.8 Da | 3x | |
| 108 | (ca)11(cacg)4 | (ca)11: 9980.2 Da | 3x | ||
| 110 | (ca)16(cacg)2 | (ca)16: 13 052.2 Da | 1x | ||
| 110 | (ca)12(cacg)4 | (ca)12: 10 514.6 Da | 3x | ||
| 112 | (ca)17(cacg)2 | (ca)17: 13 686.6 Da | 1x | ||
| 112 | (ca)13(cacg)4 | (ca)13: 11 149.0 Da | 3x | ||
| 114 | X | (ca)7(cacg)2(ca)3(cacg)2 | (ca)07: 7342.6 Da | 1x | 2x |
| 114 | (ca)18(cacg)2 | (ca)18: 14 321.0 Da | 1x | ||
| 116 | (ca)19(cacg)2 | (ca)19: 14 955.4 Da | 1x | ||
| 118 | (ca)20(cacg)2 | (ca)20: 15 589.8 Da | 1x | ||
| 118 | (ca)16(cacg)4 | (ca)16: 13 052.2 Da | 3x | ||
| 118 | (ca)14(cacg)5 | (ca)14: 11 783.4 Da | 4x | ||
| 120 | X | (ca)10(cacg)2(ca)3(cacg)2 | (ca)10: 9245.8 Da | 1x | 2x |
| 120 | (ca)13(cacg)6 | (ca)13: 11 149.0 Da | 5x | ||
| 122 | (ca)16(cacg)5 | (ca)16: 13 052.2 Da | 4x | ||
| 122 | (ca)14(cacg)6 | (ca)14: 11 783.4 Da | 5x | ||
| 124 | (ca)17(cacg)5 | (ca)17: 13 686.6 Da | 4x | ||
| 126 | (ca)18(cacg)5 | (ca)18: 14 321.0 Da | 4x | ||
| 126 | (ca)16(cacg)6 | (ca)16: 13 052.2 Da | 5x | ||
| 126 | (ca)14(cacg)7 | (ca)14: 11 783.4 Da | 6x | ||
| 128 | (ca)19(cacg)5 | (ca)19: 14 955.4 Da | 4x | ||
| 128 | (ca)17(cacg)6 | (ca)17: 13 686.6 Da | 5x | ||
| 128 | (ca)15(cacg)7 | (ca)15: 12 417.8 Da | 6x | ||
| 130 | X | (ca)18(cacg)6 | (ca)18: 14 321.0 Da | 5x | |
| 130 | (ca)16(cacg)7 | (ca)16: 13 052.2 Da | 6x | ||
| 132 | (ca)19(cacg)6 | (ca)19: 14 955.4 Da | 5x | ||
| 134 | (ca)20(cacg)6 | (ca)20: 15 589.8 Da | 5x | ||
| 134 | (ca)18(cacg)7 | (ca)18: 14 321.0 Da | 6x | ||
| 134 | (ca)14(cacg)9 | (ca)14: 11 783.4 Da | 8x | ||
| 136 | (ca)23(cacg)5 | (ca)23: 17 494.8 Da | 4x | ||
Repetitive core sequences confirmed by sequencing are marked with a cross.
Examination of 102 samples by PAGE revealed 16 alleles ranking from 106 to 136 bp of total length. In mass spectrometric analysis of G-specific cleavage products only alleles of 114 and 120 bp exhibited the characteristic peak pattern [containing the fragments ACAAU(CA)nCACG, (CA)3CACG and CACG] as expected from the published reference sequence (Table 2). In all other alleles the mass signal at 3206 Da from a fragment of the sequence (CA)3CACG was not found. Since no other mass signal was detected in these spectra that could have been derived from gain or loss of one or multiple CA-units in this fragment, it was concluded that these alleles completely lack this part of the core sequence.
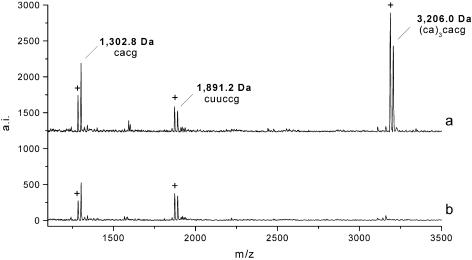
Figure 4 displays a mass window of two variant peak patterns at locus BM315. In the spectrum of sample a the fragment mass of 3206 Da is detected, whereas this signal in sample b is not observed due to different composition of the repetitive core sequence. Peaks marked by a cross (+) in this figure correspond to 2′,3′-cyclic phosphates intermediates of the digestion products (17). The mass peak at 1302 Da corresponds to multiple fragments of the sequence CACG from the tetranucleotide repeat stretch of the polymorphic core sequence, while the mass signal at 1891 Da arises from the flanking sequence.
Figure 4.
Mass window of two variant peak patterns at locus BM315. In spectrum a G-specific cleavage of the repetitive core sequence results in mass signals at 1.302 and 3.206 Da for the corresponding fragments CACG and (CA)3CACG. In spectrum b no signal is observed for the fragment (CA)3CACG, due to a variant composition of the repetitive core sequence. Peaks marked by a cross correspond to 2′,3′-cyclic phosphate intermediates of the cleavage products. The mass signal at 1.891 Da arises from a fragment of the flanking region
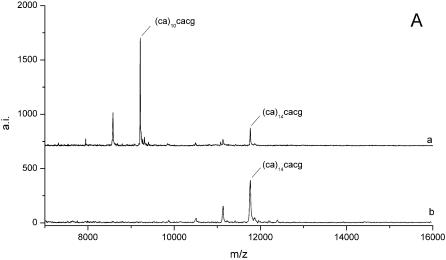
Furthermore, it could be ascertained that alleles of identical repeat length can arise from different sequence variants. In MALDI analysis these variants were identified due to distinct alterations in fragment patterns. Figure 5A compares mass spectra of two samples with gel electrophoretic allele sizes of 106 bp. After G-specific cleavage a mass signal corresponding to a fragment of 14 CA-repetitions [fragment ACAAU(CA)14CACG] was detected in sample b. In sample a an additional fragment containing 10 CA-units [fragment ACAAU(CA)10CACG] was observed. Since both peak patterns obtained no signal corresponding to a further CA-stretch [fragment (CA)nCACG], two sequence variants of (CA)10(CACG)4 and (CA)14(CACG)2 were assumed for PAGE fragment sizes of 106 bp at this locus. Subsequently, both allele sequences have been confirmed by sequencing. Thus, repeat structure analysis by MALDI-TOF allowed for discrimination between real homozygous samples with uniform allele size and allele sequence and heterozygous samples of same allele size but different underlying sequences.
Figure 5.
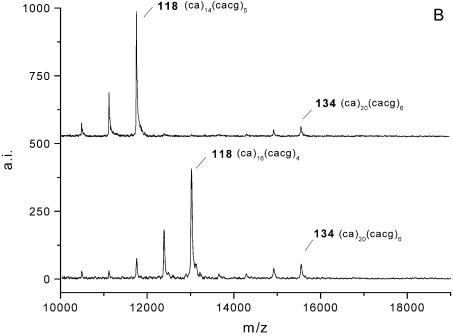
Mass spectra from RNase T1-mediated cleavage in samples with total allele sizes of 106 bp (A) and samples heterozygous for allele sizes of 118 and 134 bp (B). In both illustrations further information from the repetitive core sequences allowed clearly differentiated samples, which are indistinguishable by gel electrophoretic mobility. Allele denotation is composed of gel electrophoretic determined allele size and the repetitive core sequence assumed from mass spectrometric fragment analysis.
In addition, Figure 5B shows mass spectra of two samples with identical genotypes of 118/134 bp detected by PAGE. Despite of identical gel electrophoretic genotypes, mass spectrometric analysis clearly enabled differentiation between these two samples as well, since both exhibited the same repetitive core sequence for allele 134 but unambiguously differed in repeat sequence for allele 118.
Sequence analysis at this locus allowed for unambiguous characterisation of both CA-stretches within the repetitive core sequence but lacked for further information concerning the number of CACG repetitions, since this tetranucleotide stretch was cleaved to multiple fragments of identical mass (1302.8 Da) and thus resulted in one mass signal. Therefore, allele size information from PAGE and sequence information from mass spectrometric analysis were combined to propose the most likely repeat sequence for all 16 PAGE alleles detected at this locus. Sequencing was performed in several alleles from different structural classes in order to verify our results.
Fragment sizes, composition of the repetitive core sequences and fragments observed after G-specific cleavage of the repetitive core sequences in locus BM315 are assorted in Table 2.
As displayed in Table 2 MALDI-based sequence analysis at locus BM315 revealed far higher allelic variability than evident from gel electrophoretic genotyping of fragment lengths. PAGE analysis distinguished a total of 16 alleles in this locus, whereas in combination with MALDI-TOF analysis differentiation of 31 allelic states was possible.
In addition to results presented in detail, we successfully performed sequence analysis in three more loci, one composed of two repetitive elements (INRA037) (Table 3) and two interrupted STRs (BM1824 and BMS1561) (Tables 4 and 5). In these loci MALDI analysis of STR alleles revealed several complexities in allelic variation as well, and allowed for enhanced accuracy in STR allele characterisation compared to gel electrophoretic separation.
Table 3. STR locus INRA037: gel electrophoretic allele sizes in bp, repetitive core sequences and cleavage products resulting from G-specific endonuclease digest of the investigated transcript.
| INRA037 (n = 103) |
|
…caugcaugcaugcaugcacacacacacacacacacacacauauacaug… |
|||
|---|---|---|---|---|---|
| Allele size in bp |
Seq. |
Repetitive core sequence |
Cleavage products from repetitive core sequence |
|
|
| caug 1303.8 Da | (ca)2cg 1937.2 Da | (ca)nauauacaug | |||
| 117 | (caug)3(ca)12 | 3x | (ca)12: 10 187.4 Da | ||
| 119 | (caug)4(ca)2cg(ca)8 | 4x | 1x | (ca)08: 7649.8 Da | |
| 121 | (caug)3(ca)14 | 3x | (ca)14: 11 456.2 Da | ||
| 121 | (caug)4(ca)2cg(ca)9 | 4x | 1x | (ca)09: 8284.2 Da | |
| 123 | (caug)3(ca)15 | 3x | (ca)15: 12 090.6 Da | ||
| 125 | (caug)3(ca)16 | 3x | (ca)16: 12 725.0 Da | ||
| 125 | X | (caug)4(ca)14 | 4x | (ca)14: 11 465.2 Da | |
| 125 | X | (caug)4(ca)2cg(ca)11 | 4x | 1x | (ca)11: 9553.0 Da |
| 125 | (caug)3(ca)2cg(ca)13 | 3x | 1x | (ca)13: 10 821.8 Da | |
| 127 | (caug)3(ca)17 | 3x | (ca)17: 13 359.4 Da | ||
| 127 | (caug)4(ca)15 | 4x | (ca)15: 12 090.6 Da | ||
| 127 | (caug)2(ca)19 | 2x | (ca)19: 14 628.2 Da | ||
| 129 | (caug)3(ca)18 | 3x | (ca)18: 13 993.8 Da | ||
| 129 | (caug)6(ca)12 | 6x | (ca)12: 10 187.4 Da | ||
| 129 | X | (caug)3(ca)2cg(ca)15 | 3x | 1x | (ca)15: 12 090.6 Da |
| 131 | (caug)3(ca)19 | 3x | (ca)19: 14 628.2 Da | ||
| 131 | (caug)3(ca)2cg(ca)16 | 3x | 1x | (ca)16: 12 725.0 Da | |
| 133 | (caug)2(ca)22 | 2x | (ca)22: 16 531.4 Da | ||
| 135 | (caug)3(ca)2cg(ca)18 | 3x | 1x | (ca)18: 13 993.8 Da | |
| 137 | (caug)3(ca)22 | 3x | (ca)22: 13 052.2 Da | ||
| 141 | (caug)2(ca)26 | 2x | (ca)26: 19 069.0 Da | ||
| 143 | (caug)3(ca)25 | 3x | (ca)25: 18 343.6 Da | ||
| 145 | (caug)3(ca)26 | 3x | (ca)26: 19 069.0 Da | ||
Repetitive core sequences confirmed by sequencing are marked with a cross.
Table 4. STR locus BM1824: gel electrophoretic allele sizes in bp, repetitive core sequences and cleavage products resulting from G-specific endonuclease digest of the investigated transcript.
| BM1824 (n = 47) |
|
…caacuaacacacacacacacacacacacacacacacgcacag… |
||
|---|---|---|---|---|
| Allele size in bp |
Seq. |
Repetitive core sequence |
Cleavage products from repetitive core sequence |
|
| caacua(ac)n(a)g | cacag 1632.0 Da | |||
| 178 | (ac)12 | caacua(ac)12ag: 10 208.8 Da | ||
| 180 | X | (ac)13 | caacua(ac)13ag: 10 843.2 Da | |
| 182 | (ac)14 | caacua(ac)14ag: 11 477.6 Da | ||
| 184 | (ac)15 | caacua(ac)15ag: 12 112.0 Da | ||
| 188 | X | (ac)15gcac | caacua(ac)15g: 11 782.8 Da | 1x |
| 190 | (ac)16gcac | caacua(ac)16g: 12 417.2 Da | 1x | |
| 192 | (ac)19 | caacua(ac)19ag: 14 649.6 Da | ||
Repetitive core sequences confirmed by sequencing are marked with a cross.
Table 5. STR locus BMS1561: gel electrophoretic allele sizes in bp, repetitive core sequences and cleavage products resulting from G-specific endonuclease digest of the investigated transcript.
| BMS1561 (n = 35) |
|
…auccauccauccauccauccauccauccguccauccauug… |
|||
|---|---|---|---|---|---|
| Allele size in bp |
Seq. |
Repetitive core sequence |
Cleavage products from repetitive core sequence |
|
|
| (ccau)nccg | uccg 1279.8 Da | u(ccau)2ug 3467.2 Da | |||
| 109 | (ccau)3ccgu(ccau)2 | (ccau)3: 5346.4 Da | 1x | ||
| 121 | X | (ccau)6ccgu(ccau)2 | (ccau)6: 9083.8 Da | 1x | |
| 121 | X | (ccau)5ccguccgu(ccau)2 | (ccau)5: 7838.0 Da | 1x | 1x |
Repetitive core sequences confirmed by sequencing are marked with a cross.
In three of four loci investigated, real allelic diversity based on allele sequence was proven to be higher than expected from PAGE analysis. For example, in locus INRA037 23 alleles could be distinguished based on allele sequence compared to 14 allelic states differing in allele size.
Similar to compound STR loci additional sequence information was obtained in interrupted loci as well. Locus BMS1561 exhibited two sequence variants of allele 121, one of them containing a duplication of the interrupted repeat unit (Table 5). In STR BM1824 equal numbers of alleles could be distinguished by PAGE and mass spectrometric analysis (Table 4). Nevertheless, MALDI-TOF analysis improved accuracy of allele determination in this locus as well, since only two of the seven alleles observed at this locus were proven to contain the repeat interruption described in the published reference sequence.
Taken together, sequence specificity of the RNase T1 digest and mass accuracy from MALDI-TOF analysis permitted rapid and accurate determination of mutational processes in STR alleles to an extent that otherwise would have required sequencing.
However, some limitations had to be noticed, which in certain cases can restrict information content from STR sequences.
First, a problem well known to occur in MALDI analysis of RNA fragments is the insufficient resolution of uracil and cytosine, which differ by only 1 Da. This can dramatically reduce information content of peak patterns, when fragments of similar base composition differing only in few cytosine or uracil bases result in one unresolved mass signal. To overcome this problem, modified ribonucleotide triphosphates such as α-thio or 5-methyl base-modified analogues can be employed during transcription, leading to clearly separated masses for all four ribonucleotides due to a modification-dependent mass shift (19,20).
Second, in MALDI analysis of fragment patterns no quantitative spectra interpretation was possible. Unique peaks (mass signals resulting from only one distinct fragment) were not necessarily less intense than multiple peaks (signals generated from two or more fragments of identical mass). As revealed in locus BM315 (Fig. 4) the mass peak at 1302 Da is less intense than the signal at 3206 Da, though multiple fragments of the sequence CACG generate this peak, while the higher signal at 3206 Da is a unique peak arising from the fragment (CA)3CACG. Therefore, in structural analysis of complex loci additional knowledge about total allele size is indicated to ensure correct spectra interpretation.
Finally, assay design needs to be adapted to the type of repeat. Information content available from base-specific cleavage can vary from highly informative to almost no extra information depending on sequence combination (e.g. fragment patterns containing a large number of fragment overlaps are less informative than unique fragment patterns). Assay design can be adapted by use of other base-specific endonucleases than RNase T1, e.g. RNase A, which cleaves after C and U or can be made monospecific if either C or U is replaced by its nuclease resistant analogue. Moreover, use of modified and therefore mass-shifted ribonucleotides and cleavage of the forward and/or reverse transcript of the STR sequence can simplify spectra interpretation as well as enhance information content from MALDI-TOF analysis, especially in more complex loci. Most appropriate assay conditions for a given STR sequence can easily be ascertained by use of RnaseCut software (19). This program allows pre-definition of RNase, primer tailing and ribonucleotides before calculation of theoretical digest spectrums in form of peak lists, sequence lists and corresponding graphics. Thus, runs can be theoretically simulated and optimised prior to starting laboratory work.
CONCLUSIONS
We have demonstrated that MALDI-TOF analysis of base-specific cleaved RNA transcripts is a powerful tool for both, reliable determination of simple repeat length and further characterisation of sequence variation in interrupted and compound loci. The main goal of this approach is the generation of high informative fragment patterns by use of a base-specific cleavage reaction. This permits mass spectrometric analyses of small fragments containing sequence information of the repetitive core sequence and flanking regions of a STR allele. The flexibility and robustness of the described approach, together with analytical advantages from the application of MALDI-TOF mass spectrometry allow for high accuracy in STR allele designation to an extent that would otherwise have required allele sequencing. Thus, we believe this approach to provide a valuable tool for all fields of genomic research where STR loci are to be used to their full potential.
Acknowledgments
ACKNOWLEDGEMENTS
The authors gratefully thank the Tierzuchtforschung e.V. München for financial support.
REFERENCES
- 1.Griffin T.J. and Smith,L.M. (2000) Single-nucleotide polymorphism analysis by MALDI-TOF mass spectrometry. Trends Biotechnol., 18, 77–84. [DOI] [PubMed] [Google Scholar]
- 2.Bray M.S., Boerwinkle,E. and Doris,P.A. (2001) High-throughput multiplex SNP genotyping with MALDI-TOF mass spectrometry: practice, problems and promise. Hum. Mutat., 17, 296–304. [DOI] [PubMed] [Google Scholar]
- 3.Sauer S., Lehrach,H. and Reinhardt,R. (2003) MALDI mass spectrometry analysis of single nucleotide polymorphisms by photocleavage and charge-tagging. Nucleic Acids Res., 31, e63. [DOI] [PMC free article] [PubMed] [Google Scholar]
- 4.Wise C.A., Paris,M., Morar,B., Wang,W., Kalaydjieva,L. and Bittles,A.H. (2003) A standard protocol for single nucleotide primer extension in the human genome using matrix-assisted laser desorption/ionisation time-of-flight mass spectrometry. Rapid Commun. Mass Spectrom., 17, 1195–1202. [DOI] [PubMed] [Google Scholar]
- 5.Werner M., Sych,M., Herbon,N., Illig,T., Konig,I.R. and Wjst,M. (2002) Large-scale determination of SNP allele frequencies in DNA pools using MALDI-TOF mass spectrometry. Hum. Mutat., 20, 57–64. [DOI] [PubMed] [Google Scholar]
- 6.Nordhoff E., Kirpekar,F., Karas,M., Cramer,R., Hahner,S., Hillenkamp,F., Kristiansen,K., Roepstorff,P. and Lezius,A. (1994) Comparison of IR- and UV-matrix-assisted laser desorption/ionization mass spectrometry of oligonucleotides. Nucleic Acids Res., 22, 2460–2465. [DOI] [PMC free article] [PubMed] [Google Scholar]
- 7.Shaler T.A., Wickham,J.N., Sannes,K.A., Wu,K.J. and Becker,C.H. (1996) Effect of impurities on the matrix-assisted laser desorption mass spectra of single-stranded oligodeoxynucleotides. Anal. Chem., 68, 576–579. [DOI] [PubMed] [Google Scholar]
- 8.Ross P.L. and Belgrader,P. (1997) Analysis of short tandem repeat polymorphisms in human DNA by matrix-assisted laser desorption/ionization mass spectrometry. Anal. Chem., 69, 3966–3972. [DOI] [PubMed] [Google Scholar]
- 9.Ross P.L., Davis,P.A. and Belgrader,P. (1998) Analysis of DNA fragments from conventional and microfabricated PCR devices using delayed extraction MALDI-TOF mass spectrometry. Anal. Chem., 70, 2067–2073. [DOI] [PubMed] [Google Scholar]
- 10.Braun A., Little,D.P., Reuter,D., Müller-Mysok,B. and Köster,H. (1997) Improved analysis of microsatellites using mass spectrometry. Genomics, 46, 18–23. [DOI] [PubMed] [Google Scholar]
- 11.Bonk T., Humeny,A., Gebert,J., Sutter,C., von Knebel Doeberitz,M. and Becker,C.M. (2003) Matrix-assisted laser desorption/ionization time-of-flight mass spectrometry-based detection of microsatellite instabilities in coding DNA sequences: a novel approach to identify DNA-mismatch repair-deficient cancer cells. Clin. Chem., 49, 552–561. [DOI] [PubMed] [Google Scholar]
- 12.Krebs S., Seichter,D. and Förster,M. (2001) Genotyping of dinucleotide tandem repeats by MALDI mass spectrometry of ribozyme-cleaved RNA transcripts. Nat. Biotechnol., 19, 877–880. [DOI] [PubMed] [Google Scholar]
- 13.Nordhoff E., Karas,M., Hillenkamp,F., Kirpekar,F., Kristiansen,K. and Roepstorff,P. (1993) Ion stability of nucleic acids in infrared matrix-assisted laser desorption/ionization mass spectrometry. Nucleic Acids Res., 21, 3347–3357. [DOI] [PMC free article] [PubMed] [Google Scholar]
- 14.Kirpekar F., Nordhoff,E., Kristiansen,K., Roepstorff,P., Lezius,A., Hahner,S., Karas,M. and Hillenkamp,F. (1994) Matrix assisted laser desorption/ionization mass spectrometry of enzymatically synthesized RNA up to 150 kDa. Nucleic Acids Res., 22, 3866–3870. [DOI] [PMC free article] [PubMed] [Google Scholar]
- 15.Little D.P., Thannhauser,T.W. and McLafferty,F.W. (1995) Verification of 50- to 100-mer DNA and RNA sequences with high-resolution mass spectrometry. Proc. Natl Acad. Sci. USA, 92, 2318–2322. [DOI] [PMC free article] [PubMed] [Google Scholar]
- 16.Hahner S., Lüdemann,H.C., Kirpekar,F., Nordhoff,E., Roepstorff,P., Galla,H.J. and Hillenkamp,F. (1997) Matrix-assisted laser desorption/ionization mass spectrometry (MALDI) of endonuclease digests of RNA. Nucleic Acids Res., 25, 1957–1964. [DOI] [PMC free article] [PubMed] [Google Scholar]
- 17.Kirpekar F., Douthwaite,S. and Roepstorff,P. (2000) Mapping posttranscriptional modifications in 5S ribosomal RNA by MALDI mass spectrometry. RNA, 6, 296–306. [DOI] [PMC free article] [PubMed] [Google Scholar]
- 18.Gabler A., Krebs,S., Seichter,D. and Förster,M. (2003) Fast and accurate determination of sites along the FUT2 in vitro transcript that are accessible to antisense oligonucleotides by application of secondary structure predictions and RNase H in combination with MALDI-TOF mass spectrometry. Nucleic Acids Res., 15, e79. [DOI] [PMC free article] [PubMed] [Google Scholar]
- 19.Krebs S., Meðugorac,I., Seichter,D. and Förster,M. (2003) RnaseCut: a MALDI mass spectrometry-based method for SNP discovery. Nucleic Acids Res., 31, e37. [DOI] [PMC free article] [PubMed] [Google Scholar]
- 20.Hartmer R., Storm,N., Boecker,S., Rodi,C.P., Hillenkamp,F., Jurinke,C. and van den Boom,D. (2003) RNase T1 mediated base-specific cleavage and MALDI-TOF MS for high-throughput comparative sequence analysis. Nucleic Acids Res., 31, e47. [DOI] [PMC free article] [PubMed] [Google Scholar]
- 21.Murray V., Monchawin,C. and England,P.R. (1993) The determination of the sequences present in the shadow bands of a dinucleotide repeat PCR. Nucleic Acids Res., 21, 2395–2398. [DOI] [PMC free article] [PubMed] [Google Scholar]
- 22.Bovo D., Rugge,M. and Shiao,Y.H. (1999) Origin of spurious multiple bands in the amplification of microsatellite sequences. Mol. Pathol., 52, 50–51. [DOI] [PMC free article] [PubMed] [Google Scholar]
- 23.Milligan J.F., Groebe,D.R., Witherell,G.W. and Uhlenbeck,O.C. (1987) Oligoribonucleotide synthesis using T7 RNA polymerase and synthetic DNA templates. Nucleic Acids Res., 15, 8783–8798. [DOI] [PMC free article] [PubMed] [Google Scholar]
- 24.Nordhoff E., Kirpekar,F., Karas,M., Cramer,R., Hahner,S., Hillenkamp,F., Kristiansen,K., Roepstroff,P. and Lezius, A. (1994) Comparison of IR- and UV-matrix-assisted laser desorption/ionization mass spectrometry of oligodeoxynucleotides. Nucleic Acids Res., 22, 2460–2465. [DOI] [PMC free article] [PubMed] [Google Scholar]
- 25.Peattie D.A. (1979) Direct chemical method for sequencing RNA. Proc. Natl Acad. Sci. USA, 76, 1760–1764. [DOI] [PMC free article] [PubMed] [Google Scholar]
- 26.Waldmann R., Gross,H.J. and Krupp,G. (1987) Protocol for rapid chemical RNA sequencing. Nucleic Acids Res., 15, 7209. [DOI] [PMC free article] [PubMed] [Google Scholar]


