

Abstract
We developed a single-molecule four-color FRET technique both in confocal and in total-internal-reflection fluorescence microscopies. Real-time determination of six inter-fluorophore FRET efficiencies allowed us to probe the correlated motion of four arms of the Holliday junction. The technique was also applied to assess the correlation of RecA-mediated strand exchange events at both ends of a synaptic complex.
Keywords: FRET, Holliday junction dynamics, RecA-mediated strand exchange, Single-molecule studies
Single-molecule FRET (Fluorescence Resonance Energy Transfer)[1] has provided unprecedented details on fundamental processes in biology[2]. However, information of single inter-fluorophore distances in conventional two-color FRET is insufficient to capture the intrinsic complexity of many biological systems. To cope with this challenge, single-molecule multi-color FRET techniques have been developed[3–8], and the capability of three-color FRET detection has been utilized to solve a number of important biological problems[9–12]. As single-molecule FRET approaches are being expanded to include more complex biological systems, there is an ever increasing demand for more advanced FRET techniques. In this communication, we report the developement of a single-molecule four-color FRET technique implemented for both confocal, and TIRF (Total Internal Reflection Fluorescence) microscopies, which can determine six inter-fluorophore FRET efficiencies in real time. As proof-of-the-concept experiments, the technique was applied to observe the correlated motions of four arms of the Holliday junction, and investigate the correlation of RecA-mediated strand exchange events at both ends of a synaptic complex.
Realization of a reliable single-molecule four-color FRET requires four fluorophores with high photostability and clear spectral separation. However, it has been impractical to use more than three fluorophores in single-molecule FRET measurements due to large crosstalks between fluorophores limited in the visible range. Recent introduction of a highly photostable infrared fluorophore, Cy7, to the single-molecule three-color FRET technique opened a new way to realize single-molecule four-color FRET with both negligible spectral overlap and long observation time on the condition that we find an optimum blue fluorophore with high photostability and clear spectral separation from the dye trio of Cy3-Cy5-Cy7 (550-nm to 850-nm)[13]. Among candidates of blue fluorophores which we tested (Cy2, Alexa488, Atto488 and DyLight488, Supporting Information Table 1), we selected Cy2. The key advantages of Cy2 are a small spectral overlap with Cy3 (Supporting Information Figure 1a), and a low probability of a red-shifted state (Supporting Information Figure 2). We note that the increased distance sensitivity of the Cy2-Cy7 FRET pair may be utilized in applications measuring small distance changes (Supporting Information Figure 1b). In applications requiring longer FRET ranges (Supporting Information Figure 1d), and a longer observation time (Supporting Information Table 2), conventional blue dyes, for example Alexa488, may be used (Supporting Information Figure 1c, d), even though multi-state behaviour of Alexa488 might hinder a precise FRET assignment[14].
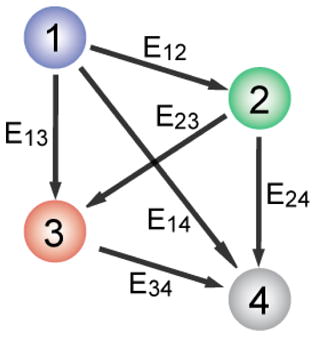
There are a total of six inter-dye distances to be determined in four-color FRET. To recover all the information necessary to calculate six inter-dye distances, we developed an approach to use three independent excitation lasers: a red laser (633-nm or 640-nm) for Cy5, a green laser (532-nm) for Cy3, and a blue laser (473-nm) for Cy2 or Alexa488 excitations (Figure 1). A detailed scheme of FRET calculation is described in Supporting Information. Briefly, the FRET efficiency of Cy5-Cy7 pair (E34) is determined via red excitation (Figure 1, left). Next, FRET efficiencies of Cy3-Cy5 (E23) and Cy3-Cy7 (E24) are determined at green excitation on the basis of E34 (Figure1, middle). Finally, the remaining three FRET efficiencies (E12, E13, and E14) are determined at blue excitation based on the three FRET efficiencies that have been previously determined (Figure 1, right). The sequential determination of FRET efficiencies in real time was achieved by alternating three excitation lasers on a faster time scale than the conformational dynamics of molecules while synchronizing the detection of fluorescence signals with laser switching. The scheme reported here is distinguished from the previously reported ALEX (Alternating Laser Excitation) method[6,15,16] in that the probe-probe stoichiometries are not determined due to the reduced number of switching lasers to gain a higher time resolution. On a need, ALEX analysis can be incorporated by adding a 730-nm laser to the setup.
Figure 1.
Interaction diagram of four fluorophores, and the alternating laser excitation scheme to determine six inter-dye FRET efficiencies.
We first realized single-molecule four-color FRET in confocal microscopy (Supporting Information Figure 3a). Three excitation lasers (473-, 532- and 633-nm) were switched on and off with electro-optic modulators. Switching of the laser lines and detection of fluorescence signals were synchronized with trigger lines of a timer/counter board. We also implemented single-molecule four-color FRET detection in TIRF microscopy, which significantly enhances the yield of data from single-molecule FRET measurements, and is mandatory in studies of irreversible biological processes (Supporting Information Figure 3b). To switch three excitation lasers (473-, 532- and 640-nm), we used mechanical shutters with a switching time of 1.5 ms, which did not affect data acquisition with filming rates below 30 frames/second. Synchronization of laser switching with fluorescence imaging was implemented by using an electronic circuit containing flip-flops and multiplexers (Supporting Information Figure 4).
The Holliday junction, composed of four helical arms (Figure 2a), exhibits conformational dynamics between two different stacking conformers, isoI and isoII[17–19], making it a good model system for demonstrating the capability of our four-color FRET method (Figure 2b). Figure 2c shows representative fluorescence intensity time traces of the Holliday junction labelled with Cy2, Cy3, Cy5, and Cy7 at the ends of the four arms as in Figure 2a. From the data obtained via confocal microscopy, all six FRET efficiencies could be calculated as in Figure 2d (black lines), where the red lines overlaid are most probable trajectories generated by Hidden Markov Modelling (HMM)[20]. Consistent with the model in Figure 2b, E14, and E23 remained in one state, and the other FRET pairs showed two-state fluctuations with correlations and anticorrelations as expected, demonstrating that all inter-dye FRET efficiencies can be simultaneously measured, and correlated with the conformational dynamics of the Holliday junction. It should be noted that FRET efficiencies determined at the last step (E12, E13 and E14) are subject to higher noise due to error amplification from multiple FRET calculation steps, and thus there sometimes appears to be dynamics, which are not real. The HMM fits obtained while allowing > 2 states converged into the two states (Figure 2d), thus it justifies this conclusion. The overall correlation of different FRET pairs is clearly visualized in three-dimensional FRET distributions of E12, E13, and E14 (Figure 2e), and of E23, E24, and E34 (Figure 2f). The Holliday junction dynamics measured using four-color TIRF microscopy was identical to that observed using confocal microscopy (Supporting Information Figure 5).
Figure 2.

Holliday junction dynamics observed via single molecule four-color FRET. a) Labelling scheme. b) A conformational dynamics model of the Holliday junction. c) Representative fluorescence intensity time traces at blue (top), green (middle), and red excitations (bottom). Fluorescence signals of Cy2, Cy3, Cy5 and Cy7 are colored in blue, green, red and gray, respectively. In the top panel, Cy2 signal is vertically shifted for clear visualization. d) FRET efficiency time traces. The six FRET efficiencies (black lines) were calculated from the data in c) following the method described in Supporting Information. Red lines are the most probable FRET trajectories generated by Hidden Markov Modeling. e) Three-dimensional distribution of E12, E13, and E14 of d). f) Three-dimensional distribution of E34, E23, and E24 of d). To make a connection between e) and f), each data point in the plots is color-coded based on E34.
In conventional FRET experiments, it is difficult to correlate the kinetics of two events spatially separated by a distance well beyond the FRET range (> 10-nm). With the four color detection capability, we can implement a “dual FRET pair” scheme, where two independent FRET pairs measure the correlation between two events spatially far-separated, and determine the simultaneity of the events. As a demonstration, we performed RecA-mediated strand exchange experiments[21–22]. A partial double stranded DNA labelled with two acceptors (Cy5 at the junction and Cy7 at the terminal end of a 70-nt single stranded DNA) was immobilized on a polymer-coated quartz surface. After forming a RecA filament, we injected homologous double stranded DNA, whose ends were labelled with two donors (Alexa488 and Cy3). In this scheme, the docking of double stranded DNA to the immobilized RecA filament is observed as an abrupt appearance of fluorescence signal, and the propagation of strand exchange as the subsequent evolution of FRET (Figure 3a). In the reaction product, high FRET of Alexa488-Cy5 and Cy3-Cy7 pairs report the completion of strand exchange at each end of the DNA.
Figure 3.

RecA-mediated strand exchange experiments. a) A schematic diagram of the experiments. b) Representative fluorescence intensity time traces of strand exchange. In each plot, the top panel shows the intensity trace of Alexa488 (blue lines), and that of Cy5 (red lines) at 473-nm excitation and the bottom panel shows Cy3 (green lines), and Cy7 (gray lines) signals at 532-nm excitation. Delay times and corresponding models of strand exchange initiation are shown in the figure. c) Relative distribution of delay times at both ends of the synaptic complex from 135 molecules. To visualize the distribution of delay times, each data point is represented as a gray-scaled 2-D Gaussian distribution. A contour plot of population density was overlaid for clear visualization of the three species. d) Cumulative probability distributions of the delay times of each species. By fitting the distributions to single exponential functions, delay times required for the completion of strand exchange were obtained.
Representative single-molecule intensity time traces measured in TIRF microscopy show that high FRET at each end is achieved either directly upon docking or after a delay, allowing us to classify molecules into three categories: Type I (17 % of 135 molecules) did not show any delay between docking and completion of strand exchange at either end; Types IIa (13 %) and IIb (16 %) showed a delay only at one of the two ends; and Type III (54 %) showed a delay at both ends (Figure 3b). The correlation plot of E24 vs. E13 at the moment of docking more clearly shows the existence of the four distinct populations, which later merge into one population with high values for both E24 and E13 (Supporting Information Figure 6). Our systematic two-color FRET analysis showed that the zero delay corresponds to strand exchange beginning from the labelled end [Ragunathan, Joo and Ha, submitted]. Our four-color results demonstrate that the initiation of strand exchange can occur from the ends of DNA (Types IIa and IIb), or from the middle (Type III). This conclusion could not be directly reached from the two-color FRET measurements since it was not possible to monitor events at both ends of single RecA synaptic complexes. Furthermore, the dual FRET measurements reveal a number of surprising observations which two-color FRET cannot provide: 1) Strand exchange events which initiated from the middle showed a strong correlation between the two delay times (Figure 3c, Type III), and 2) these events are completed more slowly compared to the events which initiated from the ends (Figure 3d). The existence of Type I species was also unexpected from two-color FRET analysis, implying diverse paths of strand exchange initiation. More systematic studies varying DNA sequence, length and labelling positions would be needed for a complete understanding of this remarkably complex process.
In summary, we realized a reliable single-molecule four-color FRET technique that can determine six inter-fluorophore FRET efficiencies in real time. While three-color FRET monitors three distances, our results represent the doubling of the number of observables. Our method is robust even in the presence of FRET interactions between all four fluorophores as we demonstrated with the Holliday junction dynamics. The experiments using RecA demonstrates the strength of a multidimensional analysis measuring two independent reactions coordinates simultaneously for a single molecule. We expect that the technique reported here will have broad applications in measuring the correlated dynamics of complex biological systems[23].
Experimental Section
Experimental details are described in Supporting Information.
Supplementary Material
Footnotes
This work was supported by the Creative Research Initiatives (Physical Genetics Laboratory, 2009-0081562), by the World Class University project (R31-2009-100320), and by the US National Science Foundation grants (0822613 and 0646550). T.H. is an investigator with the Howard Hughes Medical Institute. J.L. was financially supported by Hi Seoul Science (Humanities) Fellowship from Seoul Scholarship Foundation
Contributor Information
Jinwoo Lee, Department of Physics and Astronomy, Department of Biophysics and Chemical Biology, National Center for Creative Research Initiatives, Seoul National University, Seoul 151-747, (Korea).
Sanghwa Lee, Department of Physics and Astronomy, Department of Biophysics and Chemical Biology, National Center for Creative Research Initiatives, Seoul National University, Seoul 151-747, (Korea).
Kaushik Ragunathan, Center for Biophysics and Computational Biology, Department of Physics, Center for the Physics of Living Cells, University of Illinois at Urbana-Champaign, Urbana, Illinois 61801, (USA).
Dr. Chirlmin Joo, School of Biological Sciences, Seoul National University, Seoul 151-747, (Korea)
Prof. Dr. Taekjip Ha, Center for Biophysics and Computational Biology, Department of Physics, Center for the Physics of Living Cells, University of Illinois at Urbana-Champaign, Howard Hughes Medical Institute, Urbana, Illinois 61801, (USA)
Prof. Dr. Sungchul Hohng, Email: shohng@snu.ac.kr, Department of Physics and Astronomy, Department of Biophysics and Chemical Biology, National Center for Creative Research Initiatives, Seoul National University, Seoul 151-747, (Korea), Fax: (+82) 2-871-8083
References
- 1.Ha T, Enderle T, Ogletree DF, Chemla DS, Selvin PR, Weiss S. Proc Natl Acad Sci USA. 1996;93:6264–6268. doi: 10.1073/pnas.93.13.6264. [DOI] [PMC free article] [PubMed] [Google Scholar]
- 2.Roy R, Hohng S, Ha T. Nat Methods. 2008;5:507–516. doi: 10.1038/nmeth.1208. [DOI] [PMC free article] [PubMed] [Google Scholar]
- 3.Hohng S, Joo C, Ha T. Biophys J. 2004;87:1328–1337. doi: 10.1529/biophysj.104.043935. [DOI] [PMC free article] [PubMed] [Google Scholar]
- 4.Heilemann M, Tinnefeld P, Mosteiro GS, Garcia Parajo M, Van Hulst NF, Sauer M. J Am Chem Soc. 2004;126:6514–6515. doi: 10.1021/ja049351u. [DOI] [PubMed] [Google Scholar]
- 5.Clamme JP, Deniz AA. Chemphyschem. 2005;6:74–77. doi: 10.1002/cphc.200400261. [DOI] [PubMed] [Google Scholar]
- 6.Lee NK, Kapanidis AN, Koh HR, Korlann Y, Ho SO, Kim Y, Gassman N, Kim SK, Weiss S. Biophys J. 2007;92:303–312. doi: 10.1529/biophysj.106.093211. [DOI] [PMC free article] [PubMed] [Google Scholar]
- 7.Ross J, Buschkamp P, Fetting D, Donnermeyer A, Roth CM, Tinnefeld P. J Phys Chem B. 2007;111:321–326. doi: 10.1021/jp066082g. [DOI] [PubMed] [Google Scholar]
- 8.Person B, Stein IH, Steinhauer C, Vogelsang J, Tinnefeld P. ChemPhysChem. 2009;10:1455–1460. doi: 10.1002/cphc.200900109. [DOI] [PubMed] [Google Scholar]
- 9.Lee NK, Koh HR, Han KY, Kim SK. J Am Chem Soc. 2007;129:15526–15534. doi: 10.1021/ja0725145. [DOI] [PubMed] [Google Scholar]
- 10.Roy R, Kozlov AG, Lohman TM, Ha T. Nature. 2009;461:1092–1097. doi: 10.1038/nature08442. [DOI] [PMC free article] [PubMed] [Google Scholar]
- 11.Munro JB, Altman RB, Tung C, Cate JHD, Sanbonmatsu KY, Blanchard SC. Proc Natl Acad Sci USA. 2010;107:709–714. doi: 10.1073/pnas.0908597107. [DOI] [PMC free article] [PubMed] [Google Scholar]
- 12.Lee NK, Koh HR, Han KY, Lee J, Kim SK. Chem Commun. 2010;46:4683–4685. doi: 10.1039/c002666b. [DOI] [PubMed] [Google Scholar]
- 13.Lee S, Lee J, Hohng S. PLoS ONE. 2010;5:e12270. doi: 10.1371/journal.pone.0012270. [DOI] [PMC free article] [PubMed] [Google Scholar]
- 14.Chung HS, Louis JM, Eaton WA. Biophys J. 2010;98:696–706. doi: 10.1016/j.bpj.2009.12.4322. [DOI] [PMC free article] [PubMed] [Google Scholar]
- 15.Margeat E, Kapanidis AN, Tinnefeld P, Wang Y, Mukhopadhyay J, Ebright RH, Weiss S. Biophys J. 2006;90:1419–1431. doi: 10.1529/biophysj.105.069252. [DOI] [PMC free article] [PubMed] [Google Scholar]
- 16.Kapanidis AN, Lee NK, Laurence TA, Doose S, Margeat E, Weiss S. Proc Natl Acad Sci USA. 2004;101:8936–8941. doi: 10.1073/pnas.0401690101. [DOI] [PMC free article] [PubMed] [Google Scholar]
- 17.McKinney SA, Declais AC, Lilley DMJ, Ha T. Nat Struct Biol. 2003;10:93–97. doi: 10.1038/nsb883. [DOI] [PubMed] [Google Scholar]
- 18.Joo C, McKinney SA, Lilley DMJ, Ha T. J Mol Biol. 2004;341:739–751. doi: 10.1016/j.jmb.2004.06.024. [DOI] [PubMed] [Google Scholar]
- 19.Hohng S, Zhou R, Nahas MK, Yu J, Schulten K, Lilley DMJ, Ha T. Science. 2007;318:279–283. doi: 10.1126/science.1146113. [DOI] [PMC free article] [PubMed] [Google Scholar]
- 20.McKinney SA, Joo C, Ha T. Biophys J. 2006;91:1941–1951. doi: 10.1529/biophysj.106.082487. [DOI] [PMC free article] [PubMed] [Google Scholar]
- 21.Kowalczykowski SC. Nature. 2008;453:463–466. doi: 10.1038/453463a. [DOI] [PubMed] [Google Scholar]
- 22.van der Heijden T, Modesti M, Hage S, Kanaar R, Wyman C, Dekker C. Mol Cell. 2008;30:530–538. doi: 10.1016/j.molcel.2008.03.010. [DOI] [PubMed] [Google Scholar]
- 23.Uemura S, Aitken CE, Korlach J, Flusberg BA, Turner SW, Puglisi JD. Nature. 2010;464:1012–1017. doi: 10.1038/nature08925. [DOI] [PMC free article] [PubMed] [Google Scholar]
Associated Data
This section collects any data citations, data availability statements, or supplementary materials included in this article.