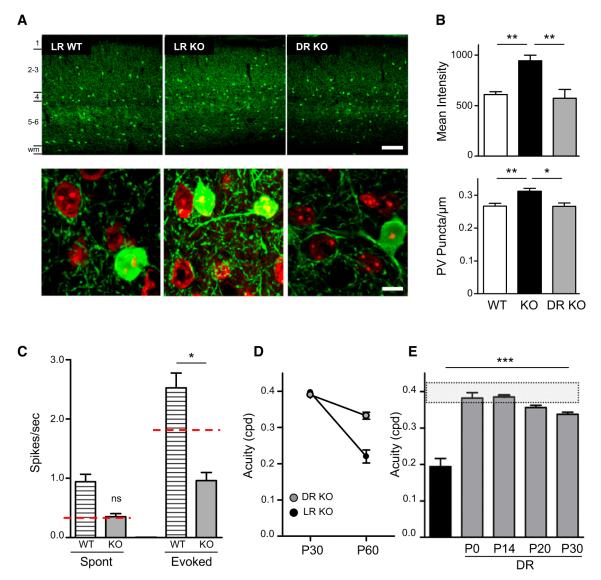
Figure 2. Reversible Parvalbumin (PV)-Circuit Hyperconnectivity and Acuity Defects in Mecp2 KO Mice.
(A) Upper panels: Mean pixel intensity of PV immunofluorescence is increased in light-reared (LR) Mecp2 KO mouse visual cortex compared to WT levels and restored to normal levels in dark-reared (DR) Mecp2 KO. Cortical layers are indicated on the left side of upper left panel. wm = white matter. Scale bar, 100 μm. Lower panels: Presynaptic PV-puncta per cell perimeter are restored to WT levels by DR. Scale bar, 10 μm.
(B) Changes in mean intensity (upper) and PV-cell innervation of pyramidal cell somata (lower) are reversibly increased in Mecp2 KO mouse compared to WT levels (WT versus Mecp2 KO, p < 0.0005; *p < 0.05, **p < 0.01, Mann-Whitney test). Error bars, mean ± SEM.
(C) Single-unit recordings from DR WT and KO adult mice revealed a significant increase in the level of spontaneous activity. Spontaneous but not evoked activity was restored to LR WT level in DR Mecp2 KO mice. Red dotted lines indicate the WT adult level of spontaneous and evoked activity.
(D) Measurements made just before and after 30 days in the dark (DR) reveal little acuity loss (n = 4, p > 0.05). Visual acuity change for LR Mecp2 KO mice or those placed in the dark from P30 (0.40 ± 0.01 and 0.39 ± 0.002 cpd) to P60 (0.22 ± 0.02 and 0.33 ± 0.10 cpd), respectively.
(E) Acuity comparison at P55-60 between Mecp2 KO (n = 15) and dark-reared (DR) KO mice from different postnatal ages, P0 (n = 6), P14–15 (n = 6), P20 (n = 4), or P24–30 (n = 8). Shaded region indicates range of normal WT acuity. Error bars, mean ± SEM.

