Abstract
Gene silencing through RNA interference (RNAi) has been established as a means of conducting reverse genetic studies. In order to better understand the determinants of short interfering RNA (siRNA) knockdown for use in high-throughput cell-based screens, 148 siRNA duplexes targeting 30 genes within the PI3K pathway were selected and synthesized. The extent of RNA knockdown was measured for 22 genes by quantitative real-time PCR. Analysis of the parameters correlating with effective knockdown showed that (i) duplexes targeting the middle of the coding sequence silenced significantly poorer, (ii) silencing by duplexes targeting the 3′UTR was comparable with duplexes targeting the coding sequence, (iii) pooling of four or five duplexes per gene was remarkably efficient in knocking down gene expression and (iv) among duplexes that achieved a >70% knockdown of the mRNA there were strong nucleotide preferences at specific positions, most notably positions 11 (G or C) and 19 (T) of the siRNA duplex. Finally, in a proof-of-principle pathway-wide cell-based genetic screen, conducted to detect negative genetic regulators of Akt S473 phosphorylation, both known negative regulators of this phosphorylation, PTEN and PDK1, were found. These data help to lay the foundation for genome-wide siRNA screens in mammalian cells.
INTRODUCTION
Gene silencing of target mRNA by RNA interference (RNAi) has dramatically expanded the arsenal of genetic tools that can be used to study signaling pathways in mammalian systems. First discovered in Caenorhabditis elegans as a response to double-stranded RNA (dsRNA), which resulted in sequence-specific gene silencing (1), conservation of RNAi-related genes including Dicer and Argonaute family members in vertebrates has prompted the use of RNAi in many systems. The specific mediator of RNAi is the short dsRNA. Introduction of long dsRNA into lysates from Drosophila melanogaster cells leads to the activation of a family of RNase III ribonucleases termed Dicer enzymes, which initiates the cleavage of the dsRNA into ∼22 nt double-stranded duplexes with 2 nt 3′-overhangs and 5′ phosphate termini termed short interfering RNA (siRNA) (2–6). The siRNA is subsequently utilized by an RNA induced silencing complex (RISC), a protein–RNA effector nuclease complex, which uses the siRNA as a template to recognize and cleave RNA targets with similar nucleotide sequences.
Application of RNAi in mammalian cells demonstrated a particular challenge since introduction of exogenous long dsRNA activates an innate immune (IFN) response, which leads to the inhibition of protein translation by the PKR pathway and activation of RNase L [reviewed in (7)]. However, transfection of target-specific synthetic short dsRNA (21–23 nt in length) into mammalian cells yielded gene silencing capabilities, which allowed for the routine application of siRNA in mammalian cells (8). The specific nature of siRNA mediated post-transcriptional gene silence has been demonstrated in global genetic profiling studies, which showed sequence specificity for the target mRNA and did not induce detectable secondary changes in the global gene expression pattern (9). Though there are data to suggest potential problems with off-target effects (10), it seems reasonable to think that the systematic genetic studies of signaling pathway components can now be accomplished in mammalian cells.
Current siRNA selection criteria are based on guidelines first published by Elbashir et al. (8) (http://www.rockefeller.edu/labheads/tuschl/sirna.html). These criteria and subsequent revisions were the result of trial-and-error observations of randomly selected siRNAs. Briefly the requirements include: 21 nt sense and antisense strands paired as to have a 2 nt 3′-overhang, target regions starting 50–100 nt downstream of a start codon, 50% G/C content. The guidelines provide a starting point to design siRNAs, but provide little specificity to insure siRNA knockdown efficacy. Also, siRNA knockdown varies from position to position on the same gene and is dramatically abolished when single nucleotide substitutions are made, which suggests the possibility of consensus sequence recognition that discriminates between high efficacy siRNAs and non-functional siRNAs.
In order to try and improve upon siRNA selection criteria, which reflect the specificity by which certain siRNAs knockdown better than others, a library of 148 siRNA was developed targeting 30 genes, the protein products of which are intimately involved in PI3K signaling. An algorithm was designed to select five candidate siRNAs four targeting different sections (quartiles) of the coding sequence (CDS) and one gene duplex targeting the 3′UTR. For 22 genes, siRNA knockdown was analyzed by quantitative real-time PCR (QRT-PCR) and by immunoblot analysis when appropriate reagents were available. Statistical analysis of parameters associated with effective gene silencing revealed that targeting within position 3 of the coding sequence (the third quarter of the CDS) was significantly worse than other positions, and that targeting within the 3′UTR was as effective as targeting within the CDS. In addition, pools of five siRNA duplexes were comparable with the best single siRNA duplexes and in aggregate were highly successful in gene knockdown. Moreover, when the nucleotide composition of those duplexes that achieved >70% knockdown of the mRNA was compared with the nucleotide composition of the entire starting pool of candidate siRNA sequences, strong positive and negative nucleotide preferences were seen at specific positions. Lastly, this set of siRNAs was tested functionally in an immunofluorescent cell-based 96-well format assay screen that detects negative regulators of the Akt S473 phosphorylation site. In this screen, both known inhibitors of Akt S473 phosphorylation, namely PTEN and PDK1, were discovered.
MATERIALS AND METHODS
Plasmid, cell lines, cell culture, siRNA transfections
The insert from pCDNA3-T7-Akt (11) was liberated by BamH1/Xba1 restriction and ligated to pCDNA3-Flag-HA to generate pCDNA3-Flag-HA-Akt1. HEK 293T cells, maintained as described (12), were seeded at 10 000, 60 000 or 120 000 cells/well for 96-well, 24-well or 12-well plates and transfected 24 h later with siRNA duplexes (100 nM) using Lipofectamine 2000.
Antibodies and immunoblot analysis
Antibodies recognizing S6RP, pAktS473, Akt, p85α, mTOR, (Cell Signaling Tech.), GSK3, PDK1 (Upstate), TSC2 (Santa Cruz Bio.) and PTEN (C54) (13) were used at 1:500–1:1000. Anti-β-tubulin (Upstate) was used at 1:20 000. Protein extraction, gel electrophoresis and immunoblotting were carried out as described (12).
RNA extraction, primer design and QRT-PCR
For each gene 5′- and 3′-exon primers (see Supplementary Material, Table I) were selected with Primer3 (14). Forty-eight hours after transfection RNA was isolated with the RNeasy 96 kit (Qiagen) and quantified by Ribogreen (Molecular Probes). QRT-PCR measurements were obtained with the Quantitect SYBR green kit (Qiagen) on an ABI 7700 for 40 cycles.
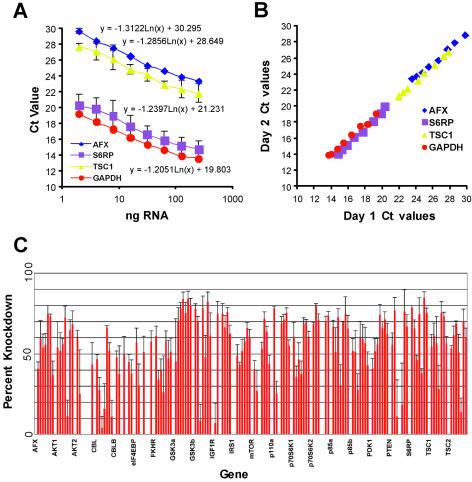
Standard curves relating input total RNA to the Ct threshold value were derived for four different genes representing high and low abundance products. These curves were generated by measuring the Ct values for each gene from known amounts of serially diluted 293 cell RNA. Results demonstrated that changes in Ct values exhibited similar and reproducible linear-logarithmic trends as mRNA amounts were reduced. While overall mRNA abundance changed (y intercept or starting concentration), the slope relating Ct value to mRNA amount was nearly identical for all four mRNAs tested here (see Fig. 2A). To ensure these values would be stable over different experiments, the inter-assay variation in QRT-PCR was determined for the same four mRNA species by performing replicate experiments on different days (Fig. 2B).
Figure 2.
mRNA knockdown achieved with siRNAs duplexes targeting the PI3K pathway. (A) Standard curves relating input nanograms of total RNA to Ct value for four different mRNA species (AFX, S6RP, TSC1 and GAPDH). The log-linear relationship holds constant despite significant abundance differences in the four genes. (B) Inter-assay variation in QRT-PCR for four mRNA species. In order to determine whether assays conducted on different days and indifferent runs could be accurately compared, we performed replicate experiments on different days as described in Materials and Methods. The x-axis reflects the Ct values obtained on day 1 while the y-axis reflects the Ct values obtained on day 2. (C) Percent knockdown of each duplex and pool directed against the inducted mRNAs as determined by QRT-PCR. The %KD was calculated as described in Materials and Methods using the standard curves derived in (A). The %KD is plotted along the y-axis for each siRNA and pool for the genes (as indicated) as shown along the x-axis.
From these data the percent knockdown (%KD) values were calculated from Ct values by first converting all Ct values into relative mRNA amount values (RAV) using a common equation obtained by the mRNA serial dilution assay as described above. All GAPDH and knockdown sample RAVs were standardized to control samples that were treated with GFP siRNA yielding a fold knockdown value. Sample fold knockdown values were divided by the GAPDH fold knockdown values to correct for well-to-well variation. Percent knockdown was subsequently calculated using the following equation: [100 – (100/corrected fold knockdown)]. Since two independent experiments were conducted and each PCR was performed in duplicate, four individual knockdown values were obtained for each siRNA duplex.
Statistical analysis of RNA knockdown
Analysis of variance, adjusting for gene-effect, was used to determine if there were differences in %KD by position. The formula for calculating %KD resulted in several negative values that were considered an artifact of QRT-PCR assay variability, thus %KD was truncated at a bound of 0.0001. Pair-wise comparisons of %KD by position were examined by T-test. Due to multiple comparisons, a P-value of 0.001 was considered significant. The average %KD for each gene and position was calculated and Pearson’s correlation coefficient and linear regression were used to explore the relationships between coding sequence length or absolute siRNA start position and %KD. Analysis of variance, adjusting for gene and position, was used to determine if there were differences due to the rule used to determine the first nucleotide or due to gene length. To compare the best silencing siRNAs with that of the starting database, the set of >5 million siRNAs found using the initial criteria (Fig. 1A) was subjected to the selection criteria used in picking five siRNAs (here NA was used as a convenient starting dinucleotide prior to the N19 core). The nucleotide content of every position in the duplex was calculated from this set of 1 589 137 candidate siRNAs establishing a position-by-position nucleotide distribution of the starting population. The nucleotide content of the group of siRNA duplexes with >70% KD was compared with the nucleotide composition of the starting population using a binomial distribution. A binomial probability of <0.05 was considered meaningful.
Figure 1.
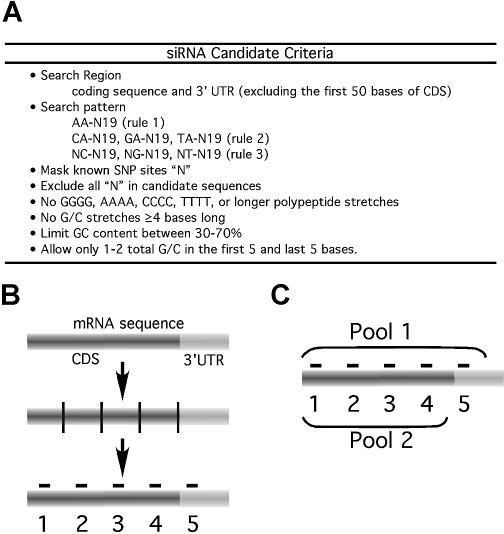
Selection of candidate siRNA sequences. (A) The starting rules for generating a siRNA database are shown. (B) Selection of five siRNAs for each of 30 mRNAs from genes whose protein products are within the PI3K pathway. siRNA selection was limited to the open reading frame (CDS) and the 3′UTR. Next, the CDS was divided into four equal quarters and the 3′UTR. In each region the first unique siRNA candidate within the database was selected. (C) siRNA sets were provided both as single candidates as well as in two pools that either contained (P1) or did not contain (P2) the position 5 duplex.
A screen for inhibitors of Akt S473 phosphorylation
293 cells seeded in 96-well plates (5000 cells/well), were co-transfected with 0.1 ng pCDNA3-Flag-HA-Akt1 and each siRNA (100 nM) in triplicate. After 48 h, cells were fixed in 3.7% formaldehyde 1× PBS for 10 min, washed, permeabilized in PBS, 0.2% Triton X-100 for 20 min at RT, incubated in blocker [5% FBS (Hyclone), 0.2% Triton X-100 in PBS] for 1 h and stained with anti-phosphoAktS473 (1:200 in blocker) for 24 h at 4°C. After three washes cells were stained for 1 h with FITC-conjugated goat anti-rabbit IgG (1:500 in blocker).
RESULTS
Selection and synthesis of candidate siRNA duplexes targeting genes in the PI3K pathway
To generate a pool of candidate siRNA sequences, a Java-based program integrated with NCBI BLAST was designed and used to select a pool of candidate siRNA sequences. First, SNP alleles from dbSNP (15) were mapped to the mRNAs (16,218 NM_ and 21,959 XM_ sequences) in REFSEQ (16) and masked with ‘N’. Next, 21 bp candidate siRNAs were selected using general search criteria (Fig. 1A). The >9 million siRNA candidates were then compared with the UNIGENE database by local BLAST and those with >16 of 19 matches to a second gene were removed leaving 5 470 534 candidate siRNAs. Next, a second algorithm (‘pick5’) parsed each CDS into four or five equal lengths depending on the presence of a 3′UTR in order to select four non-overlapping siRNA duplexes distributed over the CDS and one duplex in the 3′UTR. Within each sub-division a siRNA candidate, each having an NA-overhang sequence, was chosen (i.e. using Rules 1 and 2 together) (Fig. 1B). The 30 PI3K pathway target genes and the 148 selected siRNA candidates are shown in Supplementary Material, Tables II and III. Only four unique siRNA sequences were found for Akt2 and eIF4EBP. All siRNA duplexes were synthesized and aliquot into 96-well plates along with gene-specific siRNA pools where Pool 1 (P1) contained all five siRNAs while Pool 2 (P2) excluded the siRNAs in position 5. Thus, P1 targeted the CDS and 3′UTR, and P2 targeted the CDS only (Fig. 1C).
Analysis of knockdown efficiency by QRT-PCR
Specific QRT-PCR assays were developed for 22 of the 30 genes using RT primers designed to flank intervening introns. The majority of primer pairs (shown in Supplementary Material, Table I) were designed to flank the 3′ most intron in the gene. To standardized mRNA knockdown analysis we developed standard curves for four genes that varied substantially in abundance. While the initial Ct value for detection of each mRNA species was found to vary, the slope of the log-linear relationship did not. Thus, the slopes of the log-linear plots derived from these four genes were used for all genes to relate Ct value to change in mRNA level (Fig. 2A). To determine the extent to which, in our hands the slope varied between experiments the entire experiment was repeated and the Ct values from the two different days were compared. Here, we found little day-to-day variation (Fig. 2B).
Next, 293 cells were transfected in quadruplicate in 96-well plate format with each pool and each single duplex. mRNA was extracted and the gene-specific mRNA levels were analyzed in duplicate QRT-PCRs along with a GAPDH control. The %KD was determined as described in Materials and Methods using the standard curves from Figure 2A. The mRNA knockdown results are shown graphically in Figure 2C and numerically in Figure 6C.
Figure 6.
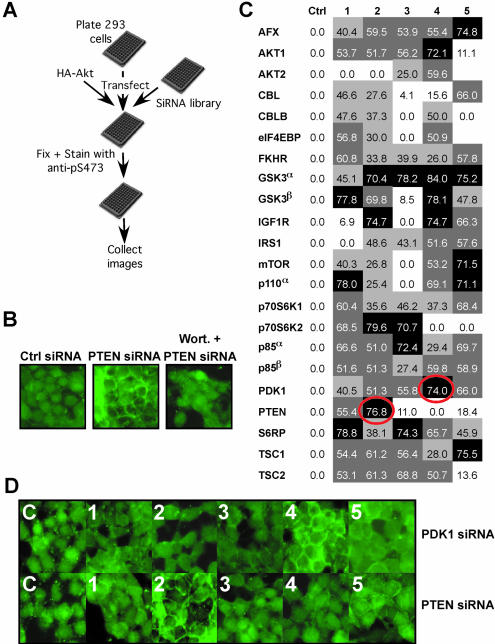
A cell-based siRNA screen for inhibitors of phosphoinositide-3 kinase signaling. (A) Experimental design for a cell-based screen to detect negative regulators of Akt S473 phosphorylation. (B) 293 cells were plated in duplicate and co-transfected with a PTEN siRNA and pcDNA3-HA-FLAG-Akt. Cells were either treated with vehicle (middle panel) or Wortmannin (Wort., right panel). Cells were fixed and immunostained with an anti-pAktS473 antibody. (C and D) A cell-based screen for inhibitors of Akt S473 phosphorylation. 293 cells seeded in 96-well plates were transfected in triplicate with all 148 pathway siRNAs. (C) The results of the screen. siRNA duplexes were considered positive when membrane staining was enhanced as in (B) in the three triplicate wells. The two siRNA duplexes that were scored positive are circled in red. Shown is the percent mRNA knockdown for each siRNA duplex (from Fig. 2C). SiRNA duplexes are highlighted according to %KD, black ≥70%, dark gray 70< ≥50%, light gray 25< >50% and white ≤25%. (D) Shown are images of representative wells from the siRNA duplexes against PDK1 and PTEN.
In order to determine whether RNA knockdown correlated with protein knockdown, protein extracts were prepared from similarly transfected 293 cells and immunoblotted with the antibodies to seven different genes. Side-by-side comparisons of mRNA silencing data and corresponding protein levels demonstrated a high concordance between changes in mRNA and protein levels (Fig. 3).
Figure 3.
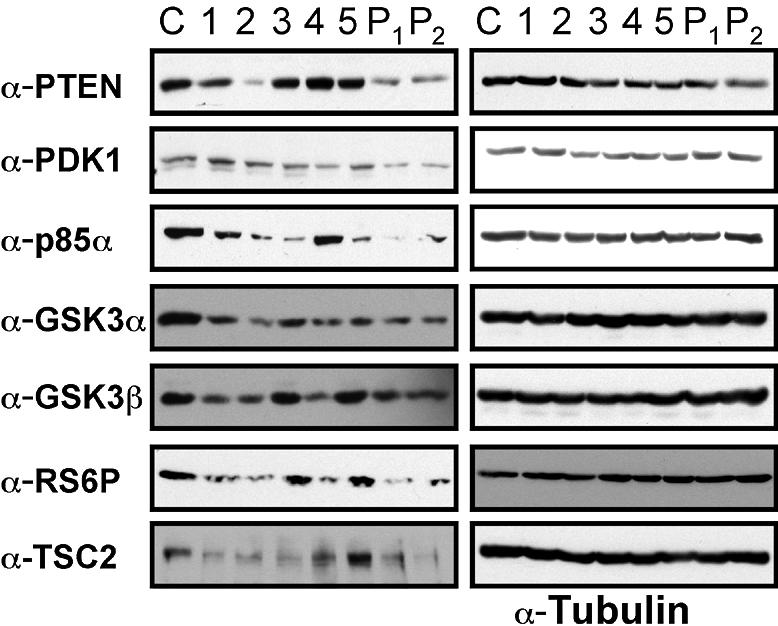
Protein knockdown. Protein extracts were prepared after siRNA transfection with either control siRNA indicated by C, the indicated single duplex (1–5) or pools 1 and 2 (P1 and P2), and immunoblotted with antibodies against the indicated proteins (left panels) or against tubulin (right panel).
Analysis of the gene silencing probability
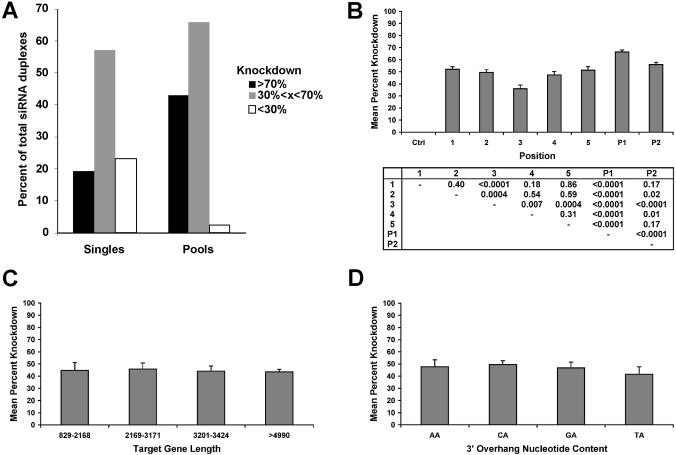
As expected, there was considerable variability among siRNA duplexes in the efficacy of target mRNA knockdown. This large data set allows us to estimate probabilities of gene knockdown for genome-wide applications. Of the 110 duplexes screened, 62 (56%) induced at least 50% KD, while 21 (19%) induced over 70% KD. Nine siRNAs (10%) induced >75% silencing, but only one duplex induced >80% silencing. Thirteen out of 22 genes (59%) were silenced by 70% after screening five siRNAs per gene, while 10 out of 22 (45%) were silenced at the 70% level after screening four siRNAs per gene. Extrapolation of these numbers indicates that the selection criteria applied here would require 9–10 siRNAs to be screened per gene to ensure (95% confidence level) that the target gene is silenced by at least 70%. The alternative strategy of screening only four siRNAs per gene while more economical would result in a 41% lost of coverage. Thus, strategies to improve targeting efficiency are clearly desirable.
Determinants of siRNA efficiency—pooling and position effects
For genome-wide siRNA sets, where gene-specific validation may be impractical, one strategy might be to use siRNA pools. Of the 42 pools, 33.3% exhibited ≥70% KD, 59.5% had knockdown levels between 40 and 70% and only 7.1% of the pools were silenced at <30% (Fig. 4A). P1 (mean 66.4 ± 1.53%) significantly outperformed all individual positions and P2 (P < 0.0001). These data suggest that pooling is, at the least, not disadvantageous. Pools might outperform single duplexes as a result of always including the most highly functional siRNA or as a result of synergy between siRNAs targeting the same gene. To try and distinguish these possibilities, the knockdown of the 22 best single siRNAs for each gene were compared pair-wise with the corresponding pool. Here, the best singles siRNAs (mean KD 70.9%) were typically better than corresponding pools (mean 68.7%) arguing against the idea of synergy.
Figure 4.
Pooling and position effects on knockdown efficiency. (A) The percentage of siRNA singles and of pools effecting gene knockdown. The cumulative percentage of single duplexes or pools achieving specified threshold knockdown levels is shown. (B) The effect of CDS or 3′UTR position and pooling on mean mRNA knockdown. The mean and standard error of mRNA knockdown for duplexes organized by position or by pools is shown. Positions 1, 2, 3 and 4 represent the first, second, third and fourth quarter of the CDS while position 5 is typically the 3′UTR. (C) The relationship between gene length and knockdown efficiency. The mean %KD is shown along the y-axis with quartiles of gene length shown along the x-axis. (D) The relationship between 3′-overhang and knockdown efficiency. The mean %KD is shown along the y-axis with the selected overhang shown along the x-axis.
To refine and delineate more robust rules for siRNA selection, the role of siRNA pooling and gene characteristics in explaining the variance in mRNA knockdown across this dataset was explored. Characteristics including length of the target mRNA (P = 0.98), the absolute distance from the 5′ end (P = 0.90), the GC content of the siRNA duplex (P = 0.21) and N nucleotide in preceding NA sequence (P = 0.95) were not statistically different with respect to the mean knockdown achieved (Fig. 4C and D, and data not shown). On the other hand, an analysis of siRNA position where mean knockdown of duplexes from each quartile position in the CDS and location in the 3′UTR were compared showed that position 3 (the third quartile of the CDS) was inferior to all other positions (P < 0.007) (Fig. 4B). Most siRNA duplexes picked in this region were near the 5′ end of the third quartile and thus are located in the middle of the CDS. In addition, there was an apparent trend towards improved siRNA knockdown as sequences approached either the 3′ and 5′ ends of the mRNA although this did not reach statistical significance (data not shown). A multivariate model containing terms for gene-effect (i.e. the identity of the specific gene), position and a gene/position interaction explained 87.1% of the variability in target gene knockdown in this dataset (data not shown).
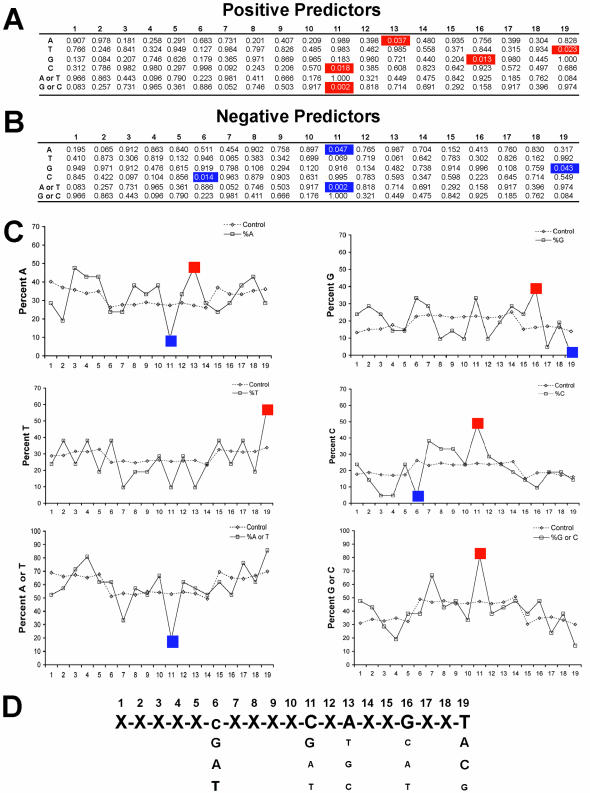
Next, siRNA duplexes were divided based upon the %KD of the mRNA into four groups (shaded in Fig. 6C), and the nucleotide content of each position in the top group of siRNA duplexes (those with >70% KD, shaded in black in Fig. 6C) was determined. In order to determine whether such nucleotides were enriched in this highly active group of siRNA duplexes over the starting population of candidate siRNA duplexes, we applied a selection rule to the entire database of candidate duplexes that required a NA starting position (to mimic the selection of the set of 148 duplexes). The binomial distribution was used to determine the probability that a given base was either enriched for or negatively selected against in the top group. In Figure 5C, the proportion of nucleotides at each position in the starting population is shown as dashed lines, while the proportion of each nucleotide at each position in the highly active duplexes is shown as a solid line. Binomial probabilities indicative of statistical enrichment were found at a number of specific nucleotide positions (Fig. 5A and B). Specifically, there was a striking preference for T and a selection against G in position 19, and a selection for C or GC and a negative selection against A and AT at position 11. In three positions we observed only a single nucleotide selection, an enrichment for G at position 16, an enrichment for A at position 13 and a selection against C in position 6 (Fig. 5). Summing these preferences leads to a tentative consensus sequence (Fig. 5D).
Figure 5.
Position-specific nucleotide preferences among highly effective siRNA duplexes. (A and B) The binomial distribution was used to calculate the probability of finding an increased frequency (top panel) or decreased frequency (bottom panel) of a given nucleotide or nucleotide combination in the 22 best siRNAs when compared with the nucleotide distribution of the entire starting population of candidate siRNA duplexes. Shown in red (increased frequency) and blue (decreased frequency) are those position and bases where the binomial probability was less than 0.05. (C) The frequency of A, T, G or C, or the combinations of A or T and G or C (as indicated) at each nucleotide position among the 22 siRNA duplexes with mRNA knockdown values >70% (solid line, open squares) or in the entire set of starting candidate siRNAs (dashed lines, open triangles) are compared. The nucleotide position starting from the 5′ most position of the siRNA 19mer core is shown along the x-axis represents while the percent frequency of the indicated nucleotide expressed as a percentage is shown along the y-axis. (D) A preliminary consensus nucleotide preference for siRNA duplexes is shown based upon the data presented in (A–C).
A phenotypic siRNA screen for inhibitors of Akt activation
Activation of phosphoinositide-3 kinase leads to the generation of PIP3 and the recruitment and activation of Akt at the plasma membrane. Negative regulators of Akt include the tumor suppressor gene PTEN. Loss of PTEN’s function as a lipid phosphatase leads to accumulation of phosphoinositide-3 kinase and activation of Akt (17) [reviewed in (18)]. Cells lacking PTEN harbor Akt proteins constitutively phosphorylated on S473 and T308. PDK1 is thought to be a positive regulator of Akt, thus loss of PDK1 is predicted to lead to inactivation of Akt. In PDK1–/– murine cells while Akt is inactive it is aberrantly phosphorylated on S473 (19). Thus, PTEN and PDK1 are negative regulators of this phosphorylation site. We developed a 96-well cell-based assay that detects phosphorylation of Akt S473 (Fig. 6A). Here, the specificity of the assay was first ascertained by co-transfecting 293 cells with a previously identified siRNA duplex that results in a >80% decrease in PTEN protein (F.Vazquez and W.Sellers, unpublished) along with a plasmid encoding wild-type human Akt1. Here, PTEN knockdown induced membrane-associated Akt S473 phosphorylation that was blocked by treatment with wortmannin (Fig. 6B). Next, 293 cells were transfected in 96-well format in triplicate with each of the single siRNA duplexes targeting the PI3K pathway along with a plasmid encoding wild-type Akt1. Forty-eight hours after transfection cells were fixed and stained with anti-S473 and FITC-conjugated secondary antibody. From the 148 siRNAs duplexes, there were two positive ‘hits’ (Fig. 6C and D). A PTEN and a PDK1 siRNA were observed that each led to marked up-regulation of S473 phosphorylation in all replicate wells (representative wells are shown in Fig. 6D). Each of these siRNA duplexes was the best at knocking down the mRNA and protein of its respective target and both were among the top group of siRNA duplexes in the set of 22 tested by QRT-PCR (Figs 2C and 6C) and robustly knocked down the protein level as well (Fig. 3). These ‘hits’ were reconfirmed in independent experiments where induction of S473 phosphorylation was observed, this time for endogenous Akt, by immunoblotting (data not shown). In addition, as expected while siRNA to PTEN induced phosphorylation of T308 and phosphorylation of GSK3, siRNA to PDK1 did not (data not shown). These data confirm the observed role of PTEN as a negative regulator of Akt S473 phosphorylation and confirm the initial observation that PDK1 also plays a role in negatively regulating the S473 phosphorylation site.
DISCUSSION
148 siRNA duplexes against a set of 30 genes in the PI3K pathway were studied. Analysis of the mRNA knockdown for 22 genes, revealed several trends that may aid in predicting higher efficacy siRNAs and for the development of larger genome-wide siRNA sets. First, pooling siRNAs does not impede knockdown efficacy. While pooling increases the possibility of off-target effects, high-throughput screens built upon pooling would require fewer assays to effectively knock down each gene. Pooling strategies may be one means by which the false-negative rates might be lowered in high-throughput assays as the percentage of successful knockdowns would be substantially higher. Specificity could then be re-tested in follow-up secondary single duplex tests.
Secondly, we found that targeting the 3′UTR was as efficient as targeting the CDS. This is of significant use as targeting the 3′UTR allows a rapid means of rescuing a siRNA-induced phenotype by simply allowing the use of an exogenously expressed wild-type cDNA lacking the 3′UTR. This would obviate potentially the need for creating alternate coding cDNA sequences as a means of rescuing a phenotype. Of note, enhanced protein knockdown over the mRNA knockdown was not seen with the seven 3′UTR duplexes where immunoblot data was also available. These limited data suggest that for these sequences microRNA function was not exhibited (20).
Thirdly, positioning siRNAs within the middle of the CDS resulted in a lower mean knockdown raising the possibility that the middle of a mRNA may be less accessible to the RISC (3–5,8,21,22).
Finally, a sequence preference emerged when comparing the nucleotide sequence of siRNAs found to knock down the mRNA level by >70% to the siRNA sequences in our initial siRNA database. The evident preference for certain nucleotides in certain positions may indicate that siRNA functionality is determined by siRNA sequence itself and not necessarily by the mRNA content. Such site-specific nucleotide preferences may indicate a substrate preference for the RISC complex. The most profound difference was observed for the selection against G in position 19. A similar bias has been identified for miRNAs, naturally existing counterparts of the siRNAs, which most likely utilize the same protein machinery (20,23–25). In addition, preferences in the central positions are of interest as the RISC endonuclease activity cleaves ∼11–12 bp from the first homologous pair suggesting that there may be an endonuclease determinant influencing nucleotide selection in nearby positions (6).
Lastly, in a functional proof-of-concept siRNA screen using this library, the two known negative regulators of Akt S473 phosphorylation PTEN and PDK1 both scored. Here, within the set of siRNAs for these two genes, only those siRNAs with >70% KD scored in the functional assay. While the role for the lipid phosphatase activity of PTEN in negatively regulating PI3K activation is widely appreciated, the role of PDK1 in negatively regulating the S473 site is to some surprising. These data, however, are in keeping with results obtained in PDK1–/– KO ES cells where a similar increase in Akt S473 phosphorylation was first seen (19). Of note, in our study when PDK1 was silenced, Akt was not only phosphorylated on S473, but was also localized to the plasma membrane. These data suggest that PIP3 levels are up-regulated after PDK1 silencing and are in keeping with the notion that there may be a negative feedback loop between PDK1 and upstream activation of PI3K.
In summary, these data suggest that it may be possible to improve the efficiency of siRNA-mediated knockdown by using these datasets to develop higher order selection strategies. Clearly, the next step will be to validate such an approach by designing a second generation of siRNAs and determining whether such rules apply to an independent set.
SUPPLEMENTARY MATERIAL
Supplementary Material is available at NAR Online.
Acknowledgments
ACKNOWLEDGEMENTS
A.H. was supported by the Howard Hughes Medical Institute. W.R.S. is supported by the Damon-Runyon Lilly Clinical Investigator Award and by the NCI (CA85912).
REFERENCES
- 1.Fire A., Xu,S., Montgomery,M.K., Kostas,S.A., Driver,S.E. and Mello,C.C. (1998) Potent and specific genetic interference by double-stranded RNA in Caenorhabditis elegans. Nature, 391, 806–811. [DOI] [PubMed] [Google Scholar]
- 2.Zamore P.D., Tuschl,T., Sharp,P.A. and Bartel,D.P. (2000) RNAi: double-stranded RNA directs the ATP-dependent cleavage of mRNA at 21 to 23 nucleotide intervals. Cell, 101, 25–33. [DOI] [PubMed] [Google Scholar]
- 3.Hammond S.M., Bernstein,E., Beach,D. and Hannon,G.J. (2000) An RNA-directed nuclease mediates post-transcriptional gene silencing in Drosophila cells. Nature, 404, 293–296. [DOI] [PubMed] [Google Scholar]
- 4.Nykanen A., Haley,B. and Zamore,P.D. (2001) ATP requirements and small interfering RNA structure in the RNA interference pathway. Cell, 107, 309–321. [DOI] [PubMed] [Google Scholar]
- 5.Elbashir S.M., Lendeckel,W. and Tuschl,T. (2001) RNA interference is mediated by 21- and 22-nucleotide RNAs. Genes Dev., 15, 188–200. [DOI] [PMC free article] [PubMed] [Google Scholar]
- 6.Elbashir S.M., Martinez,J., Patkaniowska,A., Lendeckel,W. and Tuschl,T. (2001) Functional anatomy of siRNAs for mediating efficient RNAi in Drosophila melanogaster embryo lysate. EMBO J., 20, 6877–6888. [DOI] [PMC free article] [PubMed] [Google Scholar]
- 7.Bass B.L. (2001) RNA interference. The short answer. Nature, 411, 428–429. [DOI] [PubMed] [Google Scholar]
- 8.Elbashir S.M., Harborth,J., Lendeckel,W., Yalcin,A., Weber,K. and Tuschl,T. (2001) Duplexes of 21-nucleotide RNAs mediate RNA interference in cultured mammalian cells. Nature, 411, 494–498. [DOI] [PubMed] [Google Scholar]
- 9.Chi J.T., Chang,H.Y., Wang,N.N., Chang,D.S., Dunphy,N. and Brown,P.O. (2003) Genomewide view of gene silencing by small interfering RNAs. Proc. Natl Acad. Sci. USA, 100, 6343–6346. [DOI] [PMC free article] [PubMed] [Google Scholar]
- 10.Jackson A.L., Bartz,S.R., Schelter,J., Kobayashi,S.V., Burchard,J., Mao,M., Li,B., Cavet,G. and Linsley,P.S. (2003) Expression profiling reveals off-target gene regulation by RNAi. Nature Biotechnol., 21, 635–637. [DOI] [PubMed] [Google Scholar]
- 11.Vazquez F., Grossman,S.R., Takahashi,Y., Rokas,M.V., Nakamura,N. and Sellers,W.R. (2001) Phosphorylation of the PTEN tail acts as an inhibitory switch by preventing its recruitment into a protein complex. J. Biol. Chem., 276, 48627–48630. [DOI] [PubMed] [Google Scholar]
- 12.Vazquez F., Ramaswamy,S., Nakamura,N. and Sellers,W.R. (2000) Phosphorylation of the PTEN tail regulates protein stability and function. Mol. Cell. Biol., 20, 5010–5018. [DOI] [PMC free article] [PubMed] [Google Scholar]
- 13.Ramaswamy S., Nakamura,N., Vazquez,F., Batt,D.B., Perera,S., Roberts,T.M. and Sellers,W.R. (1999) Regulation of G1 progression by the PTEN tumor suppressor protein is linked to inhibition of the phosphatidylinositol 3-kinase/Akt pathway. Proc. Natl Acad. Sci. USA, 96, 2110–2115. [DOI] [PMC free article] [PubMed] [Google Scholar]
- 14.Rozen S. and Skaletsky,H. (2000) Primer3 on the WWW for general users and for biologist programmers. Methods Mol. Biol., 132, 365–386. [DOI] [PubMed] [Google Scholar]
- 15.Sherry S.T., Ward,M.H., Kholodov,M., Baker,J., Phan,L., Smigielski,E.M. and Sirotkin,K. (2001) dbSNP: the NCBI database of genetic variation. Nucleic Acids Res., 29, 308–311. [DOI] [PMC free article] [PubMed] [Google Scholar]
- 16.Pruitt K.D. and Maglott,D.R. (2001) RefSeq and LocusLink: NCBI gene-centered resources. Nucleic Acids Res., 29, 137–140. [DOI] [PMC free article] [PubMed] [Google Scholar]
- 17.Maehama T. and Dixon,J.E. (1998) The tumor suppressor, PTEN/MMAC1, dephosphorylates the lipid second messenger, phosphatidylinositol 3,4,5-trisphosphate. J. Biol. Chem., 273, 13375–13378. [DOI] [PubMed] [Google Scholar]
- 18.Cantley L.C. (2002) The phosphoinositide 3-kinase pathway. Science, 296, 1655–1657. [DOI] [PubMed] [Google Scholar]
- 19.Williams M.R., Arthur,J.S., Balendran,A., van der Kaay,J., Poli,V., Cohen,P. and Alessi,D.R. (2000) The role of 3-phosphoinositide-dependent protein kinase 1 in activating AGC kinases defined in embryonic stem cells. Curr. Biol., 10, 439–448. [DOI] [PubMed] [Google Scholar]
- 20.Lau N.C., Lim,L.P., Weinstein,E.G. and Bartel,D.P. (2001) An abundant class of tiny RNAs with probable regulatory roles in Caenorhabditis elegans. Science, 294, 858–862. [DOI] [PubMed] [Google Scholar]
- 21.Martinez J., Patkaniowska,A., Urlaub,H., Luhrmann,R. and Tuschl,T. (2002) Single-stranded antisense siRNAs guide target RNA cleavage in RNAi. Cell, 110, 563–574. [DOI] [PubMed] [Google Scholar]
- 22.Schwarz D.S., Hutvagner,G., Haley,B. and Zamore,P.D. (2002) Evidence that siRNAs function as guides, not primers, in the Drosophila and human RNAi pathways. Mol. Cell., 10, 537–548. [DOI] [PubMed] [Google Scholar]
- 23.Ambros V. (2001) microRNAs: tiny regulators with great potential. Cell, 107, 823–826. [DOI] [PubMed] [Google Scholar]
- 24.Reinhart B.J., Weinstein,E.G., Rhoades,M.W., Bartel,B. and Bartel,D.P. (2002) MicroRNAs in plants. Genes Dev., 16, 1616–1626. [DOI] [PMC free article] [PubMed] [Google Scholar]
- 25.Lagos-Quintana M., Rauhut,R., Yalcin,A., Meyer,J., Lendeckel,W. and Tuschl,T. (2002) Identification of tissue-specific microRNAs from mouse. Curr. Biol., 12, 735–739. [DOI] [PubMed] [Google Scholar]
Associated Data
This section collects any data citations, data availability statements, or supplementary materials included in this article.


