Abstract
We have investigated the structure of the cell adhesion molecule L1 by electron microscopy. We were particularly interested in the conformation of the four N-terminal immunoglobulin domains, because x-ray diffraction showed that these domains are bent into a horseshoe shape in the related molecules hemolin and axonin-1. Surprisingly, rotary-shadowed specimens showed the molecules to be elongated, with no indication of the horseshoe shape. However, sedimentation data suggested that these domains of L1 were folded into a compact shape in solution; therefore, this prompted us to look at the molecules by an alternative technique, negative stain. The negative stain images showed a compact shape consistent with the expected horseshoe conformation. We speculate that in rotary shadowing the contact with the mica caused a distortion of the protein, weakening the bonds forming the horseshoe and permitting the molecule to extend. We have thus confirmed that the L1 molecule is primarily in the horseshoe conformation in solution, and we have visualized for the first time its opening into an extended conformation. Our study resolves conflicting interpretations from previous electron microscopy studies of L1.
INTRODUCTION
The neural cell adhesion molecule L1 (Grumet and Edelman, 1984; Rathjen and Schachner, 1984) is a cell surface glycoprotein that is important during CNS development for promoting neurite outgrowth, fasciculation, and axon guidance. L1 is the founding member of a protein subgroup within the immunoglobulin (Ig) superfamily (for review, see Hortsch, 1996, 2000; Brummendorf et al., 1998). Several members have been characterized in vertebrates: L1 (Wolff et al., 1988), NgCAM (Burgoon et al., 1991), NrCAM (Grumet et al., 1991), CHL1 (Holm et al., 1996), neurofascin (Volkmer et al., 1992); and in invertebrates: neuroglian (Bieber et al., 1989), and tractin (Huang et al., 1997). The common structure comprises six extracellular Ig domains followed by five fibronectin type III (FN-III) domains linked to a transmembrane segment and a highly conserved cytoplasmic tail, which is involved in ankyrin-mediated interaction with the cytoskeleton (Davis et al., 1993). The extracellular part of three glycosyl-phosphatidylinositol–anchored members of the Ig superfamily, share a similar domain structure (six Ig and four instead of five FN-III domains) with L1 proteins: chicken axonin-1 (Zuellig et al., 1992), mammalian TAG-1 (Hasler et al., 1993), and F11 (Ranscht and Dours, 1988; Brummendorf et al., 1989).
To perform its diverse biological functions, L1 protein interacts homophilically (Grumet and Edelman, 1984; Lemmon et al., 1989; Doherty et al., 1995) and in a heterophilic manner with a variety of other cell adhesion molecules. Heterophilic interactions of L1 proteins with axonin-1/TAG-1 (Felsenfeld et al., 1994; Buchstaller et al., 1996; Lustig et al., 1999) and F11 (Morales et al., 1993) have been shown to be important in neurite outgrowth and fasciculation.
The importance of L1 for neurogenesis is demonstrated by several neuropathological disorders that are attributed to mutations in the human L1 gene (Kenwrick et al., 2000), which is located on the X chromosome in mouse and man (Djabali et al., 1990). The complex and variable neurological disorders associated with L1 mutations have been termed CRASH syndrome (for corpus callosum hypoplasia, mental retardation, adducted thumbs, spastic paraplegia, x-linked hydrocephalus; Fransen et al., 1998). Mutations located in the L1 ectodomain are generally correlated with a more severe phenotype than mutations in the cytoplasmic part.
L1 has been deleted in mice by gene knockout, and these mice show some defects similar to those associated with the human mutations. L1-deficient mice are smaller then wild-type litter mates and show axon guidance errors in the corticospinal tract, weak uncoordinated hind limbs, and delayed motor reaction (Dahme et al., 1997; Cohen et al., 1998).
Because there are currently no x-ray crystallographic or nuclear magnetic resonance data for L1, structural information has been inferred by comparison with homologous proteins and from studies mapping functional domains or binding sites within the L1 or related proteins. Bateman et al. (1996) proposed a structural model for L1 by aligning its Ig domains with telokin, which is the C-terminal domain of myosin light chain kinase, whose atomic structure has been solved (Holden et al., 1992). Their model features six Ig domains, identified as members of the I-set of cell adhesion domains (Harpaz and Chothia, 1994), which are linked directly to each other except for a seven-residue linker between domains D2 and D3.
In a study carried out by Rader et al. (1996) several domain deletion constructs of axonin-1 were expressed in COS cells to map their site of interaction with NgCAM, the chicken orthologue of mammalian L1. The first four domains of axonin-1 were sufficient for NgCAM binding. Deletions involving any one of the first four Ig domains led to complete loss of binding, suggesting that these four Ig domains represent a functional unit in the ectodomain. Comparable results had been obtained for deletion constructs of NgCAM (Kunz et al., 1998), where the most dramatic reduction in adhesion and interaction with axonin-1 was observed for deletions in the first four N-terminal Ig domains.
The crystal structure of hemolin, an insect Ig superfamily member involved in immune response after bacterial infection, has been solved (Su et al., 1998). In contrast to most tandem repeats of Ig domains, which are linear and extended, the crystal structure of hemolin showed an unusual compact horseshoe-shaped structure. The domain pair D1-D2 is almost linear, as is D3-D4, but a sharp bend between D2 and D3 establishes a close contact between domains D1 and D4 and between domains D2 and D3. A very similar horseshoe-shaped conformation was recently found in the crystal structure of Ig domains D1-D4 of axonin-1 (Freigang et al., 2000). Hemolin comprises four Ig domains, which share ∼38% identity with the first four Ig domains of neuroglian, the insect orthologue of mammalian L1. Sedimentation experiments indicated that neuroglian had a compact shape similar to hemolin (Su et al., 1998). Two features important for the horseshoe conformation were conserved in sequence alignments of hemolin, neuroglian, and human L1 (Su et al., 1998). First, many amino acids involved in the interfaces of D1-D4 and D2-D3 are conserved in all three proteins. Some of the pathological mutations of human L1 map to these conserved contact residues. Second, the seven-residue linking segment between D2 and D3, which is necessary to permit the bending, is conserved in length (but not in sequence). The consensus of all these studies is that the horseshoe shape should be conserved in all L1-related proteins.
De Angelis et al. (1999) studied the effect of point mutation variants on homophilic binding of L1 to wild-type L1 and on binding to axonin-1, F11, and F3. The mutations studied were all identified with neurological disorders in humans. Three mutations within the defined region of intramolecular contact of the horseshoe shaped conformation showed considerably reduced homophilic binding. This suggests that the horseshoe conformation is important for homophilic binding.
Drescher et al. (1996) visualized the structure of the L1 ectodomain by rotary-shadowing EM. The molecules appeared as extended rods, with two or more bends producing a spiral-like profile. A thickened, globular structure was frequently seen on one end, and antibody mapping suggested that this thickened segment corresponded to the FN-III domains (however, these images were difficult to interpret). This interpretation is in contrast to the expectations from the atomic structures of hemolin and axonin-1, that a thickened segment would correspond to the horseshoe of the Ig domains.
The purpose of our study was to resolve the contradiction between the structure reported from EM and the growing body of evidence for a compact conformation of Ig domains D1-D4. To this end we produced recombinant L1 proteins containing the Ig domains and analyzed them by electron microscopy (EM) and velocity sedimentation. For comparison, hemolin was analyzed in parallel. Surprisingly, rotary-shadowed L1 molecules appeared elongated, with no evidence of the horseshoe structure. However, a compact structure with a horseshoe fold was indicated by sedimentation studies and was eventually visualized directly by negative stain EM. This study thus confirms the predicted horseshoe confirmation and also visualizes for the first time its opening into an elongated shape, suggesting that the molecule can shift between these conformations.
MATERIALS AND METHODS
Proteins
The Fc fusion proteins, mL1-Fc, hL1-16Fc, and hL1–16TEVFc (Haspel et al., 2000, a and b) and Nr-Fc (Lustig et al., 1999) were constructed and produced as described. Briefly, 293 cell lines stably expressing these proteins were cultured in DMEM with 10% low Ig fetal calf serum (GIBCO, Grand Island, NY), 2 mM l-Gln, 50 μg/ml gentamicin (GIBCO). Fc fusion proteins were precipitated via addition of ammonium sulfate, resuspended, and dialyzed against phosphate-buffered saline, bound to protein A Sepharose beads, and eluted with 0.1 M glycine, pH 2.8, as described (Sakurai et al., 1998).
The protein fragment hL1–16TEV was obtained from hL1–16TEVFc by proteolytic digestion with tobacco etch virus proteinase (TEV) protease as described (Haspel et al., 2000a). Note that hL1–16TEVFc is identical to hL1–16Fc except for the inclusion of a TEV protease cleavage site in the hinge region. hL1–16TEVFc bound to protein A Sepharose beads was released by cleavage with 0.25 U/μg TEV protease (GIBCO). Finally the supernatant, containing hL1–16TEV, was collected and protein purity was verified by SDS-PAGE.
To produce deglycosylated hL1–16TEV (termed hL1–16TEV/PNGase), the protein was incubated with 1000 U/μg PNGase (New England Biolabs, Beverly, MA) in phosphate-buffered saline at 37°C for 6 h. Removal of carbohydrate chains was confirmed by loss of cross-reaction by the antibody HNK-1, which recognizes carbohydrate moieties that decorate native L1 (Schürmann, Haspel, Grummet, and Erickson, unpublished results).
Sedimentation Equilibrium to Estimate Molecular Mass and Carbohydrate
When analyzed on SDS-PAGE, deglycosylated L1–16-TEV PGNase ran at 69 kDa, exactly as predicted from the protein sequence (68,700 kDa). Fully glycosylated L1–16-TEV ran at 103 kDa, suggesting 34 kDa carbohydrate per L1–16 molecule. To check this seemingly high value we used sedimentation equilibrium to determine the mass of glycosylated L1–16-Fc (we did not have enough L1–16-TEV). Protein was dialyzed into 1 mM Tris, pH 7.9, and diluted 1:4 into H2O or D2O before centrifugation, to measure experimentally the partial specific volume of the protein, v2., and its total mass, M. Protein samples were sedimented at 5000 rpm at 20°C in an XL-A analytical ultracentrifuge Beckman, Fullerton, CA). The density of each buffer was measured, and the two experimental curves of protein vs. radius profile were fit to determine two parameters, v2 and M, with the use of software available with the XL-A. The best fit was achieved for v2 = 0.66 cm3/g, and M = 276 kDa. The peptide contributes 192 kDa to the dimeric molecule, leaving 42 kDa carbohydrate per L1–16-Fc monomer. Because there is only one N-linked glycosylation site in the Fc fragment, and nine in L1–16, we estimate that 40 kDa of this carbohydrate should be on L1–16. We thank Dr. Harvey Sage, Biochemistry, Duke University Medical Center, for this sedimentation equilibrium analysis.
Gradient Sedimentation and EM
Purified proteins were sedimented through 15–40% glycerol gradients in 0.2 M ammonium bicarbonate, in a Beckman SW55.1 rotor at 38,000 rpm for 16 h at 20°C. Gradients were eluted and fractionated. Sedimentation coefficients were estimated by comparing elution positions with standard proteins in a parallel gradient (catalase at 11.3 S, bovine serum albumin at 4.6 S, and ovalbumin at 3.5 S). Studies with additional standards have demonstrated that these glycerol gradients are linear in the range 11–3.5 S (Schürmann, Haspel, Grummet, and Erickson, unpublished results).
Rotary-shadowed EM specimens were prepared directly from the glycerol gradient fractions (Fowler and Erickson, 1979).
Negative staining of L1–16-TEV protein was carried out by applying protein at a concentration of 9 μg/ml in 20 mM Tris, pH 8.0, to carbon-coated grids. Before use the grids were glow discharged for 5 s at 600 V and 0.2 torr in a Technics West (San Jose, CA) HummerX. The protein solution was pipetted onto the carbon surface and removed after a few seconds. Two drops of 2% uranyl acetate solution (sterile filtered before use to remove precipitated salt) were flowed over the grid, and the remaining uranyl acetate was removed by suction with filter paper. The staining was repeated once and the grids were air dried.
EM pictures were taken at a nominal magnification of 50,000× with an EM301 (Phillips, Eindhoven, The Netherlands) at 80 kV. The magnification was calibrated by comparison with the 38.8-nm repeat in tropomyosin paracrystals (Erickson et al., 1981). EM negatives were scanned at 600 dpi on an ArcusII scanner (Agfa, Mortsel, Belgium; more recently we have used the inexpensive Epson Perfection 1200U with equivalent results) and further processed by Adobe Photoshop 4.0 (Adobe Systems, Mountain View, CA) to optimize density and contrast and to obtain prints at a 150,000- and 300,000-fold magnification. Dimensions of molecules were measured with the program NIH image (http://rsb.info.nih.gov/nih-image) by tracing along the shadowed or negatively stained particles. The dimensions from rotary-shadowing electron micrographs were corrected by subtraction of 1 nm for the metal shell at each end.
RESULTS
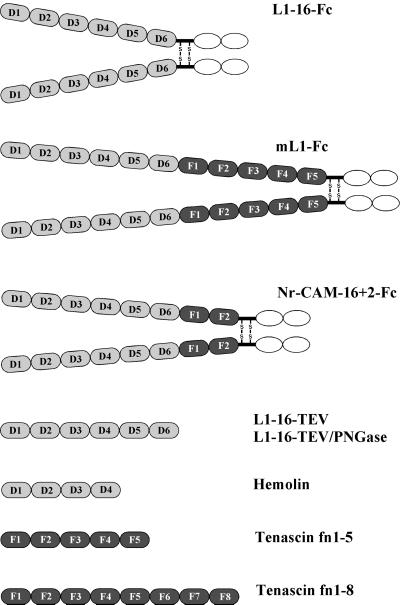
The extracellular domain of the neuronal cell adhesion molecules L1 and NrCAM, and parts of these molecules, were engineered as fusion proteins with the constant antibody Fc region at the carboxy terminus. The Fc fusion proteins have an antibody-like structure where each of the variable regions is replaced by the ectodomain of L1, and the Fc portion forms a dimeric molecule. The constructs are diagrammed in Figure 1. L1–16-Fc comprises the six amino-terminal Ig domains of human L1 fused to the antibody Fc domain. The mL1-Fc protein contains the entire extracellular domain of mouse L1 (six Ig domains and five FN-III domains) fused with the Fc domain. The NrCAM-16+2-Fc protein comprised six Ig domains at the amino terminus followed by two FN-III domains and the antibody Fc domain. Hemolin domains 1–4, and two tenascin fragments encompassing stretches of FN-III domains 1 through 5 or 1 through 8 were included in this study to compare their sedimentation behavior and EM structure to the results obtained for the L1 proteins.
Figure 1.
Schematic structures of the constructs investigated. Ig domains are displayed as gray ovals, FN-III-like domains are displayed as dark ovals, and the constant antibody Fc domains are displayed in open ovals. Ig domains are labeled D1–D4/D6 and FN-III-like domains are labeled F1–F8.
Rotary-Shadowing EM
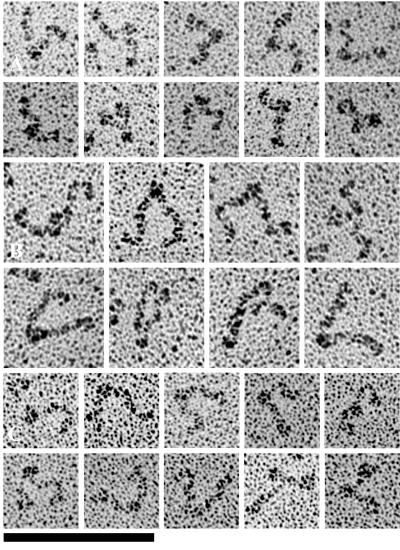
Rotary-shadowing EM of the dimeric L1-Fc constructs showed V-shaped molecules with two rods extending from a larger globular domain, which is identified as the Fc (Figure 2). Lengths were quantitated by tracing along these extended arms over the whole length of the shadowed molecule, including the Fc domain. The full-length mL1-Fc molecules in Figure 2B are clearly longer than the L1–16-Fc in Figure 2A; NrCAM-16 + 2-Fc (Figure 2C) is intermediate in length. The molecules appeared extended and somewhat flexible, with irregular gradual curves. They sometimes showed sharp bends with an angle of ∼90°. Occasionally a whole arm of a dimeric molecule curves in a 180° turn to give a large globular structure.
Figure 2.
Electron micrographs of rotary-shadowed L1–16-Fc molecules (A), ml1-Fc molecules (B), and Nr-CAM-16+2-Fc molecules (C). Bar, 100 nm.
If the first four Ig domains folded back into a horseshoe conformation, like that demonstrated for hemolin (Su et al., 1998) and axonin-1 (Freigang et al., 2000), we would expect to see a pronounced globular domain at the ends of the arms. This was almost never seen. The constant thickness of the arms implies that the molecules are fully extended, and this is confirmed by length measurements (Table 1). We divided the measured length by the total number of Igs (and where present FN-III domains). For each of the three molecules this gave a length of approximately 4 nm per domain (see DISCUSSION), which is very close to the length of a single Ig domain in published x-ray structures. These lengths confirm that the three molecules are fully extended in the rotary-shadowed specimens.
Table 1.
Contour lengths and sedimentation coefficients of L1 chimeras and segments
| Protein | Length (nm) | Number of domains | Mass (kDa) | Length/domain (nm) | S | Smax/S |
|---|---|---|---|---|---|---|
| L1-16-Fc | 31.7 ± 3.7 | 2× (6 Ig+ Fc) | 278 | 4.0 | 10.6 | |
| mL1-Fc | 50.5 ± 3.6 | 2× (6 Ig+ 5 FN + Fc) | 3.9 | 11 | ||
| NrCAM-16+2-Fc | 40.8 ± 3.9 | 2× (6 Ig+ 2 FN + Fc) | 4.1 | 8.7 | ||
| L1-16-TEV | 26.1 ± 1.2 | 6 Ig | 103–109 | 4.4 | 5.4 | |
| L1-16-TEV/PNGase | 26.3 ± 2.5 | 6 Ig | 69 | 4.4 | 4.5 | 1.36 |
| Hemolin | 8.8 ± 0.9 | 4 Ig | 44 | 4.4a | 3.5 | 1.29 |
| TNfn1-5 | 14.7 | 5 FN | 50 | 2.9 | 3.0 | 1.65 |
| TNfn1-8 | 24.6 | 8 FN | 79 | 3.0 | 3.2 | 2.08 |
The mass of L1-16-Fc is from sedimentation equilibrium. The mass of L1-16-TEV is from SDS-PAGE (103 kDa) or deduced from the sedimentation equilibrium of L1-16-Fc, assuming all the carbohydrate of this chimera is on L1-16. The masses of L1-16-TEV/PGNase, hemolin, and TNfn1-5 were calculated from the amino acid sequence. S values were determined in the present study by glycerol gradient sedimentation.
For hemolin the 8.8-nm length was assumed to cover two domains in the horseshoe conformation.
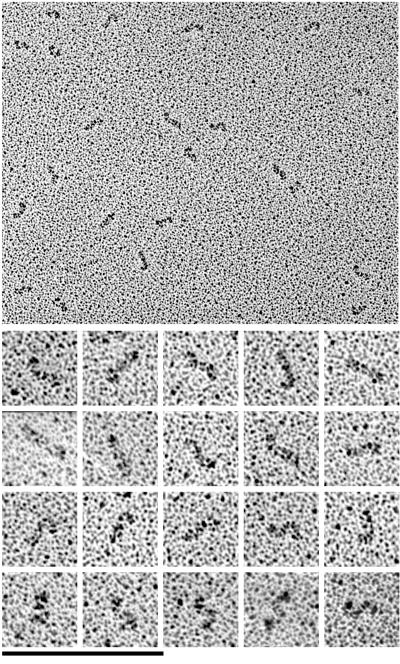
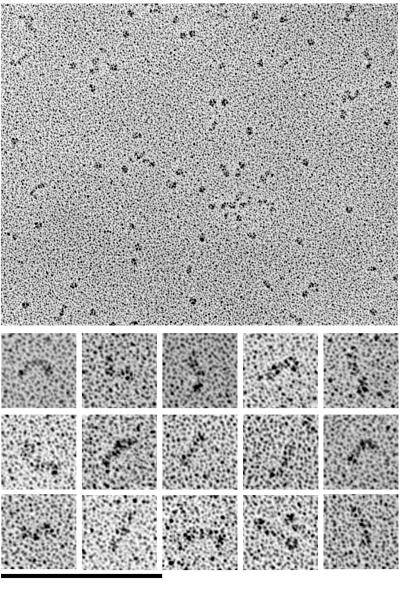
The dimeric structure with the addition of the Fc fragment increased the possibility of some confusion, so we also prepared samples of monomeric L1–16 by cutting off the Fc with TEV. This protein was investigated in its generic glycosylated form, referred to as L1–16-TEV, and also in an enzymatically deglycosylated form, L1–16-TEV/PNGase. The electron micrographs of L1–16-TEV molecules (Figure 3) show a simple structure, short rods that are either straight or contain one or two bends. Molecules with a single bend appear to be curved at one end of the rod without having a distinct bending position. If the molecules are bent twice they appear S-shaped. The appearance of the S-shaped molecules ranges considerably from an elongated slightly curved shape to a sharply bent S-form (Figure 3, bottom row). We counted 60 single molecules and estimated 58% of these molecules to have S-shape to a variable degree; 20% had a single bend and 22% were straight. The curved part of the structures appears to be open and the angle ranges from a flat angle of ∼120° to a sharp bend of approximately 30°. The deglycosylated L1–16-TEV/PNGase was essentially identical in shape and length (Figure 4; Table 1). None of the molecules had a globular domain that would suggest a horseshoe conformation for D1-D4. Furthermore, the average length of 26.1 ± 1.2 nm (n = 23) gave 4.4 nm per domain (Table 1), confirming the extended structure.
Figure 3.
Electron micrographs of rotary-shadowed L1–16-TEV molecules. Top, a field with L1–16-TEV molecules; bottom, selected molecules at a twofold magnification. Bars: top, 200 nm; bottom, 100 nm.
Figure 4.
Electron micrographs of rotary-shadowed L1–16-TEV/PNGase molecules. Top, a field with L1–16-TEV/PNGase molecules; bottom, a selection of single molecules at a twofold magnification. Bars: top, 200 nm; bottom, 100 nm. The globular molecules are the N-glycosidase, which cosediments with the L1–16-TEV/PNGase in the glycerol gradient.
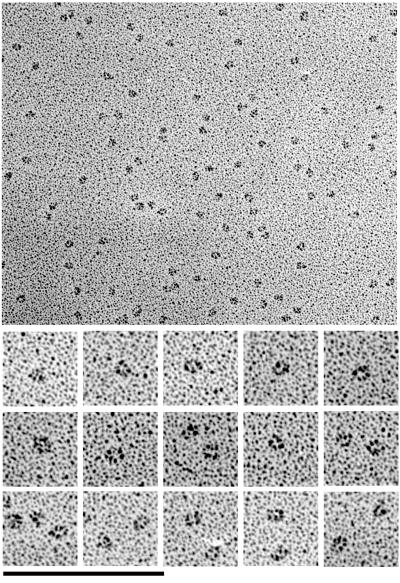
The elongated conformation of these L1 constructs contradicted the expectation of a horseshoe conformation already found for the related proteins hemolin and axonin-1. We wanted to compare directly the rotary-shadowed L1 with hemolin and were able to do this with a sample of hemolin D1-D4 (Su et al., 1998), the same protein that was used for crystallography, generously provided by Dr. Xiao-Dong Su (University of Lund, Sweden; Figure 5). This protein had the expected globular shape, in contrast to the elongated shape of the L1 proteins.
Figure 5.
Electron micrographs of rotary-shadowed hemolin molecules. Top, a field with hemolin molecules; bottom, a selection of single hemolin molecules at a twofold magnification. Bars: top, 200 nm; bottom, 100 nm.
Because the hemolin fragment contains only four Ig domains, we also wanted to compare it to an L1 fragment of similar length. Therefore we visualized hL1–14Fc, which contains the first four Ig domains of L1, via rotary-shadowing EM. Like hL1–16Fc, ml1-Fc, and NrCAM-Fc this protein exhibited elongated L1 arms consistent with an extended structure for Ig domains 1–4 (Schürmann, Haspel, Grummet, and Erickson, unpublished results). In summary, the rotary-shadowing EM confirmed the compact horseshoe conformation for hemolin but suggests that L1 and NrCAM are fully extended. However, data described below from sedimentation analysis and negative stain contradict this view and suggest that the first four domains of L1 are indeed predominantly folded into the horseshoe conformation in solution.
Gradient Sedimentation Analysis to Estimate Molecular Shape
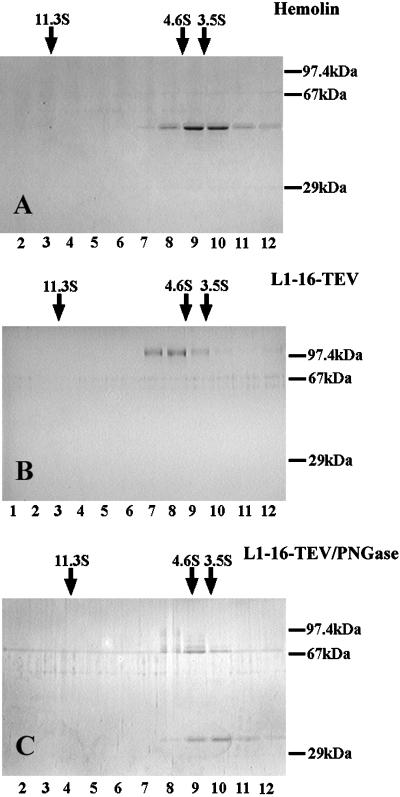
We normally sediment proteins on a glycerol gradient as a final purification step before rotary shadowing. This also gives us the sedimentation coefficient, which can indicate the conformation of the molecules in solution. The hydrodynamic parameter that we find most useful is Smax/S, where Smax is the maximum possible sedimentation coefficient for a protein of the given mass, corresponding to a sphere of the minimum diameter to contain the given mass of protein, with no water of hydration. The ratio Smax/S is the same as f/fmin, where f is the actual frictional ratio of the hydrated protein, and fmin is the frictional coefficient of the unhydrated minimal sphere (Tanford, 1961). Smax is calculated from the Svedberg equation assuming the partial specific volume of the protein is 0.73 cm3/g (this was the value calculated for L1–16 from its amino acid composition and is a typical value (Perkins, 1986); v2 ranging from 0.71–0.75 would have only a small effect on our estimation of Smax). Globular proteins typically have Smax/S of 1.2–1.3 (for example, our standard proteins catalase and serum albumin have Smax/S 1.20 and 1.29), and the ratio increases to 1.6–2 or more for elongated proteins (Erickson, 1982).
Calculation of Smax/S is less straightforward for glycoproteins, because the carbohydrate significantly increases the density of the protein. On the other hand, the projecting sugar chains will increase the frictional coefficient. We therefore limited our analysis to the unglycosylated proteins, L1–16-TEV/PNGase, hemolin, and two elongated segments of FN-III domains from tenascin (Aukhil et al., 1993). The Smax/S = 1.29 of hemolin is completely consistent with the compact globular (horseshoe) shape seen by x-ray diffraction and by our EM (Figure 6). The Smax/S = 1.36 for L1–16-TEV/PNGase is very close to that of hemolin and much smaller than the elongated tenascin segments with similar contour lengths (Table 1). It is consistent with the first four domains being folded into a horseshoe and the last two domains projecting from it.
Figure 6.
Sedimentation analysis of hemolin, L1–16-TEV and L1–16-TEV/PNGase. Samples were sedimented through a glycerol gradient, and fractions from the gradient were analyzed by SDS-PAGE. The positions and S-values of standard proteins in a parallel gradient are indicated by arrows above the gel. Fraction numbers are indicated below the gel. The low number fractions on the left correspond to the bottom of the gradient. The starting material before sedimentation is shown on the right.
Thus the hydrodynamics suggest that the L1 domains 1–4 may indeed be folded into a horseshoe in solution and that the unfolded conformation may be induced during the preparation of the rotary-shadowed specimens.
Negative Stain EM
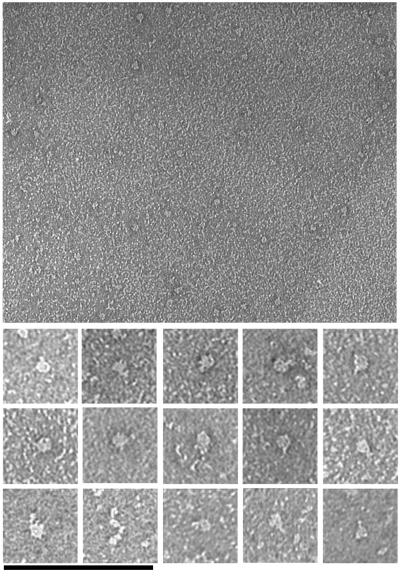
To obtain an independent view of the structure, we examined L1–16-TEV by negative stain EM. Figure 7 shows a large field of L1–16-TEV molecules and selected molecules (Figure 7, bottom). The molecules have mostly a compact globular conformation with occasionally a small arm projecting. Elongated molecules were observed very rarely. An example is displayed in Figure 7 (bottom) among the selected molecules. Its measured length is 30.8 nm. Measurements of the compact molecules (by tracing along the longer axis of the globular particles) gave a diameter of 8.9 ± 1.1 nm (n = 13). These electron micrographs are completely consistent with the sedimentation data and suggest that L1–16-TEV molecules have a compact structure, in which domains 1–4 are folded into a horseshoe, with domains 5–6 projecting out (but usually not visible in negative stain).
Figure 7.
Electron micrographs of negatively stained L1–16-TEV molecules. Top, a field of negatively stained molecules; bottom, selected molecules at a twofold higher magnification. Bars: top, 200 nm; bottom, 100 nm.
DISCUSSION
In this study we have visualized two conformational states of L1. Rotary-shadowed molecules appeared to be fully extended, and the lengths agreed with expectations based on dimensions of individual Ig and FN-III domains. The length for an FN-III domain should be ∼3.5 nm (Leahy et al., 1996), and the Ig domains of hemolin are 4.2 nm (Su et al., 1998); the D3-D4 domains of axonin-1 are ∼4.7 nm (Freigang et al., 2000) but this is unusually long.
EM images of rotary-shadowed L1 have been presented in two previous studies. Drescher et al. (1996) interpreted their images as showing a folded, globular conformation on one end of the molecules. However, they identified the folded segment as the FN-III domains rather than the N-terminal Ig domains where the horseshoe is expected. We believe their molecules are mostly elongated, just as ours. Their L1 molecules were a mixture of a 180-kDa form with 11 domains and a 140-kDa form with 8–9 domains. These would measure 44 and 32 nm if fully extended. Their measured average lengths were 43, 34, 33.5, and 31 nm for different classes of images, corresponding to the expectation for extended molecules. Although a thickened segment is seen on the end of some of their molecules, we believe most of their images correspond to the elongated conformation, just as we have found for rotary-shadowed molecules.
In a more recent study Hall et al. (2000) presented images of rotary-shadowed L1 and suggested a folded structure at one end that could correspond to the horseshoe conformation of the first four Ig domains. However, our own measurements of their molecules show that many of them are much too long to be single molecules. The shorter ones, which mostly do not show a thickened end, are approximately the 44-nm length expected for a fully elongated L1. Thus, in contrast to the interpretation of the authors, we believe that this study also is in agreement with our interpretation that rotary-shadowed L1 is primarily in an elongated conformation.
In contrast to the elongated conformation of L1 Ig domains, our rotary-shadowed images of hemolin showed a compact structure completely consistent with the horseshoe shape seen in the x-ray structure. We used sedimentation analysis to investigate this further, and this suggested that the Ig domains of L1 were actually in the horseshoe conformation in solution. We then turned to negative stain EM, which showed a compact globular shape consistent with the horseshoe conformation.
Why did rotary shadowing and negative stain show such different conformations? We suggest that the contact with the mica may disrupt the noncovalent bonds connecting D1-D2 to D4-D3. There is a precedent for protein-protein bonds being disrupted during sample preparation. Factor XIII occurs either as a homodimer or heterotetramer, which are bound in a high-affinity complex in solution. Yet, when examined by rotary shadowing the subunits frequently separated from each other and were found in a variably close proximity but not in contact (Carrell et al., 1989). Our interpretation of this was that the mica substrate caused a small distortion of the contacting subunit that weakened the noncovalent interfaces holding the complex together. A similar effect might apply to the L1 molecules, in which the contact with mica could weaken the bonds holding domains 1–4 in the horseshoe conformation. In contrast to the occasional dissociation seen in rotary-shadowed specimens, there is no documented case of this happening in negative stain. The primary difference may be in the substrate interaction. For negative stain the proteins are adsorbed onto a carbon film in an aqueous buffer, whereas for rotary-shadowing proteins are adsorbed onto mica in a high concentration of glycerol.
An earlier study examined full-length axonin-1 by negative stain EM and found globular particles, many with a central depression, that were interpreted as a kind of “super-horseshoe.” Rader et al. (1996) proposed a model in which the first four Ig domains were folded into a compact structure, similar to the simple horseshoe, and the molecule was folded again between Ig 6 and FN1. The authors reported a diameter of 10 nm for their negatively stained particles and suggested that this would be sufficient to contain all 11 domains of the full molecule. However, this is very close to the 9-nm diameter that we found for the compact structure containing only the first four Ig domains. We suggest that their images actually correspond to the compact horseshoe of the first four Ig domains, and the remaining domains extend from this as a tail too thin to visualize in negative stain.
It is interesting that rotary shadowing showed L1 opened up into the elongated conformation, whereas hemolin preserved its horseshoe fold. This suggests that the intramolecular bonds maintaining the horseshoe conformation are weaker, or perhaps more easily broken by mica contact, in L1 than in hemolin. This also suggests that the open, elongated conformation may exist in equilibrium with the folded, horseshoe conformation. Our sedimentation data indicate that the equilibrium is strongly shifted toward the horseshoe conformation in solution, even for L1, but molecules should spend some fraction of their time in the open conformation.
One of the most important unanswered questions is which conformation is active for cell adhesion—the compact horseshoe or the open conformation. The simplest model would postulate that the molecules retain the horseshoe conformation, and cell adhesion is mediated by contacts on the outside of the horseshoes on opposing cells. However, Su et al. (1998) proposed an interesting alternative, in which the horseshoes open up, and the same contacts that maintained the horseshoe, D1-D2 binding D4-D3, could then bridge the L1 molecules from the opposing cells. One thermodynamic problem not addressed in this model is how dimerization of the extended conformation could be thermodynamically more favorable than the same bonds within the closed horseshoe. The effective concentration of D4-D3 relative to D1-D2 within a monomer is extremely high, ∼3 mM (assuming that the center of D3-D4 is limited to a ∼5-nm radius sphere around the tethered D1-D2). For dimerization of extended molecules to be favorable, one would need a comparably high density of L1 on the opposing surfaces. The simplest model, where adhesion is mediated by contacts of fully folded horseshoes, is still attractive.
ACKNOWLEDGMENTS
This work was supported by NIH grants CA-47056 (H.P.E.) and HD-37353 (M.G.).
Abbreviations used:
- EM
electron microscopy
- FN-III
fibronectin type III
- Ig
immunoglobulin
- TEV
tobacco etch virus proteinase
REFERENCES
- Aukhil I, Joshi P, Yan Y, Erickson HP. Cell- and heparin-binding domains of the hexabrachion arm identified by tenascin expression proteins. J Biol Chem. 1993;268:2542–2553. [PubMed] [Google Scholar]
- Bateman A, Jouet M, MacFarlane J, Du JS, Kenwrick S, Chothia C. Outline structure of the human L1 cell adhesion molecule and the sites where mutations cause neurological disorders. EMBO J. 1996;15:6050–6059. [PMC free article] [PubMed] [Google Scholar]
- Bieber AJ, Snow PM, Hortsch M, Patel NH, Jacobs JR, Traquina ZR, Schilling J, Goodman CS. Drosophila neuroglian: a member of the immunoglobulin superfamily with extensive homology to the vertebrate neural adhesion molecule L1. Cell. 1989;59:447–460. doi: 10.1016/0092-8674(89)90029-9. [DOI] [PubMed] [Google Scholar]
- Brummendorf T, Kenwrick S, Rathjen FG. Neural cell recognition molecule L1: from cell biology to human hereditary brain malformations. Curr Opin Neurobiol. 1998;8:87–97. doi: 10.1016/s0959-4388(98)80012-3. [DOI] [PubMed] [Google Scholar]
- Brummendorf T, Wolff JM, Frank R, Rathjen FG. Neural cell recognition molecule F11: homology with fibronectin type III and immunoglobulin type C domains. Neuron. 1989;2:1351–1361. doi: 10.1016/0896-6273(89)90073-1. [DOI] [PubMed] [Google Scholar]
- Buchstaller A, Kunz S, Berger P, Kunz B, Ziegler U, Rader C, Sonderegger P. Cell adhesion molecules NgCAM and axonin-1 form heterodimers in the neuronal membrane and cooperate in neurite outgrowth promotion. J Cell Biol. 1996;135:1593–1607. doi: 10.1083/jcb.135.6.1593. [DOI] [PMC free article] [PubMed] [Google Scholar]
- Burgoon MP, Grumet M, Mauro V, Edelman GM, Cunningham BA. Structure of the chicken neuron-glia cell adhesion molecule, Ng-CAM: origin of the polypeptides and relation to the Ig superfamily. J Cell Biol. 1991;112:1017–1029. doi: 10.1083/jcb.112.5.1017. [DOI] [PMC free article] [PubMed] [Google Scholar]
- Carrell NA, Erickson HP, McDonagh J. Electron microscopy and hydrodynamic properties of factor XIII subunits. J Biol Chem. 1989;264:551–556. [PubMed] [Google Scholar]
- Cohen NR, Taylor JS, Scott LB, Guillery RW, Soriano P, Furley AJ. Errors in corticospinal axon guidance in mice lacking the neural cell adhesion molecule L1. Curr Biol. 1998;8:26–33. doi: 10.1016/s0960-9822(98)70017-x. [DOI] [PubMed] [Google Scholar]
- Dahme M, Bartsch U, Martini R, Anliker B, Schachner M, Mantei N. Disruption of the mouse L1 gene leads to malformations of the nervous system. Nat Genet. 1997;17:346–349. doi: 10.1038/ng1197-346. [DOI] [PubMed] [Google Scholar]
- Davis JQ, McLaughlin T, Bennett V. Ankyrin-binding proteins related to nervous system cell adhesion molecules: candidates to provide transmembrane and intercellular connections in adult brain. J Cell Biol. 1993;121:121–133. doi: 10.1083/jcb.121.1.121. [DOI] [PMC free article] [PubMed] [Google Scholar]
- De Angelis E, MacFarlane J, Du JS, Yeo G, Hicks R, Rathjen FG, Kenwrick S, Brummendorf T. Pathological missense mutations of neural cell adhesion molecule L1 affect homophilic and heterophilic binding activities. EMBO J. 1999;18:4744–4753. doi: 10.1093/emboj/18.17.4744. [DOI] [PMC free article] [PubMed] [Google Scholar]
- Djabali M, Mattei MG, Nguyen C, Roux D, Demengeot J, Denizot F, Moos M, Schachner M, Goridis C, Jordan BR. The gene encoding L1, a neural adhesion molecule of the immunoglobulin family, is located on the X chromosome in mouse and man. Genomics. 1990;7:587–593. doi: 10.1016/0888-7543(90)90203-7. [DOI] [PubMed] [Google Scholar]
- Doherty P, Williams E, Walsh FS. A soluble chimeric form of the L1 glycoprotein stimulates neurite outgrowth. Neuron. 1995;14:57–66. doi: 10.1016/0896-6273(95)90240-6. [DOI] [PubMed] [Google Scholar]
- Drescher B, Spiess E, Schachner M, Probstmeier R. Structural analysis of the murine cell adhesion molecule L1 by electron microscopy and computer-assisted modelling. Eur J Neurosci. 1996;8:2467–2478. doi: 10.1111/j.1460-9568.1996.tb01541.x. [DOI] [PubMed] [Google Scholar]
- Erickson HP. Electron microscopy vs. hydrodynamics for determining the shape of protein molecules. Biophys J. 1982;37:96a. [Google Scholar]
- Erickson HP, Carrell NA, McDonagh J. Fibronectin molecule visualized in electron microscopy: a long, thin, flexible strand. J Cell Biol. 1981;91:673–678. doi: 10.1083/jcb.91.3.673. [DOI] [PMC free article] [PubMed] [Google Scholar]
- Felsenfeld DP, Hynes MA, Skoler KM, Furley AJ, Jessell TM. TAG-1 can mediate homophilic binding, but neurite outgrowth on TAG-1 requires an L1-like molecule and beta 1 integrins. Neuron. 1994;12:675–690. doi: 10.1016/0896-6273(94)90222-4. [DOI] [PubMed] [Google Scholar]
- Fowler WE, Erickson HP. Trinodular structure of fibrinogen: confirmation by both shadowing and negative stain electron microscopy. J Mol Biol. 1979;134:241–249. doi: 10.1016/0022-2836(79)90034-2. [DOI] [PubMed] [Google Scholar]
- Fransen E, Van Camp G, D'Hooge R, Vits L, Willems PJ. Genotype-phenotype correlation in L1 associated diseases. J Med Genet. 1998;35:399–404. doi: 10.1136/jmg.35.5.399. [DOI] [PMC free article] [PubMed] [Google Scholar]
- Freigang J, Proba K, Leder L, Diederichs K, Sonderegger P, Welte W. The crystal structure of the ligand binding module of axonin-1/TAG-1 suggests a zipper mechanism for neural cell adhesion. Cell. 2000;101:425–433. doi: 10.1016/s0092-8674(00)80852-1. [DOI] [PubMed] [Google Scholar]
- Grumet M, Edelman GM. Heterotypic binding between neuronal membrane vesicles and glial cells is mediated by a specific cell adhesion molecule. J Cell Biol. 1984;98:1746–1756. doi: 10.1083/jcb.98.5.1746. [DOI] [PMC free article] [PubMed] [Google Scholar]
- Grumet M, Mauro V, Burgoon MP, Edelman GM, Cunningham BA. Structure of a new nervous system glycoprotein, Nr-CAM, and its relationship to subgroups of neural cell adhesion molecules. J Cell Biol. 1991;113:1399–1412. doi: 10.1083/jcb.113.6.1399. [DOI] [PMC free article] [PubMed] [Google Scholar]
- Hall H, Bozic D, Fauser C, Engel J. Trimerization of cell adhesion molecule L1 mimics clustered L1 expression on the cell surface: influence on L1-ligand interactions and on promotion of neurite outgrowth. J Neurochem. 2000;75:336–346. doi: 10.1046/j.1471-4159.2000.0750336.x. [DOI] [PubMed] [Google Scholar]
- Harpaz Y, Chothia C. Many of the immunoglobulin superfamily domains in cell adhesion molecules and surface receptors belong to a new structural set which is close to that containing variable domains. J Mol Biol. 1994;238:528–539. doi: 10.1006/jmbi.1994.1312. [DOI] [PubMed] [Google Scholar]
- Hasler TH, Rader C, Stoeckli ET, Zuellig RA, Sonderegger P. cDNA cloning, structural features, and eucaryotic expression of human TAG-1/axonin-1. Eur J Biochem. 1993;211:329–339. doi: 10.1111/j.1432-1033.1993.tb19902.x. [DOI] [PubMed] [Google Scholar]
- Haspel J, Blanco C, Jacob J, Grumet M. A system for cleavable Fc fusion proteins using TEV protease. Biotechniques. 2000a;30:60–61. doi: 10.2144/01301st01. , 64–66. [DOI] [PubMed] [Google Scholar]
- Haspel J, Friedlander DR, Ivgy-May N, Chickramane S, Roonprapunt C, Chen S, Schachner M, Grumet M. Critical and optimal Ig domains for promotion of neurite outgrowth by L1/Ng-CAM. J Neurobiol. 2000b;42:287–302. [PubMed] [Google Scholar]
- Holden HM, Ito M, Hartshorne DJ, Rayment I. X-ray structure determination of telokin, the C-terminal domain of myosin light chain kinase, at 2.8 A resolution. J Mol Biol. 1992;227:840–851. doi: 10.1016/0022-2836(92)90226-a. [DOI] [PubMed] [Google Scholar]
- Holm J, Hillenbrand R, Steuber V, Bartsch U, Moos M, Lubbert H, Montag D, Schachner M. Structural features of a close homologue of L1 (CHL1) in the mouse: a new member of the L1 family of neural recognition molecules. Eur J Neurosci. 1996;8:1613–1629. doi: 10.1111/j.1460-9568.1996.tb01306.x. [DOI] [PubMed] [Google Scholar]
- Hortsch M. The L1 family of neural cell adhesion molecules: old proteins performing new tricks. Neuron. 1996;17:587–593. doi: 10.1016/s0896-6273(00)80192-0. [DOI] [PubMed] [Google Scholar]
- Hortsch M. Structural and functional evolution of the L1 family: are four adhesion molecules better than one? Mol Cell Neurosci. 2000;15:1–10. doi: 10.1006/mcne.1999.0809. [DOI] [PubMed] [Google Scholar]
- Huang Y, Jellies J, Johansen KM, Johansen J. Differential glycosylation of tractin and Leech CAM, two novel Ig superfamily members, regulates neurite extension and fascicle formation. J Cell Biol. 1997;138:143–157. doi: 10.1083/jcb.138.1.143. [DOI] [PMC free article] [PubMed] [Google Scholar]
- Kenwrick S, Watkins A, Angelis ED. Neural cell recognition molecule L1: relating biological complexity to human disease mutations. Hum Mol Genet. 2000;9:879–886. doi: 10.1093/hmg/9.6.879. [DOI] [PubMed] [Google Scholar]
- Kunz S, Spirig M, Ginsburg C, Buchstaller A, Berger P, Lanz R, Rader C, Vogt L, Kunz B, Sonderegger P. Neurite fasciculation mediated by complexes of axonin-1 and Ng cell adhesion molecule. J Cell Biol. 1998;143:1673–1690. doi: 10.1083/jcb.143.6.1673. [DOI] [PMC free article] [PubMed] [Google Scholar]
- Leahy DJ, Aukhil I, Erickson HP. 2.0 Å crystal structure of a four-domain segment of human fibronectin encompassing the RGD loop and synergy region. Cell. 1996;84:155–164. doi: 10.1016/s0092-8674(00)81002-8. [DOI] [PubMed] [Google Scholar]
- Lemmon V, Farr KL, Lagenaur C. L1-mediated axon outgrowth occurs via a homophilic binding mechanism. Neuron. 1989;2:1597–1603. doi: 10.1016/0896-6273(89)90048-2. [DOI] [PubMed] [Google Scholar]
- Lustig M, Sakurai T, Grumet M. Nr-CAM promotes neurite outgrowth from peripheral ganglia by a mechanism involving axonin-1 as a neuronal receptor. Dev Biol. 1999;209:340–351. doi: 10.1006/dbio.1999.9250. [DOI] [PubMed] [Google Scholar]
- Morales G, Hubert M, Brummendorf T, Treubert U, Tarnok A, Schwarz U, Rathjen FG. Induction of axonal growth by heterophilic interactions between the cell surface recognition proteins F11 and Nr-CAM/Bravo. Neuron. 1993;11:1113–1122. doi: 10.1016/0896-6273(93)90224-f. [DOI] [PubMed] [Google Scholar]
- Perkins SJ. Protein volumes and hydration effects: the calculations of partial specific volumes, neutron scattering matchpoints and 280-nm absorption coefficients for proteins and glycoproteins from amino acid sequences. Eur J Biochem. 1986;157:169–180. doi: 10.1111/j.1432-1033.1986.tb09653.x. [DOI] [PubMed] [Google Scholar]
- Rader C, Kunz B, Lierheimer R, Giger RJ, Berger P, Tittmann P, Gross H, Sonderegger P. Implications for the domain arrangement of axonin-1 derived from the mapping of its NgCAM binding site. EMBO J. 1996;15:2056–2068. [PMC free article] [PubMed] [Google Scholar]
- Ranscht B, Dours MT. Sequence of contactin, a 130 kD glycoprotein concentrated in areas of interneuronal contact, defines a new member of the immunoglobulin supergene family in the nervous system. J Cell Biol. 1988;107:1561–1573. doi: 10.1083/jcb.107.4.1561. [DOI] [PMC free article] [PubMed] [Google Scholar]
- Rathjen FG, Schachner M. Immunocytological and biochemical characterization of a new neuronal cell surface component (L1 antigen) which is involved in cell adhesion. EMBO J. 1984;3:1–10. doi: 10.1002/j.1460-2075.1984.tb01753.x. [DOI] [PMC free article] [PubMed] [Google Scholar]
- Sakurai T, Roonprapunt C, Grumet M. Purification of Ig-fusion proteins from medium containing Ig. BioTechniques. 1998;25:382–385. doi: 10.2144/98253bm09. [DOI] [PubMed] [Google Scholar]
- Su XD, Gastinel LN, Vaughn DE, Faye I, Poon P, Bjorkman PJ. Crystal structure of hemolin: a horseshoe shape with implications for homophilic adhesion. Science. 1998;281:991–995. doi: 10.1126/science.281.5379.991. [DOI] [PubMed] [Google Scholar]
- Tanford C. Physical Chemistry of Macromolecules. New York: John Wiley; 1961. [Google Scholar]
- Volkmer H, Hassel B, Wolff JM, Frank R, Rathjen FG. Structure of the axonal surface recognition molecule neurofascin and its relationship to a neural subgroup of the immunoglobulin superfamily. J Cell Biol. 1992;118:149–161. doi: 10.1083/jcb.118.1.149. [DOI] [PMC free article] [PubMed] [Google Scholar]
- Wolff JM, Frank R, Mujoo K, Spiro RC, Reisfeld RA, Rathjen FG. A human brain glycoprotein related to the mouse cell adhesion molecule L1. J Biol Chem. 1988;263:11943–11947. [PubMed] [Google Scholar]
- Zuellig RA, Rader C, Schroeder A, Kalousek MB, Von Bohlen und Halbach F, Osterwalder T, Inan C, Stoeckli ET, Affolter H-U, Fritz A, et al. The axonally secreted cell adhesion molecule, axonin-1: primary structure, immunoglobulin-like and fibronectin-type-III-like domains and glycosyl-phosphatidylinositol anchorage. Eur J Biochem. 1992;204:453–463. doi: 10.1111/j.1432-1033.1992.tb16655.x. [DOI] [PubMed] [Google Scholar]


