Abstract
Prestress in tissue is currently detected through destructive methods which obviate both in vivo and longitudinal assessment. We hypothesized that prestress could be detected and quantified by analyzing the microstructure of the extracellular matrix at different spatial scales using non-invasive and non-destructive optical imaging. A simple model of tissue prestress was created using fibroblast-mediated contraction of collagen gels around a central mandrel. Using a quantitative, multiscale, image processing technique, termed generalized image correlation spectroscopy (GICS) of second harmonic images, collagen fiber number and alignment at three different length scales characteristic of the collagen fibril, collagen fiber, and cell were analyzed. GICS fiber alignment (σmaj/min) was significantly different across load state, level of prestress, and length scale. The largest fiber ratio, and thus highest alignment, was seen in prestressed, externally loaded gels at a length scale equivalent to the size of the fibroblast cells. Alignment at both fiber and cell scale correlated with prestress in this model. We conclude that GICS of second harmonic images of collagen can predict prestress, and that microstructural organization at the collagen fiber and cell scale are the primary determinants of prestress in cellularized collagen gels.
Keywords: collagen, prestress, fiber alignment, multiphoton microscopy
Introduction
Prestress, the mechanical condition in which residual stresses are present in an unloaded specimen, is frequently observed in tissue in vivo[1]. For example, in the cardiovascular system, prestress serves to equalize stresses across the arterial wall [2], thus increasing resistance to pressure [3]. Prestress can be altered in pathologic conditions such as hypertension [3-5] and atherosclerosis [6], which may affect vessel wall loading [7], and progression of the disease by impacting stromal cell phenotype [8]. Analysis of prestress is traditionally done destructively, by analyzing the final configuration of the tissue once the prestress is removed by cutting the structure [1, 7]. It is not currently possible to assess tissue prestress nondestructively while the tissue is in the prestressed state. Tissue culture models of prestress and methods to analyze prestress nondestructively could enhance our understanding of prevalent diseases such as atherosclerosis and hypertension, as well as aid in the design of tissue engineered arterial equivalents.
The microstructure of the tissue's extracellular matrix should be the primary determinant of prestress. No previous work has attempted to link ECM structure and prestress, though several techniques have been developed to analyze ECM morphology and mechanical behavior [9-14]. Furthermore, the relationship between ECM structure and mechanical behavior is complex, and may depend on specific characteristic length scales.
Polarized light microscopy, which detects aligned, birefringent, collagen fibrils, has shown higher fiber alignment in stressed or anisotropically contracted gels [12, 13, 15-18]. However, the relationship between birefringence and fiber microstructure is complex and nonlinear [19], necessitating higher resolution techniques to completely understand fiber structure. Confocal and multiphoton microscopy can directly detect collagen fibrils; however, methods to analyze these images have shown varying levels of success. Calculating the maximum local gradient and direct fiber tracing have not shown a connection between microstructure and biomechanics [11, 20].
Multiphoton microscopy and image correlation spectroscopy (ICS) have proven useful to link tissue microstructure and bulk modulus [21-23]. In particular, second harmonic generation (SHG) imaging of collagen fiber structure has distinct advantages over confocal reflectance, given the deeper penetration and better resolution of fibers oriented perpendicular to the imaging plane [24]. ICS uses an autocorrelation kernel to analyze structural features of fluorescent images [25], and is a user-independent technique to analyze particle number, size, and orientation in noisy fluorescent images. ICS can also be generalized to describe structure and alignment at different length scales, a technique we will term as generalized ICS (GICS). We hypothesized that GICS analysis of SHG at different characteristic length scales would capture the complex interaction between structural proteins and cells, and could thus predict prestress in cellularized collagen gels.
Methods
Formation of Prestressed Collagen Gels
Prestressed collagen gels (n=6) were produced by allowing fibroblast-embedded collagen gels to contract radially around a rigid post. To form the gels, the following components were mixed on ice: 10x DMEM (Invitrogen), collagen to create a final concentration of 2 mg/ml (Rat tail tendon Type 1, BD Biosciences, Bedford MA), sterile double-deionized water, NaOH to adjust the final pH to 7.0-7.2, and normal human lung fibroblasts (NHLF, P5 or P6, Lonza, Walkersville) at a concentration of 1 million cells/ml. Two milliliters of the collagen-fibroblast gel was poured into annular molds constructed of polydimethyl siloxane (PDMS) with an outer diameter of 3.5 cm and a central post with a diameter of 7 mm. Gels were then transferred to 37 oC incubators and allowed to polymerize overnight. The following day, 2 mL of media (FGM, Lonza) was gently added over the gel and replaced every 2-3 days, for a total of 10 days.
Multiphoton Microscopy
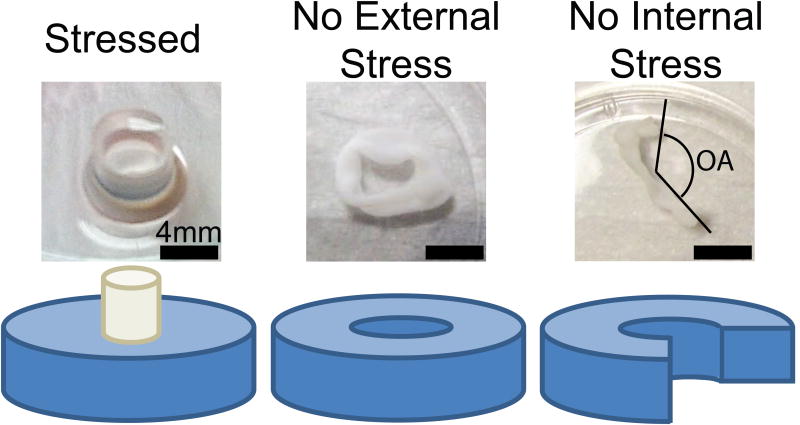
Ten days after formation of the gels, the collagen matrix was imaged with multiphoton microscopy (MPM) to capture the second harmonic generated (SHG) signal from collagen as described previously [22]. Each gel was imaged at four locations: the inner and outer rim of the gel in two different locations around the central post. Imaging was performed at these locations in the “stressed” state (Fig. 1), then the central mandrel was gently removed to generate the “no external stress” state (Fig. 1), and imaging repeated at the same locations. Finally, gels were floated in media and cut at a single radial position with a scalpel to remove any prestress (“no internal stress” state-Fig. 1). Photographs of the macroscopic configuration were taken immediately after cutting, and after 30 min of relaxation. Opening angle (Fig. 1) was measured manually (ImageJ, National Institutes of Health, Bethesda, MD) by a blinded observer as a macroscopic index of prestress [1]. SHG imaging was then repeated as described above. Gels were then cut radially again to confirm no further change in configuration.
Figure 1.
The three stress states investigated in this study. Stressed gels were made by allowing the cellularized collagen gels to compact around a central rigid mandrel. In the no external stress state, the mandrel was removed, allowing the gel to float freely. In this state, any stress in the gel was due to prestress. In the no internal stress state, the gel was transected radially releasing all internal stress. The opening angle was measured as indicated by the dashed black lines.
Generalized image correlation spectroscopy (GICS)
Image correlation spectroscopy uses an autocorrelation kernel, which measures concordance of pixel intensity depending on the distance between those pixels [25]. In order to analyze fiber number and structure at different length scales, the autocorrelation function (ACF) was calculated. Traditional ICS fits the center region of the ACF with an isotropic 2D Gaussian function, and uses the amplitude as an index of the number of bright regions [26]. GICS, in contrast, fits a 2D Gaussian function (with different major and minor axis standard deviations [25]) to annular regions of the ACF. By changing the region of the ACF fit with this function, number and alignment of elements at different scales can be analyzed. The standard deviation in each direction (σmaj and σmin) gives a characteristic length in two directions that relates to the structure of the elements in the image. Furthermore, the ratio of the major and minor axis standard deviation (skew, σmaj/min) provides an index of alignment [25].
As previously noted, images comprised of aligned thin fibers with length L have an ACF with a major standard deviation approximately equal to L/3, which falls to zero at the length L from the center [25]. Therefore, the region of the autocorrelation from the center to L will contain almost all the information for structures with this length. Thus, by choosing different regions of the autocorrelation for curve fitting, different sized elements can be emphasized. In other words, if fibers (or structures) of different lengths are mixed, GICS can separate the structures at different scales by selecting the appropriate portion of the ACF.
The analysis scales used in this experiment to analyze cellularized collagen gels were chosen empirically to correspond to the scale of collagen fibrils (1-4 pixels/0.2-0.8 μm), fibers (4-16 pixels, 1-4 μm), and cells (16-64 pixels 4-16 μm) [27]. For each scale, the amplitude, A, and skew, σmaj/min[25] were calculated. Non-convergent fits were omitted if the residual was greater than 5% of the function value.
Image Processing Simulations
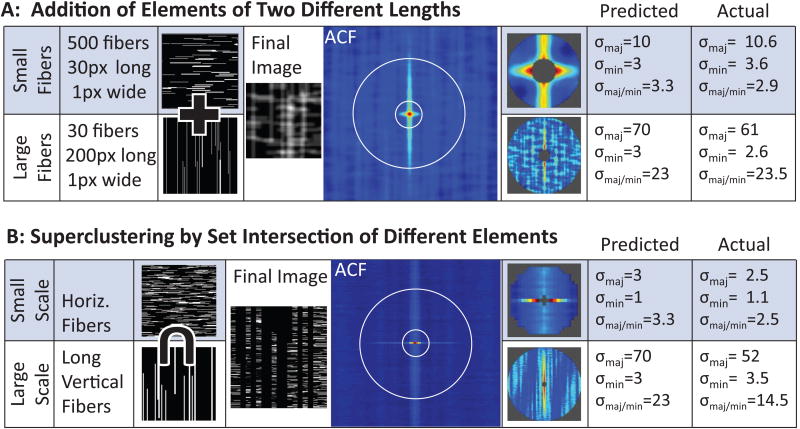
Fig. 2 shows GICS analysis of simulated images demonstrating the ability of this technique to separate different size elements, as well as higher order structures formed by clustering of smaller structures (superclustering). In the first example, the image is comprised of fibrous elements of two different lengths, oriented perpendicular to each other (Fig. 2A). Short, horizontal fibers were summed with long vertical fibers then convolved with a Gaussian point spread function to simulate the laser beam waist. The autocorrelation function (ACF) close to the center is dominated by the short horizontal fibers, whereas the vertical fibers dominate if a larger radius of analysis is chosen. By fitting an arbitrary 2D Gaussian function to these two regions separately [25], the two fiber types can be analyzed separately (note the concordance between predicted and actual parameters).
Figure 2.
GICS analysis of simulated images demonstrates the ability to characterize structures and organization of structures at different spatial scales. Part A demonstrates separation of small horizontal fibers with long vertical fibers. Images containing these two fiber types are summed, and convolved with a Gaussian point spread function to mimic laser imaging to create the final image. The ACF is then calculated, and two different central regions are fit to arbitrary Gaussian functions to calculate the standard deviation of the major and minor axis (skew or σmaj/min). Predicted values for standard deviation of the major and minor axis are calculated using theory previously presented [25]. Part B demonstrates separation of structural features at different scales. Large vertical fibers are used as a mask for a field of short horizontal fibers, such that the image is composed of short horizontal fibers superclustered into larger vertical structures. The ACF demonstrates separation of these two spatial regimes.
The second example utilizes an image whose features also depend on spatial scale (Fig. 2B). However, in this case the simulated image was created such that at a small spatial scale the image is dominated by short horizontal fibers, but at a larger spatial scale the short fibers are organized (or clustered) to create long, vertical structures. The ACF captures these features, again by fitting an arbitrary 2D Gaussian function to either a small or large region.
To determine the predicted alignment of isotropic (i.e. unaligned fibers), Monte Carlo simulations were performed. Ten thousand images containing a random number of random length fibers were created and analyzed. In 95% of the images, σmaj/min was less than 1.2. From this we concluded that a σmaj/min of less 1.2 was indicative of an isotropic image.
Statistical Analysis
Image analysis parameters (A and σmaj/min) were compared across gel prestress (prestress: opening angle >10 degrees; no prestress: opening angle <10 degrees), stress states (stressed, no external stress, and no internal stress), and scale (fibril, fiber, and cell scale) with three-way ANOVA (P<0.05). Opening angle was then correlated with the image characteristics and state with multiple linear regression.
Results
Formation of Prestressed Gels
Over the course of 10 days, gels contracted into thin rings surrounding the central post (Fig. 3). The opening angles varied from 10° to 160° with a mean (±SD) of 65 ± 50 °. Variable fiber alignment with radial position in the gel was qualitatively observed in SHG images (Fig. 3). In the stressed configuration, fibers closest to the inner mandrel showed strong alignment parallel to the surface of the tissue.
Figure 3.
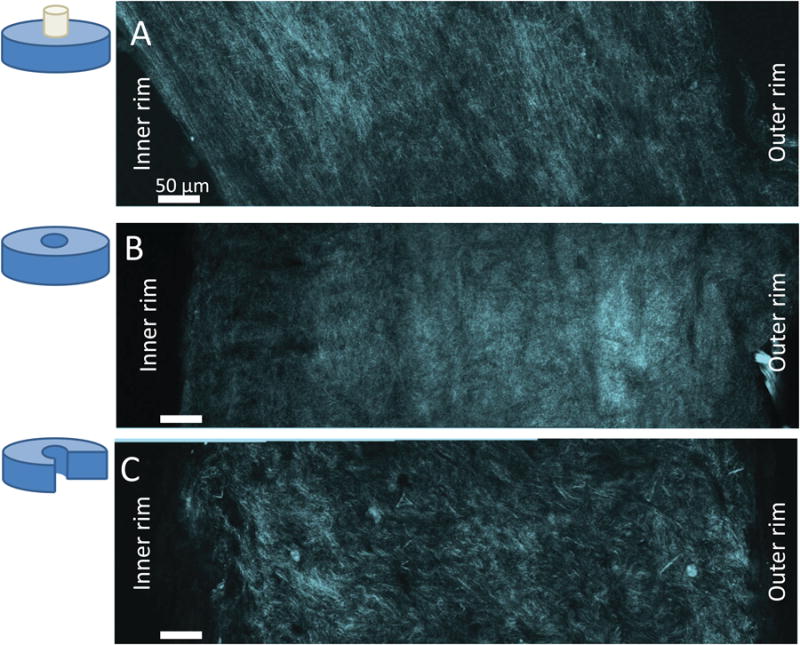
SHG images of a radius of the collagen gel in the three stress states. Collagen fibers (cyan) and higher order structures (yellow dashed lines) are visible. Qualitative fiber alignment is visible in the stressed, and the no external stress cases.
GICS Detects Fiber Alignment
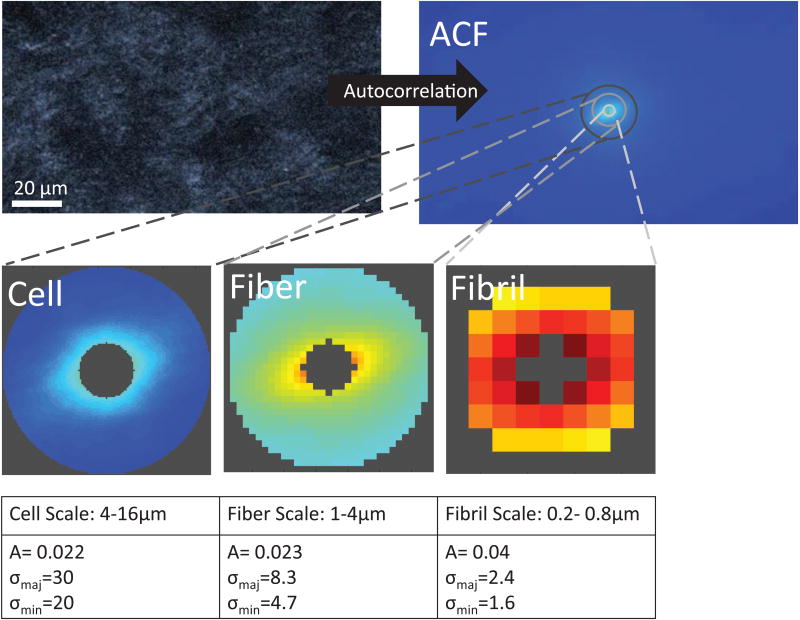
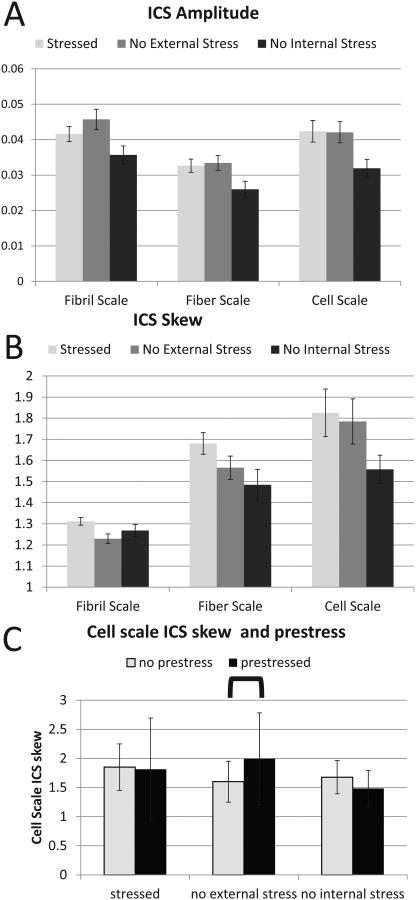
Fig. 4 shows GICS analysis of a sample SHG image of a cellularized collagen gel. Both ICS amplitude and skew varied with the different stress conditions studied. ICS amplitude varied across load state, opening angle, and analysis scale (p<10−4, p<10−4 p<10−4), with lower amplitude, and thus maximum particle number, in the fiber scale (Figure 5A).
Figure 4.
Example GICS analysis of a cellularized collagen gel. The autocorrelation function is calculated, and used to calculate the amplitude (A) and standard deviation of the major (σmaj) and minor (σmin) axis of the 2D Gaussian fit of central regions at different spatial scales corresponding to collagen fibrils, collagen fibers, and cells.
Figure 5.
GICS analysis of prestressed collagen gels. Part A describes the ICS amplitude in the three spatial scales and three stress states. Lower ICS amplitude was seen in all three stress states at the fiber scale. Part B describes ICS skew in the same conditions. Low fiber skew was seen at the fibril scale, whereas decreasing ICS skew was seen in the three stress states at the fiber and cell scales. Part C shows a comparison of cell scale ICS skew between gels where high and low prestress were seen.
Evidence of structural alignment (i.e. ICS fiber ratio>1.2) was observed at both fiber and cell scale in all three stress conditions. ICS skew was significantly different across stress state and scale (p<10−4, p<0.05, p<10−4, respectively), with the highest alignment occurring in the prestressed, externally loaded gels and the cell scale (Fig. 5B). Post-hoc tests revealed significant differences at the cell scale in fiber alignment between gels with high levels of prestress and low levels of prestress in the unloaded configuration (Fig. 5C), while no significant difference was seen at either the fibril or fiber scale between gels with and without prestress. Furthermore, linear regression revealed significant correlations between ICS skew and opening angle at both the fiber and cell scale, respectively (slope 40° , p<0.0001) and between cell scale GICS skew and opening angle (slope 45° , p<0.02).
Discussion
We have presented a simple in vitro tissue culture model of prestress, and demonstrated that GICS of collagen SHG can non-invasively characterize fiber density and alignment at different length scales. Furthermore, the quantitative indices of GICS, in particular the ratio of the standard deviations of the 2D Gaussian fit of the ACF (σmaj/min), correlate with the opening angle, a macroscopic index of prestress, and thus GICS analysis of collagen SHG may be a useful tool to predict prestress.
While previous work has noted creation of prestress in collagen gels [28], this work simultaneously assesses the level of prestress, and also attempts to predict prestress from ECM microstructure using non-invasive and non-destructive methods. In this study, increased fiber alignment translated to increased tissue strain, similar to previous work which applied external strains and assessed tissue microstructure [14]. Unlike previous work, these gels contained internal stresses (created by prestress) as opposed to externally applied loads. Given that many tissues in vivo display high levels of prestress [1, 29] and ECM prestress can affect cellular function and ECM remodeling [29, 30], the ability to predict prestress non-invasively and non-destructively could allow for detection of the mechanical basis of tissue disease or improved tissue engineering.
A major advance of this work is development of a user-independent and quantitative method for simultaneous study of collagen and cell structures over multiple length scales. The extension and analysis of ICS over a different spatial scales we have coined generalized ICS, or GICS. Furthermore, GICS directly analyzes concordance between pixels, an advantage for ease of interpretation over Fourier spectroscopic methods, which analyze frequency composition [31, 32].
Differences in ICS amplitude and skew were seen between prestressed and un-prestressed gels, between loading configuration, and between analysis scale. ICS amplitude was the lowest for the fiber length scale, which is expected, as ICS amplitude is inversely proportional to number of bright regions [25, 26]. In other words, the largest number of structures visible from SHG is present in the fiber length scale, resulting in the lowest ICS amplitude. Little information was extracted at the fibril scale: the ICS skew was very low, consistent with little information regarding alignment. Bright objects in this length scale may be noise, or fibrils too small to carry load effectively [27]. The cell scale, on the other hand, showed the highest ICS skew and was a significant predictor of prestress. This length scale may encompass both cellular alignment and superclusters of fibers [27].
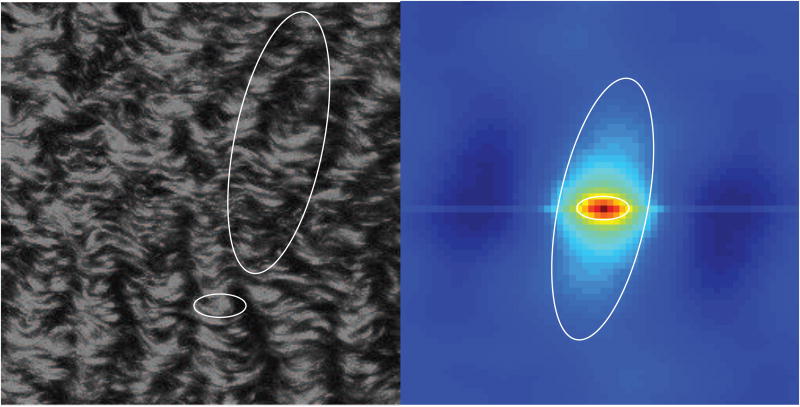
Previous techniques to assess collagen structure have investigated fiber structure at a single characteristic length scale [11]. The GICS technique is particularly interesting as ECM in vivo can display very different structure at different scales (Figure 6). Likewise, even tissues that display self-similarity (i.e. similar structures at different characteristic scales, or fractal structure) can lose these characteristics in damage and disease [31]. Furthermore, some evidence suggests that cells can mechanically sense and respond to only a narrow range of structural features [33, 34]. Hence, analysis methods that do not account for multiple structural scales within the ECM microstructure may miss important mechanical cues that inform biological phenotype.
Figure 6.
SHG image of collagen structure in decellularized porcine cardiac extracellular matrix (from [36]). Note the different structures seen at different scales. At small scales, horizontal clusters of collagen fibers are seen. At large scales, crimping is seen, resulting in long vertical structures, or superclusters. The ACF captures these different structures: at small scales, strong horizontal structures are seen, at longer scales, the superclusters dominate.
Prestressed collagen gels were created via cell-mediated fiber contraction around a mandrel. A wide range of opening angles was observed in this model, despite similar culture conditions. Fibroblasts are known to generate more tension while a gel is anchored [27]; we noted that the gels broke free from the outer culture well mold at different time points ranging from 1 day to 8 days which may have resulted in the wide range of final prestress [27]. Furthermore, minor variations in the original gel configuration, such as uneven distribution of cells and matrix, may have affected contraction and thus the final level of prestress. Nonetheless, the range of opening angles facilitated quantitative comparison of opening angle with fiber alignment from GICS in this study.
Finally, the simplicity of the model used in this study is attractive in that only one cell type and one extracellular matrix protein are present, thus facilitating interpretation of the GICS methodology. However, caution should be exercised when extrapolating to more physiologic systems (multiple structural proteins [35], numerous cell types and increased cell density) due to additional light scattering, and more complex extracellular matrix protein content and arrangement.
Conclusions
Prestressed collagen gels were produced by fibroblast-mediated cell contraction around a mandrel. Generalized ICS (GICS) was used to analyze the collagen microstructure in these gels using the SHG signal from multiphoton microscopy. The endpoints of GICS, amplitude and skew, were dependent on the stress state of the collagen gel. Furthermore, skew (i.e., fiber or structure orientation) at the fiber and cell spatial scale correlated with the macroscopic observation of opening angle, and thus the prestress of the tissue construct. We conclude that GICS of collagen SHG describes fiber alignment and number at multiple structural scales in a non-destructive, non-invasive, noise insensitive, and user-independent manner. Thus, GICS may be a useful tool in the assessment of tissue structure and function, particularly in the cardiovascular system in which prestress plays a prominent role in health and disease.
Acknowledgments
This work was supported by NIH P41EB015890 (Laser Microbeam and Medical Program: LAMMP) and NIH R01HL067954, and the NSF Graduate Research Fellowship Program, ARCS Inc Fellowship and UCI's Summer Undergraduate Research Fellowship Program.
Footnotes
Publisher's Disclaimer: This is a PDF file of an unedited manuscript that has been accepted for publication. As a service to our customers we are providing this early version of the manuscript. The manuscript will undergo copyediting, typesetting, and review of the resulting proof before it is published in its final citable form. Please note that during the production process errors may be discovered which could affect the content, and all legal disclaimers that apply to the journal pertain.
References
- 1.Fung YC. A First Course in Continuum Mechanics. Englewood Cliffs: Prentice Hall; 1994. [Google Scholar]
- 2.Destrade M, Liu Y, Murphy JG, Kassab GS. Uniform transmural strain in pre-stressed arteries occurs at physiological pressure. J Theor Biol. 2012;303:93–7. doi: 10.1016/j.jtbi.2012.03.010. [DOI] [PMC free article] [PubMed] [Google Scholar]
- 3.Taylor CA, Humphrey JD. Open Problems in Computational Vascular Biomechanics: Hemodynamics and Arterial Wall Mechanics. Comput Methods Appl Mech Eng. 2009;198:3514–23. doi: 10.1016/j.cma.2009.02.004. [DOI] [PMC free article] [PubMed] [Google Scholar]
- 4.Liu SQ, Fung YC. Relationship between hypertension, hypertrophy, and opening angle of zero-stress state of arteries following aortic constriction. J Biomech Eng. 1989;111:325–35. doi: 10.1115/1.3168386. [DOI] [PubMed] [Google Scholar]
- 5.Han HC, Ku DN. Contractile responses in arteries subjected to hypertensive pressure in seven-day organ culture. Ann Biomed Eng. 2001;29:467–75. doi: 10.1114/1.1376391. [DOI] [PubMed] [Google Scholar]
- 6.Hong MK, Vossoughi J, Mintz GS, Kauffman RD, Hoyt RF, Jr, Cornhill JF, et al. Altered compliance and residual strain precede angiographically detectable early atherosclerosis in low-density lipoprotein receptor deficiency. Arterioscler Thromb Vasc Biol. 1997;17:2209–17. doi: 10.1161/01.atv.17.10.2209. [DOI] [PubMed] [Google Scholar]
- 7.Ohayon J, Dubreuil O, Tracqui P, Le Floc'h S, Rioufol G, Chalabreysse L, et al. Influence of residual stress/strain on the biomechanical stability of vulnerable coronary plaques: potential impact for evaluating the risk of plaque rupture. Am J Physiol Heart Circ Physiol. 2007;293:H1987–96. doi: 10.1152/ajpheart.00018.2007. [DOI] [PubMed] [Google Scholar]
- 8.Pedersen JA, Swartz MA. Mechanobiology in the third dimension. Ann Biomed Eng. 2005;33:1469–90. doi: 10.1007/s10439-005-8159-4. [DOI] [PubMed] [Google Scholar]
- 9.Gilbert TW, Sacks MS, Grashow JS, Woo SL, Badylak SF, Chancellor MB. Fiber kinematics of small intestinal submucosa under biaxial and uniaxial stretch. J Biomech Eng. 2006;128:890–8. doi: 10.1115/1.2354200. [DOI] [PubMed] [Google Scholar]
- 10.Jhun CS, Evans MC, Barocas VH, Tranquillo RT. Planar biaxial mechanical behavior of bioartificial tissues possessing prescribed fiber alignment. J Biomech Eng. 2009;131:081006. doi: 10.1115/1.3148194. [DOI] [PMC free article] [PubMed] [Google Scholar]
- 11.Thomopoulos S, Fomovsky GM, Chandran PL, Holmes JW. Collagen fiber alignment does not explain mechanical anisotropy in fibroblast populated collagen gels. J Biomech Eng. 2007;129:642–50. doi: 10.1115/1.2768104. [DOI] [PubMed] [Google Scholar]
- 12.Tower TT, Neidert MR, Tranquillo RT. Fiber alignment imaging during mechanical testing of soft tissues. Ann Biomed Eng. 2002;30:1221–33. doi: 10.1114/1.1527047. [DOI] [PubMed] [Google Scholar]
- 13.Tower TT, Tranquillo RT. Alignment maps of tissues: I. Microscopic elliptical polarimetry. Biophys J. 2001;81:2954–63. doi: 10.1016/S0006-3495(01)75935-8. [DOI] [PMC free article] [PubMed] [Google Scholar]
- 14.Vader D, Kabla A, Weitz D, Mahadevan L. Strain-induced alignment in collagen gels. PLoS One. 2009;4:e5902. doi: 10.1371/journal.pone.0005902. [DOI] [PMC free article] [PubMed] [Google Scholar]
- 15.Quinn KP, Winkelstein BA. Full field strain measurements of collagenous tissue by tracking fiber alignment through vector correlation. J Biomech. 43:2637–40. doi: 10.1016/j.jbiomech.2010.05.008. [DOI] [PubMed] [Google Scholar]
- 16.Tower TT, Tranquillo RT. Alignment maps of tissues: II. Fast harmonic analysis for imaging. Biophys J. 2001;81:2964–71. doi: 10.1016/S0006-3495(01)75936-X. [DOI] [PMC free article] [PubMed] [Google Scholar]
- 17.Wang JH, Jia F, Gilbert TW, Woo SL. Cell orientation determines the alignment of cell-produced collagenous matrix. J Biomech. 2003;36:97–102. doi: 10.1016/s0021-9290(02)00233-6. [DOI] [PubMed] [Google Scholar]
- 18.Raghupathy R, Witzenburg C, Lake SP, Sander EA, Barocas VH. Identification of regional mechanical anisotropy in soft tissue analogs. J Biomech Eng. 2011;133:091006. doi: 10.1115/1.4005170. [DOI] [PMC free article] [PubMed] [Google Scholar]
- 19.Rieppo J, Hallikainen J, Jurvelin JS, Kiviranta I, Helminen HJ, Hyttinen MM. Practical considerations in the use of polarized light microscopy in the analysis of the collagen network in articular cartilage. Microsc Res Tech. 2008;71:279–87. doi: 10.1002/jemt.20551. [DOI] [PubMed] [Google Scholar]
- 20.Lai VK, Frey CR, Kerandi AM, Lake SP, Tranquillo RT, Barocas VH. Microstructural and mechanical differences between digested collagen-fibrin co-gels and pure collagen and fibrin gels. Acta Biomater. 8:4031–42. doi: 10.1016/j.actbio.2012.07.010. [DOI] [PMC free article] [PubMed] [Google Scholar]
- 21.Raub CB, Putnam AJ, Tromberg BJ, George SC. Predicting bulk mechanical properties of cellularized collagen gels using multiphoton microscopy. Acta Biomater. 6:4657–65. doi: 10.1016/j.actbio.2010.07.004. [DOI] [PMC free article] [PubMed] [Google Scholar]
- 22.Raub CB, Unruh J, Suresh V, Krasieva T, Lindmo T, Gratton E, et al. Image correlation spectroscopy of multiphoton images correlates with collagen mechanical properties. Biophys J. 2008;94:2361–73. doi: 10.1529/biophysj.107.120006. [DOI] [PMC free article] [PubMed] [Google Scholar]
- 23.Raub CB, Suresh V, Krasieva T, Lyubovitsky J, Mih JD, Putnam AJ, et al. Noninvasive assessment of collagen gel microstructure and mechanics using multiphoton microscopy. Biophys J. 2007;92:2212–22. doi: 10.1529/biophysj.106.097998. [DOI] [PMC free article] [PubMed] [Google Scholar]
- 24.Zipfel WR, Williams RM, Webb WW. Nonlinear magic: multiphoton microscopy in the biosciences. Nat Biotech. 2003;21:1369–77. doi: 10.1038/nbt899. [DOI] [PubMed] [Google Scholar]
- 25.Robertson C, George S. Theory and practical recommendations for autocorrelation-based image correlation spectroscopy. J Biomed Opt. 2012;17 doi: 10.1117/1.JBO.17.8.080801. [DOI] [PMC free article] [PubMed] [Google Scholar]
- 26.Petersen NO, Hoddelius PL, Wiseman PW, Seger O, Magnusson KE. Quantitation of membrane receptor distributions by image correlation spectroscopy: concept and application. Biophys J. 1993;65:1135–46. doi: 10.1016/S0006-3495(93)81173-1. [DOI] [PMC free article] [PubMed] [Google Scholar]
- 27.Fratzl P. Collagen: Structure and Mechanics. Springer Science+Business Media, LLC; 2008. [Google Scholar]
- 28.Isenberg BC, Williams C, Tranquillo RT. Small-diameter artificial arteries engineered in vitro. Circ Res. 2006;98:25–35. doi: 10.1161/01.RES.0000196867.12470.84. [DOI] [PubMed] [Google Scholar]
- 29.Tomasek JJ, Gabbiani G, Hinz B, Chaponnier C, Brown RA. Myofibroblasts and mechano-regulation of connective tissue remodelling. Nat Rev Mol Cell Bio. 2002;3:349–63. doi: 10.1038/nrm809. [DOI] [PubMed] [Google Scholar]
- 30.Discher DE, Janmey P, Wang YL. Tissue cells feel and respond to the stiffness of their substrate. Science. 2005;310:1139–43. doi: 10.1126/science.1116995. [DOI] [PubMed] [Google Scholar]
- 31.Fung DT, Sereysky JB, Basta-Pljakic J, Laudier DM, Huq R, Jepsen KJ, et al. Second harmonic generation imaging and Fourier transform spectral analysis reveal damage in fatigue-loaded tendons. Ann Biomed Eng. 2010;38:1741–51. doi: 10.1007/s10439-010-9976-7. [DOI] [PMC free article] [PubMed] [Google Scholar]
- 32.Alavi SH, Ruiz V, Krasieva T, Botvinick EL, Kheradvar A. Characterizing the Collagen Fiber Orientation in Pericardial Leaflets Under Mechanical Loading Conditions. Ann Biomed Eng. 2012;41(3):547–61. doi: 10.1007/s10439-012-0696-z. [DOI] [PMC free article] [PubMed] [Google Scholar]
- 33.Sen S, Engler AJ, Discher DE. Matrix strains induced by cells: Computing how far cells can feel. Cell Mol Bioeng. 2009;2:39–48. doi: 10.1007/s12195-009-0052-z. [DOI] [PMC free article] [PubMed] [Google Scholar]
- 34.Buxboim A, Ivanovska IL, Discher DE. Matrix elasticity, cytoskeletal forces and physics of the nucleus: how deeply do cells ‘feel’ outside and in? Journal of cell science. 2010;123:297–308. doi: 10.1242/jcs.041186. [DOI] [PMC free article] [PubMed] [Google Scholar]
- 35.Cardamone L, Valentin A, Eberth JF, Humphrey JD. Origin of axial prestretch and residual stress in arteries. Biomech Model Mechanobiol. 2009;8:431–46. doi: 10.1007/s10237-008-0146-x. [DOI] [PMC free article] [PubMed] [Google Scholar]
- 36.Merna NJ, Robertson C, La A, George S. Optical imaging predicts mechanical properties during decellularization of cardiac tissue. Tissue Eng C. 2013 doi: 10.1089/ten.tec.2012.0720. Epub. [DOI] [PMC free article] [PubMed] [Google Scholar]


