Abstract
Background
Quantification of variations of human gene expression is complicated by the small differences between different alleles. Recent work has shown that variations do exist in the relative allelic expression levels in certain genes of heterozygous individuals. Herein, we describe the application of an immobilized polymerase chain reaction technique as an alternative approach to measure relative allelic differential expression.
Results
Herein, we report a novel assay, based on immobilized polymerase colonies, that accurately quantifies the relative expression levels of two alleles in a given sample. Mechanistically, this was accomplished by PCR amplifying a gene in a cDNA library in a thin polyacrylamide gel. By immobilizing the PCR, it is ensured that each transcript gives rise to only a single immobilized PCR colony, or "polony". Once polony amplified, the two alleles of the gene were differentially labeled by performing in situ sequencing with fluorescently labeled nucleotides. For these sets of experiments, silent single nucleotide polymorphisms (SNPs) were used to discriminate the two alleles. Finally, a simple count was then performed on the differentially labeled polonies in order to determine the relative expression levels of the two alleles. To validate this technique, the relative expression levels of PKD2 in a family of heterozygous patients bearing the 4208G/A SNP were examined and compared to the literature.
Conclusions
We were able to reproduce the results of allelic variation in gene expression using an accurate technology known as polymerase colonies. Therefore, we have demonstrated the utility of this method in human gene expression analysis.
Background
The advent of the PCR played an important role in revolutionizing research in the field of molecular biology. A recent adaptation of this technology, known as polymerase colonies, or "polonies", holds tremendous promise as well [1-5]. Polony technology is a form of PCR in which the reaction is immobilized in a thin polyacrylamide gel attached to a microscope slide. As the PCR proceeds, the PCR products diffuse radially within the gel from its immobilized template (e.g., cDNA or genomic DNA), giving rise to a circular PCR or polomerase colony [1]. When the gel is stained and scanned with a microarray scanner, the polymerase colony resembles a bacterial colony on an agar plate, hence its name. In this paper polony technology is adapted to quantify the variations in allelic expression levels for a heterozygous gene.
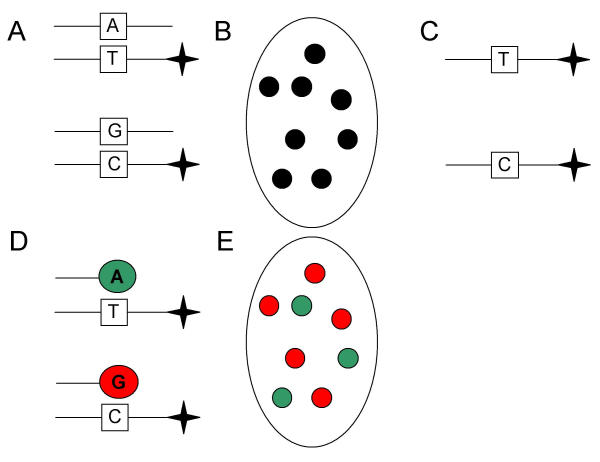
Recent work has shown that variations exist in the relative allelic expression levels in certain genes of heterozygous individuals [6]. Herein, we describe the application of polony technology as an alternative approach to measure relative allelic differential expression. Initially, the two alleles for a particular gene were polony amplified with primers which flank the SNP (Figure 1A), giving rise to one polony per transcript. The polonies were observed after the gel was stained with SyBr Green I and scanned with a microarray scanner (Figure 1B). An additional step was required to discriminate the two alleles which involved: 1) making the polony single stranded by formamide denaturation and electrophoresis (Figure 1C); 2) hybridization of a sequencing primer with the 3' end preceding the SNP; 3) a single-base extension with fluorescent nucleotides to differentially label the two alleles (Figure 1D); and 4) scanning the gel to determine allelic expression levels (Figure 1E). This approach was able to successfully identify variations in the 4208A/G alleles of PKD2 in heterozygous patients as previous described [6].
Figure 1.
Determining relative allelic expression using polony technology. (A) Initially, the gene of interest is polony amplified from cDNA. The primers are designed to amplify the region of the gene bearing a silent SNP, which is used to discriminate the two alleles. In this illustration, one allele bears an A-T pairing at a particular position whereas the other allele has a G-C pairing instead. Note: one of primers has a 5' acrydite modification (star), which is eventually required for distinguishing these two alleles. (B) Following polony amplification, the gel is stained with SybrGreenI and scanned with a microarray scanner in order to ensure that the polony amplification worked properly. Each black dot represents the polony amplification of one copy of the desired first-strand cDNA template. (C) Prior to hybridization of sequencing primer, the polony is made single stranded by denaturing the double stranded in formamide followed by the removal of non-acrydited strand using electrophoresis. (D) A sequencing primer is hybridized to the single stranded polony, a single base extension is performed with Cy5-dATP and then the gel is scanned. To label the other allele, the process of denaturation, hybridation, extension, and scanning is repeated, but the extension is performed with Cy5-dGTP instead. (E) To determine the relative expression levels of the two alleles, a composite image from the Cy5-dATP and Cy5-dGTP extensions is first generated and then the number of polonies (transcripts) for each of the two alleles is counted. In this particular example, the "G-C" SNP represents 62.5% of the population (i.e., 5 out of 8 polonies). Figure adapted from Yan et al [6].
Results
In the work by Yan et al. [6] the allelic expression levels of PKD2 in heterozygous individuals (4208A/G) was investigated in a CEPH family of eight individuals. Of the eight individuals, it was determined that three individuals exhibited a greater than 20% difference in the relative expression levels of 4208A and 4208G PKD2 [6,7].
To determine if polony technology could be used to accurately measure the relative allelic expression levels, the relative expression levels of 4208A and 4208G PKD in the same eight patients was examined using polonies in a blind assay and the subsequent results were compared to the original study [6]. Initially, cDNA for each of the eight patients was obtained as previously described [6] prior to polony amplification in separate gels. The cDNA for each patient was blindly analyzed in quadruplicate as described in the materials and methods. For each patient the respective 4208A and 4208G polony count for all four of the quadruplicate gels was determined as well as the relative expression levels of the 4208A and 4208G alleles (Table 1).
Table 1.
The relative expression of 4208A, 4208G PKD2 alleles using polony technology.
| Ratio of 4208A/4208G PKD2 alleles in cDNA | |||||
| # of polonies | G/A ratio | ||||
| Individual | 4208A | 4208G | This Study | P-value | Yan et al. |
| 49 | 186 | 236 | 1.27 | 0.0149 | 1.2 |
| 50 | 152 | 267 | 1.76 | 1.94 × 10⁻⁸ | 1.85 |
| 50-3 | 256 | 364 | 1.42 | 1.44 × 10⁻⁵ | 1.72 |
| 50-4 | 112 | 113 | 1.01 | 0.947 | 0.95 |
| 50-5 | 385 | 571 | 1.48 | 1.80 × 10⁻⁹ | 1.81 |
| 50-6 | 337 | 246 | 0.73 | 1.64 × 10⁻⁴ | 0.82 |
| 50-7 | 222 | 197 | 0.89 | 0.222 | 0.95 |
| 50-12 | 96 | 96 | 1.00 | 1.000 | 1.05 |
For all patients, the polony count for both alleles represents the total number of polonies for the respective species observed in quadruplicate gels following polony analysis of cDNA. The P-value indicates the probability that the alleles are expressed at an equal ratio given the data. The P-value indicates that significance of the result.
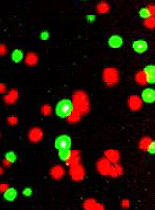
Polony quantification of relative expression levels was determined to be sensitive enough to detect variation in relative levels of 4208A and 4208G across patients. For example, a polony gel for patient 50 clearly shows elevated expression of PKD2 transcripts bearing the 4208G SNP (Figure 2, red polonies) compared to the 4208A SNP (Figure 2, green polonies). Compared to the previously published data of Yan et al., polony quantification was able to detect the elevated 4208G to 4208A expression levels in the same three patients, namely patients 50, 50-3 and 50-5. Furthermore, similar relative allelic expression levels were detected in all patients using both methods, and the rank order of relative expression levels across patients also remained largely unaffected by the choice of method. It should be noted that analysis of 4208A/G levels in genomic DNA from four of the eight patients was close to the expected 1:1 4208A to 4208G levels (Table 2).
Figure 2.

Representative polony gel for patient 50 following extensions with fluorescently labeled dATP (green) and dGTP (red). This is a composite image generated from the independent extensions with either Cy5-dATP or Cy5-dGTP as described in figure 1. The colors used in the image are artificial.
Table 2.
The relative levels of 4208A, 4208G PKD2 alleles in genomic DNA using polony technology.
| Ratio of 4208A/4208G alleles in genomic DNA | ||||
| # of polonies | ||||
| Individual | 4208A | 4208G | G/A ratio | P-value |
| 49 | 255 | 248 | 0.97 | 0.755 |
| 50 | 350 | 349 | 1.00 | 0.970 |
| 50-3 | 211 | 247 | 1.17 | 0.093 |
| 50-4 | 600 | 615 | 1.03 | 0.667 |
For all patients, the polony count for both alleles represents the total number of polonies for the respective species observed in triplicate gels following polony analysis of genomic DNA. All ratios are not significantly different than 1.00.
Discussion
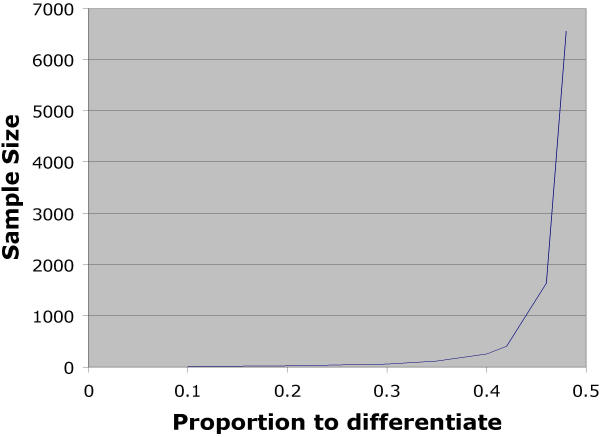
There are at least two major advantages to the polony approach for measuring allelic variation in gene expression. First, the measurements are digital and hence more accurate than the 'analog' approaches for quantifying allelic variation (see Figure 3). In addition, the polony approach for measuring allelic variation provides an absolute measurement of the relative expression of the two alleles, whereas other approaches are normalized to the population average which is assumed to be 1:1.
Figure 3.
Sample size required to differentiate various proportions of allelic expression. The sample size is shown that is required to differentiate various levels of allelic variation of gene expression. We have required a power of 0.90 for these data.
Conclusions
We have shown that immobilized PCR, or polony technology, can be successfully used to detect variations in relative allelic expression of heterozygous genes. We believe that this is the next evolutionary step in analyzing allelic variation, and trying to relate allelic variation to disease, due to the "digital" nature of the data generated using this technique [8].
Methods
Polony gels
Polony gels were cast on Teflon coated microscope slides for detection of allelic variation. The Teflon coated, 24.4 × 16.7 mm oval slides (Grace Bio-Labs, Bend, OR) were treated with Bind Silane (Amersham, Piscataway, NJ) in accordance with the manufacture's instructions. The slides were stored in a desiccator. To cast the polyacrylamide gels used for the immobilized PCR reaction, a master mix was first made for 12 polony gels (131.0 μL of filter-sterilized doubly deionized water, 25.5 μL of 10X JumpStart Taq Polymerase Reaction Buffer (Sigma, St. Louis, MO), 2.55 μL of dNTP (20 mM each), 1.5 μL of 30% BSA (Sigma), 2.55 μL 10% Tween 20, and 56.16 μL of degassed, filter-sterilized acrylamide). To determine the relative expression levels of the two PDK2 alleles from numerous heterozygous patients, 20 μl of master mix was combined with 1 μl of cDNA (The cDNA for allelic variation analysis was prepared as described [6]) diluted to the appropriate level to obtain distinguishable non-overlapping polonies as well as 0.23 μl of 50 μM forward (5'-CAGCACTTTGGGAGGCCGAAC-3') and reverse primer (5'-CCCCATAAATTTGGGTGAGACCCTC-3') designed to polony amplify the region of the PKD2 gene bearing the silent SNP, 4208A/G [6].
The reverse primer in the gel was modified with a 5' acrydite to covalently link one strand to the gel. Immediately prior to casting the polony gel, 1.38 μl of JumpStart Taq Polymerase (Sigma), 0.34 μl of 5% APS, and 0.34 μl of TEMED were added to the master mix/primer/DNA solution. The sample was mixed prior to pipeting 20 μl of the mixture into the void space created by placing a coverslip onto a Teflon-masked, bind-silane treated slide. The polyacrylamide gel polymerized for 10 minutes, and then a hybrid well cover (Grace Bio-labs) was placed on top of the gel and light mineral was pipeted into the hybrid well chamber. The slide was placed in a hybridization tower and PCR was performed (94 C for 2 minutes, 40 cycles of 94 C for 15 seconds, 63 C for 30 seconds and 72 C for 30 seconds, and a final extension step at 72 C for 2 minutes).
Upon completion of the PCR reaction, the hybrid well cover was removed and the slide was placed in hexane for 5 minutes to remove the mineral oil. The coverslip was carefully removed. The slide was then dipped in clean hexane to remove residual oil prior to incubation in a 2X Sybr Green solution (20 μl Sybr GreenI (Molecular Probes) in 100 ml 1x TBE) for 15 minutes. Finally, the slide was washed in 1x TBE for 15 minutes and scanned using a ScanArray 5000 microarray scanner (PerkinElmer) with the FITC laser and filter set.
Denaturation and electophoresis of polony gels
The polony DNA was denatured and a sequencing primer was hybridized to the 5' side of the 4208A/G SNP prior to in situ sequencing. The double stranded polonies were made single stranded by stripping away the non-acrydited strand in a two step procedure. The first step was to denature the polonies by incubating the gels in a formamide buffer (1x SSC, 70% formamide, 25% dd-water) at 70 C for 15 minutes. Immediately following denaturation, the gels were electrophoresed to remove the non-acrydited strand.
Hybridization and in situ sequencing
After electrophoresis, the polony slides were washed 4 × in wash 1E (0.1 M Tris-Cl, pH 7.5, 20 mM EDTA, 0.5 M KCl) to prepare for hybridization of the sequencing primer. 200 μl of annealing buffer (6x SSPE, 0.01% Triton X-100) containing 0.5 μM sequencing primer (5'-TGATACTGTCTAATGTATGAACTTTTAATA-3', [6]) was then pipetted onto the gel and covered with a hybrid well chamber. The sample was then placed in a hybridization tower and heated for 2 minutes at 94 C followed by 20 minutes at 60 C to facilitate hybridization.
The SNP was sequenced using a single base extension of the sequencing primer with fluorescently labeled dNTPs. Following hybridization, the gels were washed 2 × in Wash1E and then equilibrated in Klenow extension buffer (50 mM Tris-Cl, pH 7.5, 5 mM MgCl2, 0.01% Triton X-100) for 1 minute. For each sample, 50 μl solution containing approximately 5 units of Klenow large fragment (New England Biolabs), 3 μg of single stranded binding protein (US Biochemicals), and either 0.5 μM Cy5-labeled dATP or dGTP (PerkinElmer) was pipetted onto the gel. The single base extension was allowed to proceed for 2 minutes. The gels were then washed in Wash1E to reduce background fluorescence and scanned on the ScanArray5000 with the appropriate lasers and filters. The process of formamide denaturation, hybridization, in situ sequencing, and scanning was repeated an additional time. This was necessary to completely discriminate nucleotides 4208A and 4208G in heterozygous PKD2 transcripts.
Authors' Contributions
JAB performed most of the experiments in this manuscript in addition to writing the preliminary manuscript. HY helped design experiments and also performed all the experiments necessary to procure the cDNA used in this project. VM performed valuable experiments needed to complete this work. JSE conceived and funded this project. All authors read and approved the final manuscript.
Acknowledgments
Acknowledgements
The authors would like to acknowledge Bert Vogelstein and Kenneth Kinzler at the Sidney Kimmel Comprehensive Cancer Center and the Howard Hughes Medical Institutions for comments on this manuscript and insightful discussions. In addition, we would like to thank the NIH, US DOE Office of Biological and Environmental Research and the University of Delaware Research Foundation for funding this work.
Contributor Information
James A Butz, Email: butz@che.udel.edu.
Hai Yan, Email: yanhaijhu@yahoo.com.
Venugopal Mikkilineni, Email: venu@udel.edu.
Jeremy S Edwards, Email: edwards@che.udel.edu.
References
- Mitra RD, Church GM. In situ localized amplification and contact replication of many individual DNA molecules. Nucleic Acids Res. 1999;27:e34. doi: 10.1093/nar/27.24.e34. [DOI] [PMC free article] [PubMed] [Google Scholar]
- Merritt Joshua, DiTonno Jason R., Mitra Robi D., Church George M., Edwards Jeremy S. Functional characterization of mutant yeast PGK1 within the context of the whole cell. Nucleic Acids Res. 2003;31:e84. doi: 10.1093/nar/gng084. [DOI] [PMC free article] [PubMed] [Google Scholar]
- Mitra RD, Butty VL, Shendure J, Williams BR, Housman DE, Church GM. Digital genotyping and haplotyping with polymerase colonies. Proc Natl Acad Sci U S A. 2003;100:5926–5931. doi: 10.1073/pnas.0936399100. [DOI] [PMC free article] [PubMed] [Google Scholar]
- Chetverina HV, Samatov TR, Ugarov VI, Chetverin AB. Molecular colony diagnostics: detection and quantitation of viral nucleic acids by in-gel PCR. Biotechniques. 2002;33:150–2, 154, 156. doi: 10.2144/02331md03. [DOI] [PubMed] [Google Scholar]
- Butz J, Wickstrom E, Edwards JS. Characterization of Mutations and LOH of p53 and K-ras2 in Pancreatic Cancer Cell Lines by Immobilized PCR. BMC Biotechnol. 2003;3:11. doi: 10.1186/1472-6750-3-11. [DOI] [PMC free article] [PubMed] [Google Scholar]
- Yan H, Yuan W, Velculescu VE, Vogelstein B, Kinzler KW. Allelic variation in human gene expression. Science. 2002;297:1143. doi: 10.1126/science.1072545. [DOI] [PubMed] [Google Scholar]
- Schadt EE, Monks SA, Drake TA, Lusis AJ, Che N, Colinayo V, Ruff TG, Milligan SB, Lamb JR, Cavet G, Linsley PS, Mao M, Stoughton RB, Friend SH. Genetics of gene expression surveyed in maize, mouse and man. Nature. 2003;422:297–302. doi: 10.1038/nature01434. [DOI] [PubMed] [Google Scholar]
- Vogelstein B, Kinzler KW. Digital PCR. Proc Natl Acad Sci U S A. 1999;96:9236–9241. doi: 10.1073/pnas.96.16.9236. [DOI] [PMC free article] [PubMed] [Google Scholar]


