Abstract
Background
Four genes designated as PTPRK (PTPκ), PTPRL/U (PCP-2), PTPRM (PTPμ) and PTPRT (PTPρ) code for a subfamily (type R2B) of receptor protein tyrosine phosphatases (RPTPs) uniquely characterized by the presence of an N-terminal MAM domain. These transmembrane molecules have been implicated in homophilic cell adhesion. In the human, the PTPRK gene is located on chromosome 6, PTPRL/U on 1, PTPRM on 18 and PTPRT on 20. In the mouse, the four genes ptprk, ptprl, ptprm and ptprt are located in syntenic regions of chromosomes 10, 4, 17 and 2, respectively.
Results
The genomic organization of murine R2B RPTP genes is described. The four genes varied greatly in size ranging from ~64 kb to ~1 Mb, primarily due to proportional differences in intron lengths. Although there were also minor variations in exon length, the number of exons and the phases of exon/intron junctions were highly conserved. In situ hybridization with digoxigenin-labeled cRNA probes was used to localize each of the four R2B transcripts to specific cell types within the murine central nervous system. Phylogenetic analysis of complete sequences indicated that PTPρ and PTPμ were most closely related, followed by PTPκ. The most distant family member was PCP-2. Alignment of RPTP polypeptide sequences predicted putative alternatively spliced exons. PCR experiments revealed that five of these exons were alternatively spliced, and that each of the four phosphatases incorporated them differently. The greatest variability in genomic organization and the majority of alternatively spliced exons were observed in the juxtamembrane domain, a region critical for the regulation of signal transduction.
Conclusions
Comparison of the four R2B RPTP genes revealed virtually identical principles of genomic organization, despite great disparities in gene size due to variations in intron length. Although subtle differences in exon length were also observed, it is likely that functional differences among these genes arise from the specific combinations of exons generated by alternative splicing.
Keywords: central nervous system, dephosphorylation, alternative splicing, adhesion molecules
Background
Over the past decade, receptor protein tyrosine phosphatases (RPTPs) have emerged as integral components of signal transduction in the vertebrate and invertebrate central nervous system. RPTP domain structure suggests cell adhesive properties, and studies on Drosophila mutants have provided strong evidence that specific RPTPs act together to provide a set of partially redundant signals necessary for muscle targeting and fasciculation decisions in CNS neurons [1,2], both crucial components in the establishment and maintenance of neural circuits.
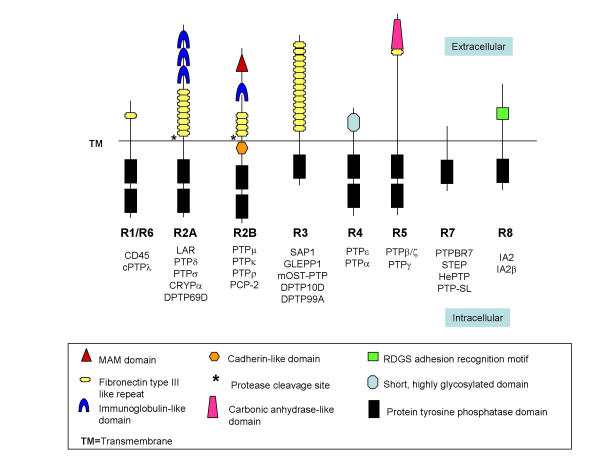
RPTPs have been divided into eight major subfamilies (Figure 1), based on phylogenetic analysis of the phosphatase domains [3]. Four of these subfamilies (R2A, R2B, R3, and R4) play critical roles in CNS development [4]. Common to all Type 2 RPTPs is an extracellular segment containing a combination of multiple fibronectin and immunoglobulin (Ig)-like domains, and a single transmembrane region. The intracellular region contains a membrane proximal juxtamembrane domain, followed by a catalytically active tyrosine phosphatase domain and a second inactive domain. Type 2 RPTPs have been further subdivided into two distinct classes (R2A and R2B). Genes in the R2B class are differentiated from the R2A class by an additional MAM (Meprin/ A5/PTP mu) domain at the N-terminus [5]. In addition to a putative role in signal transduction, R2B molecules have cell adhesive properties [6]. Because no invertebrate homologues of the four R2B molecules have been found to date [7], and no ESTs indicative of R2Bs have been isolated from invertebrates, the function(s) of these phosphatases is likely to be highly specific to vertebrate species.
Figure 1.
Classification of receptor-like protein tyrosine phosphatases (RPTPs) into eight subfamilies (R1-R8), based on sequence similarity among PTP catalytic domains [3]. PTPμ, κ, ρ and PCP-2 are members of the R2B subfamily.
Previously, we have described the genomic structure of human PTPρ [8] and have shown that the transcript is expressed primarily in the central nervous system where it delineates a distinct developmental compartment in the cerebellar cortex [9,10]. In the present study, the genomic structures of all four murine R2B genes (PTPκ, PTPμ, PTPρ and PCP-2) were compared, and their expression localized to specific cell types within the central nervous system. The 5'-genomic sequences were examined for putative promoter regions and transcription factor binding sites, and full-length sequences were used to determine the phylogenetic relationship between the four genes. Clustal-X alignment of cDNA and Genbank sequences predicted the presence of alternatively spliced exons. Five such exons were confirmed experimentally, with the majority being localized in the juxtamembrane and first phosphatase domain in each of the four genes.
Results and Discussion
Murine R2B gene size and exon/intron organization
The chromosomal localization of the R2B genes has been determined in several vertebrate species: In the human, the PTPRK gene is located on chromosome 6, PTPRL/U on 1, PTPRM on 18 and PTPRT on 20. In the rat, PTPRK (NW_047547; incomplete) is located on chromosome 1, PTPRL (NW_047724) on 5, PTPRM (NM_047819) on 9, and PTPRT (MN_47659) on 3. The four murine R2B genes (ptprk/PTPκ, ptprl/PCP-2, ptprm/PTPμ, and ptprt/PTPρ) are located on mouse chromosomes 10, 4, 17, and 2, respectively.
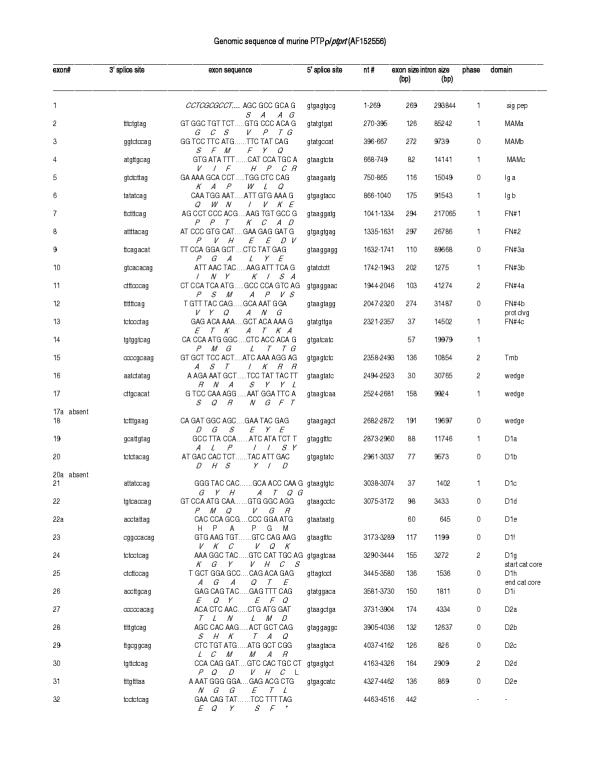
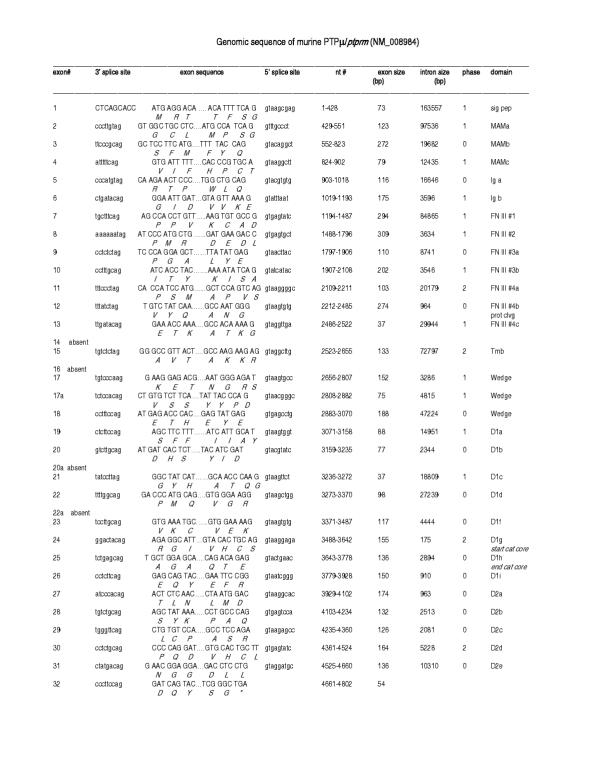
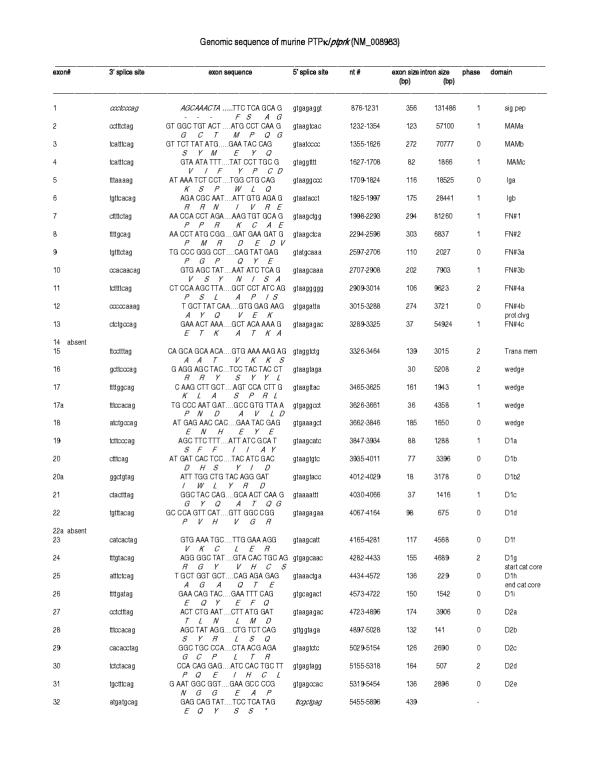
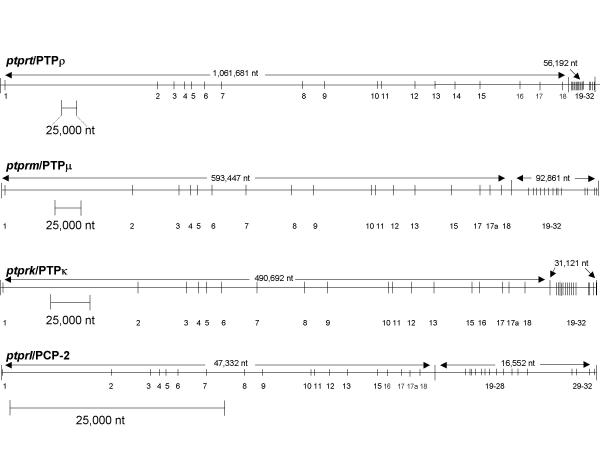
Murine and human R2B cDNA sequences were used to identify the corresponding genomic DNA contigs in the Celera and NCBI genomic databases, using BLAST and MEGABLAST programs. Alignments were used to establish exon and intron size, and junction phase. The genomic structure of human PTPρ has been reported previously [8]; the human PTPμ, κ and PCP-2 annotated structures are available from the authors (rotter.1@osu.edu) upon request. The sizes and genomic organization of the mouse R2B genes are derived from Figures 2, 3, 4, 5, and are summarized in Figure 6. The overall size of the mouse genes and their corresponding human orthologs was very similar. In general, gene size exceeded the average, especially in the case of PTPρ, which was the largest gene (~1,117,873 bp), followed by PTPμ (~686,308 bp), PTPκ (~521,813 bp) and PCP-2 (~63,884 bp) (Figure 6). The recent completion of the human chromosome 20 sequence [11] revealed that PTPρ is the largest confirmed gene on that chromosome, due primarily to expanded introns in the genomic region containing coding regions for the extracellular and juxtamembrane segments of the protein. Although the functional consequence of this large gene size is not clear, one predicted outcome is an extended time period for transcription of the corresponding mRNA.
Figure 2.
Organization of the murine PTPρ gene based on Celera genomic sequences. Left to right: Exon number, 3' splice site, exon sequence, 5' splice site, nucleotide number, exon size, intron size, intron phases and protein domain are shown. Amino acids (standard one letter code) are listed below the encoding nucleotides. D1 and D2 represent the first and second phosphatase domains, respectively; a to i designations indicate the individual exons within a single domain.
Figure 3.
Organization of the murine PTPμ gene based on Celera genomic sequences. Left to right: Exon number, 3' splice site, exon sequence, 5' splice site, nucleotide number, exon size, intron size, intron phases and protein domain are shown. Amino acids (standard one letter code) are listed below the encoding nucleotides. D1 and D2 represent the first and second phosphatase domains, respectively; a to i designations indicate the individual exons within a single domain.
Figure 4.
Organization of the murine PTPκ gene based on Celera genomic sequences. Left to right: Exon number, 3' splice site, exon sequence, 5' splice site, nucleotide number, exon size, intron size, intron phases and protein domain. Amino acids are listed below the encoding nucleotides. D1 and D2 represent the first and second phosphatase domains, respectively; a to i designations indicate the individual exons within a single domain.
Figure 5.
Organization of the murine PCP-2 gene based on Celera genomic sequences. Left to right: Exon number, 3' and 5' splice sites, nucleotide number, exon size, intron size, intron phases and protein domain are shown. Amino acids (standard one letter code) are listed below the encoding nucleotides. D1 and D2 represent the first and second phosphatase domains, respectively; a to i designations indicate the individual exons within a single domain. **Exon not transcribed in brain.
Figure 6.
Genomic organization of the murine RPTP R2B genes. Exons are shown as vertical bars and introns as thin horizontal lines drawn to different scales (indicated by scale bars). The size of the genomic regions encoding the extracellular and intracellular segments of each gene is not drawn proportionally. Note that exon distribution and clustering is similar for each gene.
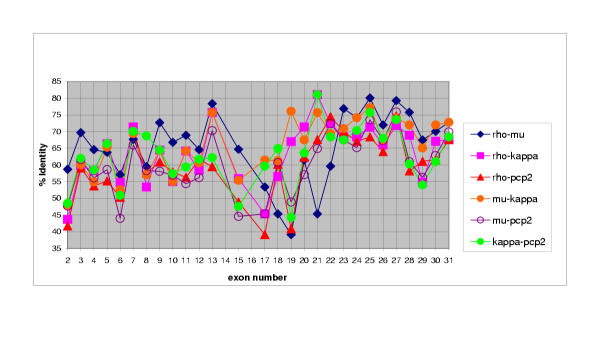
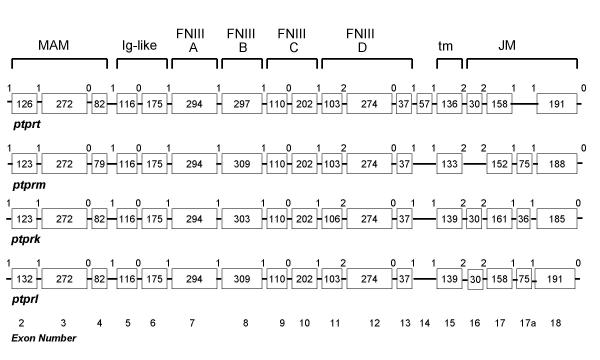
Each of the R2B genes contained over 30 exons, which were examined pairwise to determine the overall nucleotide/exon identity between the four genes (Figure 7). Three major regions were delineated, each with varying degrees of sequence identity: Exons 2–13 comprised the extracellular segment (MAM, Ig and four fibronectin (FN) type III domains), exon 14–18 (juxtamembrane region), and exons 19–32 (two phosphatase domains). Although the number of exons comprising each of the extracellular domains was identical in each of the four genes, exon size varied in some domains and remained unchanged in others. Within the extracellular segment, the MAM domain showed the most extensive variation in exon size: The first exon ranged from 123 to 132 bp, and the third from 79 to 82bp (Figure 8). MAM domains are comprised of 160–170 amino acids containing four conserved cysteines; their function has been examined in some detail. When expressed in non-adherent cells, PTPμ [12-14] and PTPκ [15] proteins formed large calcium-independent clusters. Aggregation was strictly homophilic, consisting exclusively of cells expressing only a single R2B type [14-16]. Because this property had not been demonstrated with any of the other RPTP subfamilies, a crucial role for the MAM domain in this homophilic interaction was implied. However, in an in vitro binding assay in which regions of recombinant PTPμ were expressed [17], the homophilic binding site was localized to the immunoglobulin (Ig)-like domain. Subsequently, MAM and Ig domains were shown to function cooperatively in homophilic binding in both PTPμ and PTPκ [16]. It was suggested that the binding site is located in the Ig domain and the MAM domain is part of a "sorting" mechanism that confers homophilic binding specificity [6]. Figures 7 and 8 show that, when combined with the invariant 272 bp middle exon, each R2B MAM domain had a unique combination of exon sizes and low sequence identity, indicating a region of high specificity. The adjacent Ig-like domain contained exons of identical size, implying a less specific role than that of the MAM domain. These marked variations in sequence identity are consistent with the idea that the MAM domain plays a role in the mediation of homophilic binding specificity [6].
Figure 7.
Pairwise percentage nucleotide identity of individual exons. Exons 2–31 of the four murine R2B genes were compared in a pairwise fashion. Exon numbers are listed on the x axis, and the corresponding percentage identity for that exon is shown on the y axis. Three distinct regions may be discerned: The extracellular (exons 2–13), juxtamembrane (exons 14–18) and phosphatase (exons 19–32) domains.
Figure 8.
Exon sizes within the murine R2B extracellular and juxtamembrane domains. Boxed numbers indicate the number of nucleotides in each exon; interconnecting horizontal lines represent introns (neither are to scale). The numbers between exons indicate intron phases. Note the variation in exon utilization in the trans (tm) -and juxtamembrane (jm) region.
The four FN type III repeats are involved in general adhesive interactions. The size of the first and third of these domains was identical among the R2B genes, whereas the second and fourth FNIII domains differed slightly (Figure 8). In the second FNIII domain, exon sizes varied from 297 in ptprt, to 303 in ptprk, and 309 in ptprm and ptprl. The only difference in the fourth FNIII domain was in ptprk, in which one of the three exons comprising this domain was slightly larger (106 vs 103) than in the other three genes.
Within the intracellular segment, the most dramatic variation in size, number and percentage nucleotide identity was observed in exons corresponding to the juxtamembrane region (Figures 7 and 8). This region consisted of six distinct exons (14–18) and is thought to be involved in substrate recognition and specificity, properties likely to show the greatest differences among the RPTPs (discussed below). Sequence comparison and exon/intron structure indicated that the two phosphatase domains (exons 19–32) were highly conserved. Furthermore, the degree of nucleotide identity was constrained to a relatively narrow range. A detailed analysis of the R2B phosphatase domains has been described previously [8].
The first intron in all four R2B genes (Figure 6) was disproportionately large, a feature shared with other cell adhesion molecules. Intron/exon junctions (Figures 2, 3, 4, 5) conformed to the AG/GT rule [18]. Precise exon boundaries were determined by the presence of consensus splice sites [19] and preservation of the cDNA reading frame. Exon/intron boundaries were identical in all four mouse and human genes. Extracellular exons were primarily in phase 1 and the boundaries of the protein domains were always demarcated by a phase 1 boundary. In contrast, intracellular exons were much smaller and the majority, including those aligned with domain boundaries, was in phase 0 (Figures 2, 3, 4, 5, 8).
In situ hybridization
Previous in situ hybridization and Northern studies have shown that the four R2B family members are expressed in many tissues throughout development: PTPκ mRNA was present in brain, lung, skeletal muscle, heart, placenta, liver, kidney, and intestine; PTPμ was present in brain, lung, skeletal muscle, heart, placenta, and embryonic blood vessels [20,21], and PCP-2 was detected in the brain, lung, skeletal muscle, heart, kidney and placenta [20,22,23]. The distribution of PTPρ is somewhat anomalous in that it was almost entirely restricted to the brain and spinal cord [9,10].
In the present study, digoxigenin–labeled cRNA probes were used to determine the cellular localization of R2B transcripts in specific regions of the adult (P180) mouse brain: The olfactory bulb, cerebral cortex, hippocampus and cerebellum (Figure 9). Each of the four R2B transcripts was expressed at moderate to high levels in the mitral, external granule and glomerular layers of the olfactory bulb, and at lower levels in the external plexiform layer. All four R2B transcripts were distributed throughout the cerebral cortex, with the highest levels observed in layers II, IV, and V (PTPρ), IV and V (PTPμ), II to V (PTPκ), and II through VI (PCP-2). Within the hippocampus and dentate gyrus, large cells (Golgi II neurons) scattered throughout the hippocampal CA1, CA2, and CA3 regions, oriens and pyramidal layers, the hilus and subiculum, expressed PTPρ and PTPμ at very high levels. The PTPκ and PCP-2 transcripts were also present in Golgi II neurons, however, expression was restricted to cells in the hilus (PTPκ, PCP-2) and subiculum (PCP-2). Much higher expression levels were present in hippocampal pyramidal cells and dentate granule cells. Each of the four R2B transcripts was differentially expressed in the cerebellum. PTPρ mRNA was almost entirely restricted to the granule cell layer of lobules 1–6 of the cerebellar cortex and deep cerebellar neurons; very sparse labeling was also present in basket and stellate cells in the molecular layer. PTPμ was expressed at high levels in the Purkinje cells, and at much lower levels in Golgi, stellate and basket cells. The PTPκ transcript was present at low levels in basket, stellate, Golgi and granule cells throughout the cerebellar molecular and granule cell layers. PCP-2 was expressed at moderate levels in granule and Purkinje cells, and at lower levels in basket and stellate cells, and in deep cerebellar neurons. The sense signal for each of the four genes (not shown) was very low and distributed uniformly across sections, indicating that non-specific expression was negligible. These studies show that each of the four R2B transcripts exhibit exclusive, as well as overlapping, distribution patterns.
Figure 9.
Type R2B gene expression in the adult mouse brain. In situ hybridization using digoxigenin-labeled riboprobes was used to localize the four R2B phosphatases in sagittal sections of a P180 male C57BL/6 mouse brain. PTPρ (A-E), PTPμ (F-J), PTPκ (K-O), and PCP-2 (P-T) transcripts were present in various regions of the CNS including the olfactory bulb, cortex, hippocampus, and cerebellum. Olfactory bulb: ac, anterior commissure; g, granule layer; m, mitral cell layer; gl, glomerular layer; epl, external plexiform layer. Cortex: cortical layers I-VI. Hippocampus: d, dentate gyrus; h, hilus; or, oriens layer; py, pyramidal layer; r, radiatum layer; GII, Golgi II neurons. Cerebellum: dcn, deep cerebellar nuclei; ml, molecular layer; P, Purkinje cell layer; g, granule cell layer; G, Golgi cells. Arrowhead (D) shows anterior-posterior cerebellar boundary. Scale bars: Columns 1, 2 and 3 = 50 μm; column 4 = 500 μm; column 5 = 100 μm.
Phylogenetic analysis of murine RPTP R2B cDNA sequences
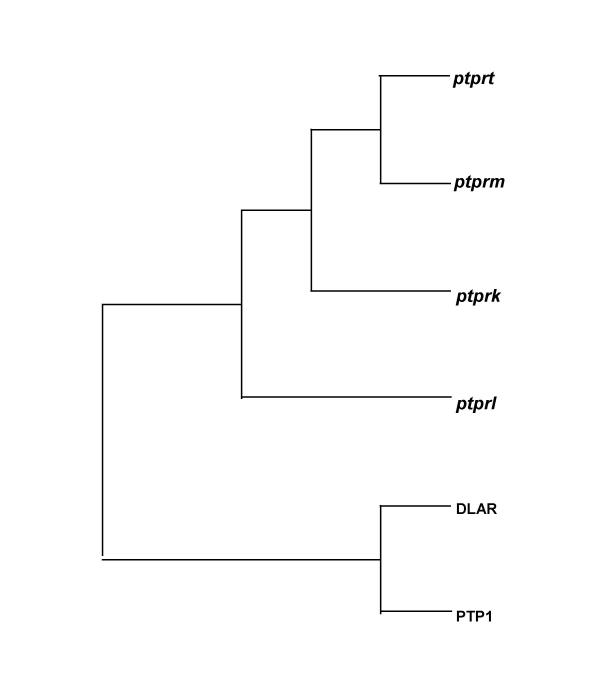
The phylogenetic relationship of the entire sequence of the R2B phosphatases encompassing both extra- and intracellular regions was compared. Analysis of the full-length mouse cDNA nucleotide and predicted amino acid sequences indicated that the four genes originated from a common ancestor that gave rise to two separate branches (Figure 10). Of the four R2B genes, PTPρ (ptprt) and PTPμ (ptprm) were most closely related, followed by PTPκ (ptprk). The most distant member was PCP-2 (ptprl). Previous phylogenetic analyses, based solely on the comparison of the first [3,24] and second [25] phosphatase domains, provided similar results. A priori, the four type R2B phosphatases could have arisen either by a single fusion event followed by at least two rounds of duplication, or by several separate fusion events. In the first instance, the phylogenetic tree generated by comparing the first phosphatase domains should be the same as that generated by comparing the entire proteins. Different phylogenetic trees would be expected if the four R2B phosphatases were generated by separate fusion events. Our finding that the phylogenetic relationship of the four complete proteins is the same as that of the phosphatase domains argues in favor of the former explanation, and supports the contention that during the transition from single-celled to multicellular organisms, double domain phosphatases originated by duplication, followed by fusion to cell adhesion-like genes [25].
Figure 10.
Murine R2B phylogenetic relationships. Parsimony tree constructed from full-length sequences of mouse R2B cDNAs. PTPρ and PTPμ are most closely related.
Transcription Factor Binding sites
Regions upstream from the transcriptional start site are likely to be involved in the regulation of gene expression. Although the overall cDNA sequences of the four R2B RPTPs were quite similar, the 5' UTRs varied significantly in sequence and length. Predicted transcription factor binding sites included both unique and common motifs (Table 1). Putative binding sites unique to each of the R2B phosphatases included AP-1, HSF1, TST-1 and YY1 (PTPκ); delta EF-1, E4BP4, freac-3 and p53 sites (PTPμ); AP-2, c-Myb, NF-1, sox-5, and Sp-1 sites (PTPρ), and freac-7, HFH-8, HNF-3beta and N-Myc sites (PCP-2). Sites common to all four R2B genes included Oct-1, CdxA, C/EBP, En-1, GATA-1, GATA-2, GKLF, HoxA3, Ik-2, Msx-1, Pax-4 and SRY. The greatest number of binding motifs (6–20) was for CdxA, a homeobox-containing gene whose expression demarcates embryonic anterior-posterior boundaries [26]. Also occurring at high frequency were SRY (3–10), C/EBP (3–7), AML-1a (4–7) and HoxA3 (5–8) motifs. Each of the R2B genes also had multiple transcription factor binding sites for engrailed-1, which is active in specific cell types of the developing central nervous system [27]. All four genes had at least one Pax-4 binding motif; these sites are activated in the pancreas [28], coinciding with our observation [29] that all four R2B genes are expressed in the MIN-6 cell line, which is derived from pancreatic β cells. The PTPκ and PTPρ putative promoter regions also had a Pax-2 binding motif; Pax-2 directs expression in the developing kidney [30], a documented feature of PTPκ expression in the developing mouse [20]. Many of these predicted transcription factor-binding sites have important roles in the developing central nervous system, where R2B transcripts have both overlapping and distinctly different distributions. The diversity seen in the promoters of the four genes, which otherwise share high nucleotide and even higher amino acid identity, could contribute to their unique patterns of expression.
Table 1.
Predicted transcription factor binding sites in the 5' promoter regions of four R2B phosphatases.
| Transcription factor binding sites | PTPρ | PTPμ | PTPκ | PCP-2 |
| AML-1a | 4 | 5 | 0 | 7 |
| AP-1 | 0 | 0 | 1 | 0 |
| AP-2 | 1 | 0 | 0 | 0 |
| AP-4 | 2 | 0 | 1 | 0 |
| C/EBP | 6 | 4 | 3 | 7 |
| C/EBPalpha | 0 | 1 | 0 | 1 |
| CdxA | 9 | 6 | 12 | 20 |
| c-Ets-1(p54) | 2 | 1 | 3 | 0 |
| c-Myb | 1 | 0 | 0 | 0 |
| c-Myc/Max | 1 | 0 | 1 | 0 |
| DeltaEF-1 | 0 | 1 | 0 | 0 |
| E4BP4 | 0 | 1 | 0 | 0 |
| En-1 | 2 | 7 | 3 | 5 |
| Freac-3 | 0 | 1 | 0 | 0 |
| Freac-7 | 0 | 0 | 0 | 2 |
| GATA-1 | 3 | 2 | 1 | 3 |
| GATA-2 | 1 | 1 | 1 | 1 |
| GATA-3 | 0 | 2 | 2 | 0 |
| GKLF | 2 | 2 | 1 | 1 |
| GR | 1 | 1 | 0 | 0 |
| HFH-8 | 0 | 0 | 0 | 1 |
| HNF-3beta | 0 | 0 | 0 | 1 |
| HOXA3 | 5 | 7 | 8 | 7 |
| HSF1 | 0 | 0 | 1 | 0 |
| HSF2 | 1 | 0 | 1 | 1 |
| Ik-2 | 1 | 4 | 1 | 2 |
| Lmo2 complex | 1 | 1 | 0 | 0 |
| Msx-1 | 6 | 1 | 1 | 4 |
| Myb | 0 | 2 | 1 | 0 |
| MZF1 | 3 | 1 | 1 | 0 |
| NF-1 | 2 | 0 | 0 | 0 |
| NF-AT | 0 | 0 | 1 | 4 |
| Nkx2.5 | 0 | 2 | 1 | 4 |
| N-Myc | 0 | 0 | 0 | 1 |
| Oct-1 | 3 | 2 | 5 | 1 |
| p300 | 1 | 2 | 0 | 0 |
| p53 | 0 | 1 | 0 | 0 |
| Pax-2 | 1 | 0 | 1 | 0 |
| Pax-4 | 5 | 1 | 1 | 1 |
| Pbx-1 | 0 | 1 | 2 | 3 |
| Sox-5 | 1 | 0 | 0 | 0 |
| Sp1 | 2 | 0 | 0 | 0 |
| SRY | 3 | 6 | 10 | 9 |
| TCF11 | 1 | 2 | 0 | 0 |
| TST-1 | 0 | 0 | 1 | 0 |
| USF | 2 | 0 | 0 | 1 |
| YY1 | 0 | 0 | 2 | 0 |
Alternative splicing of PTPμ, PTPκ, PTPρ, PCP-2 genes
In our analysis of R2B genomic structure, exons in the juxtamembrane region exhibited the greatest variability in sequence identity, suggesting important functional differences among the four R2B phosphatases. A combination of phase information from individual human and murine R2B genomic structures and extensive Clustal X alignment of full-length cDNA sequences from Genbank (including PTPρ sequences from this laboratory) was used to predict the presence of alternatively spliced exons. Comparison of the four R2B sequences revealed at least 8 exons that were potentially alternatively spliced. Splicing was examined in neonatal and adult C57BL/6 mouse brain (cortex, forebrain, brainstem, and cerebellum) and in human fetal brain using RT-PCR. PCR primers were designed to amplify regions encapsulating exons 7, 8, 14, 16 and 17/18 (17a), 20/21(20a), 22/23 (22a), and 28/29 (28a) for each of the four genes. The four R2B genes shared a common "core" of 30 exons. Exon numbers were based on those described for PTPρ [8]. PCR experiments showed that five of the eight tested exons (14, 16, 17a, 20a, and 22a) were alternatively spliced. Exons 7 and 8 were present and exon 28a was absent in all R2B transcripts tested. All but one of the alternatively spliced exons (14) was located in the R2B intracellular segment. Exon 14 preceded the transmembrane region; exons 16 and 17a encoded intracellular juxtamembrane sequences, and the last two exons (20a, and 22a) encoded portions of the catalytically active, first phosphatase domain.
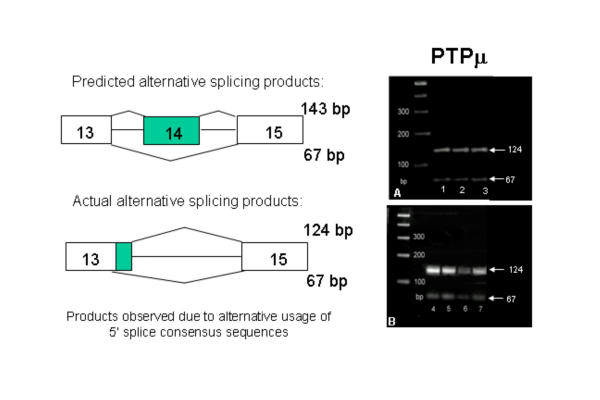
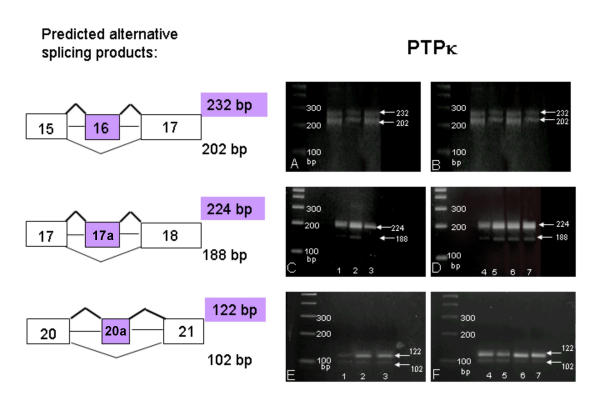
Each of the four R2B genes expressed in the brain used the five alternatively spliced exons in a different combination: In PTPρ transcripts, exon 17a and 20a were absent, and exons 14, 16, and 22a were alternatively spliced (Figure 11). In PTPμ transcripts, exons 14, 16, 20a and 22a were absent; exon 17a was present and not alternatively spliced. The alternative use of two 5' splice consensus sites resulted in the transcription of an additional 58 bp of the intron between exons 13 and 15 (Figure 12). In PTPκ mRNA, exons 14 and 22a were absent, and exons 16, 17a and 20a were alternatively spliced (Figure 13). In PCP-2 mRNA, exons 14 was absent, exon 16 was not transcribed in brain, and exons 17a, 20a, and 22a were alternatively spliced (Figure 14). These results are summarized in Table 2. Splicing was also examined in human R2B transcripts where the use of alternatively spliced exons was virtually identical to that observed in the mouse genes. No age-related or regional differences were observed in the CNS in any of the above studies.
Figure 11.
Alternative splicing of PTPρ mRNA. RT-PCR products were amplified using primers flanking exon 14 (panels A and B), exon 16 (panels C and D) and exon 22a (panels E and F). Left panels: bands in lanes 1, 2, and 3 are from human fetal brain, mouse P1 brain, and mouse P60 brain total RNA, respectively. Right panels: bands in lanes 4, 5, 6 and 7 contain total RNA from cerebellum, brain stem, basal forebrain and cortex (P23), respectively. Transcripts containing both splice forms of exons 14, 16 and 22a were found in all lanes.
Figure 12.
Alternative splicing of PTPμ mRNA. RT-PCR products were amplified using primers flanking exon 14. Panel A: Bands in lanes 1, 2, and 3 are from human fetal brain, mouse P1 brain, and mouse P60 brain total RNA, respectively. Panel B: Bands in lanes 4, 5, 6 and 7 contain total RNA from P23 cerebellum, brain stem, basal forebrain and cortex, respectively. Transcripts containing both splice forms were found in all lanes.
Figure 13.
Alternative splicing of PTPκ mRNA. RT-PCR products were amplified using primers flanking exon 16 (panels A and B), exon 17a (panels C and D) and exon 20a (panels E and F). Left panels: bands in lanes 1, 2, and 3 are from human fetal brain, mouse P1 brain, and mouse P60 brain total RNA, respectively. Right panels: bands in lanes 4, 5, 6 and 7 contain total RNA from cerebellum, brain stem, basal forebrain and cortex (P23), respectively. Transcripts containing both splice forms of exons 16 and 20a were found in all lanes.
Figure 14.
Alternative splicing of PCP-2 mRNA. RT-PCR products were amplified using primers flanking exon 17a (panels A and B), exon 20a (panels C and D) and exon 22a (panels E and F). Left panels: bands in lanes 1, 2, and 3 are from human fetal brain, mouse P1 brain, and mouse P60 brain total RNA, respectively. Right panels: bands in lanes 4, 5, 6 and 7 contain total RNA from cerebellum, brain stem, basal forebrain and cortex (P23), respectively. Transcripts containing both splice forms of exons 17a, 20a, and 22a were found in all lanes.
Table 2.
Summary of exon usage in R2B juxtamembrane and phosphatase domains.
| Exon # | PTPρ | PTPμ | PTPκ | PCP-2 |
| 7 | 1 | 1 | 1 | 1 |
| 8 | 1 | 1 | 1 | 1 |
| 14 | 2 | 0 | 0 | 0 |
| 16 | 2 | 0 | 2 | 1** |
| 17a | 0 | 1 | 2 | 2 |
| 20a | 0 | 0 | 2 | 2 |
| 22a | 2 | 0 | 0 | 2 |
| 28a | 0 | 0 | 0 | 0 |
Eight genomic regions containing predicted exons were examined. 0 indicates that the exon was absent (one band at the smallest expected size); 1 indicates the exon was present, but not alternatively spliced (one band seen at the largest expected size); 2 indicates that the exon was present and alternatively spliced (2 bands observed). ** exon not transcribed in brain.
The high frequency of alternatively spliced exons in the R2B juxtamembrane segment suggests that the region has highly specialized functions. The importance of alternatively spliced exons has been well documented for the closely related Type 2 RPTP, LAR, in which a small (27 bp) alternatively spliced exon (LASE-c) was identified in the fifth FN-III domain [31]. Subsequently, a 33 bp exon (LASE-a), was identified in the intracellular juxtamembrane region [32]. LASE-a, which was shown to be brain specific and developmentally regulated, was present in cell bodies of cultured granule cells, but was absent in neurites. Conversely, the LASE-c isoform was absent in cell bodies and present in neurites. Using in vitro ligand binding assays, the laminin-nidogen extracellular matrix complex was identified as a ligand for LAR, specifically interacting with the fifth FN-III domain [33]. When LAR bound the laminin-nidogen complex, cells formed long processes. Inclusion of the alternatively spliced 27 bp LASE-c exon disrupted this binding, causing changes in cell morphology. These studies imply a role for alternatively spliced exons in neurite extension through modification of cell adhesion.
The juxtamembrane region of the four R2B phosphatases shows greater variation in exon size and number, and is considerably longer, than the comparable region in other receptor-like PTPs. Furthermore, the region displays sequence similarity to the intracellular domain of cadherins, a family of calcium-dependent transmembrane proteins involved in homophilic cell adhesion. Cadherins bind catenins [34], which in turn bind the actin cytoskeleton [35] thereby influencing cell adhesiveness and changes in morphological attributes such as neurite extension and growth cone rearrangement. The intracellular domain is highly conserved among cadherin family members, and is essential for cadherin-mediated cell adhesion [36]. Both PTPμ [37] and PTPκ [38] have been shown to stimulate neurite extension in retinal explants and in cerebellar cultures, respectively. Furthermore, the intracellular segment of PTPμ binds directly to the intracellular domain of E-cadherin [39,40] in a complex with α- and β-catenin. The other R2B phosphatases have also been shown to interact with the cadherin/catenin pathway: PTPκ interacts with β- and γ-catenin at adherens junctions [41]; PCP-2 colocalizes with β-catenin and E-cadherin at cell junctions [22], and directly interacts with β-catenin [42]; and PTPρ binds cytoskeletal components including α-actinin and β-catenin [29]. More recent studies on PTPμ have further delineated this pathway: PTPμ-mediated neurite extension in retinal neurons is also dependent on PKCδ [43] and Cdc42 [44] activity. In addition, PTPμ is required for E-cadherin dependent cell adhesion [45], and for recruiting RACK1 to cell-cell contacts [46]. The physical association of PTPμ with RACK1 has been demonstrated [46]. It is likely that the juxtamembrane segment also mediates the interaction of PTPμ with these additional transduction molecules. The preponderance of alternatively spliced exons in the juxtamembrane region may add specificity to R2B adhesive functions via regulation of juxtamembrane binding specificity.
Conclusions
Analysis of the intron/exon structure of the four R2B phosphatase genes revealed that despite considerable disparities in gene size, genomic organization was virtually identical, possibly reflecting their close phylogenetic relationship. In the central nervous system, the expressions of the four transcripts were unique, perhaps resulting from the use of different transcription binding sites. Considerable variation in exon utilization was seen in the juxtamembrane domain, a region shown to interact with a variety of intracellular signal transduction molecules. Alternative splicing of exons in this region could result in different functional roles for each of the R2B phosphatases.
Methods
Genomic structure of R2B genes
The genomic structure of the four murine R2B RPTP genes was determined as follows: The R2B cDNA sequences were used to identify the corresponding genomic shotgun clones in the Celera mouse genomic DNA database, using BLAST (parameters set to default values) and MEGABLAST programs. The identified individual shotgun fragments were aligned onto their respective scaffolds, and distances were calculated based on scaffold lengths. A similar approach using the NCBI [47] and Sanger Center [48] databases was used to identify the human R2B gene structure. The identified clones were superimposed onto the assembled minimal tiling paths and the size of the genes was calculated from the sizes of the individual overlapping clones. In order to determine exon/intron organization, each cDNA sequence was compared to genomic DNA sequences using Spidey [49]. The vertebrate genomic sequence was selected as input, "use large intron sizes" was enabled, and the minimum mRNA-genomic identity was set to 60%.
Phylogenetic analysis
RPTP R2B nucleotide and amino acid sequences were aligned using Vector NTI Suite, V.6, AlignX. PAUP 4.0b10 was used to construct a phylogenetic tree of the R2B gene family. The S. cerevisiae tyrosine phosphatase PTP1, and the D. melanogaster receptor tyrosine phosphatase, DLAR, were used as outgroups. Rooted phylogenetic trees were drawn using the parsimony method with transversions weighted 10:1 over transitions, and changes in the first nucleotide of the triplet codon were weighted by a factor of 2 over changes in the second or third nucleotides. Heuristic searches were used to find the optimum tree, with the order of sequence additions randomized.
Transcription factor binding sites
The genomic region to be examined for transcription factor binding sites was determined using BLAST2 [50] and FirstEF [51]. The RPTP 5' UTRs and genomic DNA sequences were aligned pairwise to detect introns. For cases where multiple 5' UTRs were reported in Genbank, the sequences were aligned and differences identified as either an incomplete reporting of the 5' UTR, or possible alternative start sites if sequences were located in different regions of the genome. The "MATCH" program [52] was used to identify potential transcription factor binding sites in the 5000 bp preceding the 5' UTR, using the Vertebrate matrix of the TRANSFAC 5.0 database, with cut off values set to "minimize false positives and false negatives".
Riboprobe synthesis and in situ hybridization
The distribution of R2B RPTPs in the brain was determined by in situ hybridization with digoxigenin-labeled RNA probes, synthesized as follows: The design of RT-PCR and PCR primers was based on the reported sequences (Genbank) for murine PTPρ (NM_021464), PTPμ (NM_008984), PTPκ (NM_008983), and PCP-2 (NM_011214). RT-PCR primers spanned a region near the 3' end of the second phosphatase domain, and PCR primers were designed to amplify the region corresponding to the first and second phosphatase domains of PTPρ, PTPμ, and PTPκ, and the second domain of PCP-2. The expected sizes for PTPρ (1.72 kb), PTPμ (1.5 Kb), PTPκ (1.5 Kb), and PCP-2 (465 bp) were obtained and cloned into the pBLUEscript II KS vector. Probes were labeled with digoxigenin using the DIG RNA Labeling Kit (Roche #1175025) as described by the manufacturer with the following modifications. In the labeling mix, 0.5 μl of 40 U/μl RNase OUT (Life Technologies), and 2 μl of 20 U/μl T7 (antisense) or T3 (sense) RNA polymerase (Roche), was added. The DNA template was digested with 1 U/μl RNase-free DNase I (Epicentre). Transcripts were purified by standard RNA precipitation, and the pellets resuspended in 50 μl DEPC-treated H20. Adult (P60) C57BL/6 mouse brains were cryostat sectioned (20 μm) in the sagittal plane, and in situ hybridization was conducted as described previously [9,10]. Riboprobe-labeled sections were washed at a final stringency of 0.125x SSC, at 65°C. Following the hybridization washes, the sections were processed with an anti-digoxigenin antibody (Roche) [53], dried and coverslipped.
Alternative splicing of the four RPTP R2B genes
First strand cDNA was made from total RNA from neonatal (P1) and adult (P60) mouse whole brain using Superscript II Reverse Transcriptase (Invitrogen). In addition, cDNA was made from cerebellum, brainstem, forebrain and cortex of a P23 mouse, and a 16–24 week old human fetal brain (Clontech). The reverse primer (5' CACGCACACAGTTGAAGATGTCC), which was used in all RPTP first strand cDNA synthesis, is complementary to a region near the end of the first phosphatase domain (3580 to 3602 nt; NM_007050). PCR was performed (Platinum Taq, Invitrogen) as recommended by the manufacturer. All primers were used at a final concentration of 250 nM. An Eppendorf Mastercycler Gradient was used with the following cycling parameters: 2 minutes at 94°C, 35 cycles of 15 seconds at 94°C, 30 seconds at 58 or 60°C, 45 seconds at 72°C, and a final extension step (5 minutes at 72°C). The PCR products were run on 3.5% NuSieve GTG agarose (Biowhittaker) gels, stained with ethidium bromide and photographed using a Kodak DC120 camera. DNA bands were isolated and gel purified using Qiagen Gel Extraction kit. Identity of all RT-PCR products was confirmed by sequencing. Primer sequences are available from the authors upon request (rotter.1@osu.edu).
List of Abbreviations
AS, alternatively spliced; bp, base pairs; DEPC, diethyl pyrocarbonate; Ig, immunoglobulin-like domain; EST, expressed sequence tags; FN-III, fibronectin type III repeat; MAM, meprin/A5/μ domain; nt, nucleotide; PCR, polymerase chain reaction; RT-PCR, reverse transcriptase polymerase chain reaction; RPTP, receptor-like protein tyrosine phosphatase; TM, transmembrane domain; UTR, untranslated region. Genbank accession numbers for sequences used: yeast PTP1 Z74278; yeast PTP2 Z75116; mouse ptprt (PTPρ) NM_021464; human PTPRT (PTPρ) NM_007050; mouse ptprl (PCP-2) NM_011214; human PTPRU (PCP-2) NM_005704; mouse ptprm (PTPμ) NM_008984; human PTPRM (PTPμ) NM_002845; mouse ptprk (PTPκ) NM_008983; human PTPRK (PTPκ) NM_002844.
Author's Contributions
JB conducted alternative splicing experiments and bioinformatic analysis; MP conducted in situ hybridization experiments; RD identified transcription factor binding sites; AF prepared text and figures, and assisted with data analysis; AR supervised studies and assisted with data analysis.
Acknowledgments
Acknowledgments
Mouse genomic sequence data were obtained through use of the Celera Discovery System and Celera's associated databases. The work was supported by NIH grant MH57415 (AR).
Contributor Information
Julie Besco, Email: besco.1@osu.edu.
Magdalena C Popesco, Email: popesco.1@osu.edu.
Ramana V Davuluri, Email: davuluri.1@osu.edu.
Adrienne Frostholm, Email: frostholm.1@osu.edu.
Andrej Rotter, Email: rotter.1@osu.edu.
References
- Sun Q, Schindelholz B, Knirr M, Schmid A, Zinn K. Complex genetic interactions among four receptor tyrosine phosphatases regulate axon guidance in Drosophila. Mol Cell Neurosci. 2001;17:274–291. doi: 10.1006/mcne.2000.0939. [DOI] [PubMed] [Google Scholar]
- Schindelholz B, Knirr M, Warrior R, Zinn K. Regulation of CNS and motor axon guidance in Drosophila by the receptor tyrosine phosphatase DPTP52F. Development. 2001;128:4371–82. doi: 10.1242/dev.128.21.4371. [DOI] [PubMed] [Google Scholar]
- Andersen JN, Mortensen OH, Peters GH, Drake PG, Iversen LF, Olsen OH, Jansen PG, Andersen HS, Tonks NK, Moller NPH. Structural and evolutionary relationships among protein tyrosine phosphatase domains. Mol Cell Biol. 2001;21:7117–7136. doi: 10.1128/MCB.21.21.7117-7136.2001. [DOI] [PMC free article] [PubMed] [Google Scholar]
- Johnson KG, Van Vactor D. Receptor protein tyrosine phosphatases in nervous system development. Physiol Rev. 2003;83:1–24. doi: 10.1152/physrev.00016.2002. [DOI] [PubMed] [Google Scholar]
- Beckmann G, Bork P. An adhesive domain detected in functionally diverse receptors. TIBS. 1993;18:40–41. doi: 10.1016/0968-0004(93)90049-S. [DOI] [PubMed] [Google Scholar]
- Brady-Kalnay SM, Tonks NK. Protein tyrosine phosphatases as adhesion receptors. Curr Opin Cell Biol. 1995;7:650–657. doi: 10.1016/0955-0674(95)80106-5. [DOI] [PubMed] [Google Scholar]
- Walchli S, Colinge J, Hooft van Huijsduijnen R. MetaBlasts: tracing protein tyrosine phosphatase gene family roots from Man to Drosophila melanogaster and Caenorhabditis elegans genomes. Gene. 2000;253:137–43. doi: 10.1016/S0378-1119(00)00275-4. [DOI] [PubMed] [Google Scholar]
- Besco JA, Frostholm A, Popesco MC, Burghes AHM, Rotter A. Genomic organization and alternative splicing of the human and mouse RPTPρ genes. BMC Genomics. 2001;2:1. doi: 10.1186/1471-2164-2-1. [DOI] [PMC free article] [PubMed] [Google Scholar]
- McAndrew PE, Frostholm A, White RA, Rotter A, Burghes AHM. Identification and characterization of RPTPρ, a novel μ/κ-like receptor protein tyrosine phosphatase whose expression is restricted to the central nervous system. Mol Brain Res. 1998;56:9–21. doi: 10.1016/S0169-328X(98)00014-X. [DOI] [PubMed] [Google Scholar]
- McAndrew PE, Frostholm A, Evans JE, Zdilar D, Goldowitz D, Chiu I-M, Burghes AHM, Rotter A. Novel receptor protein tyrosine phosphatase (RPTPρ) and acidic fibroblast growth factor (FGF-1) transcripts delineate a rostrocaudal boundary in the granule cell of the murine cerebellar cortex. J Comp Neurol. 1998;391:444–455. doi: 10.1002/(SICI)1096-9861(19980222)391:4<444::AID-CNE3>3.0.CO;2-0. [DOI] [PubMed] [Google Scholar]
- Deloukas P, Matthews LH, Ashurst J, Burton J, Gilbert JG, Jones M, Stavrides G, Almeida JP, Babbage AK, Bagguley CL, Bailey J, Barlow KF, Bates KN, Beard LM, Beare DM, Beasley OP, Bird CP, Blakey SE, Bridgeman AM, Brown AJ, Buck D, Burrill W, Butler AP, Carder C, Carter NP, Chapman JC, Clamp M, Clark G, Clark LN, Clark SY, Clee CM, Clegg S, Cobley VE, Collier RE, Connor R, Corby NR, Coulson A, Coville GJ, Deadman R, Dhami P, Dunn M, Ellington AG, Frankland JA, Fraser A, French L, Garner P, Grafham DV, Griffiths C, Griffiths MN, Gwilliam R, Hall RE, Hammond S, Harley JL, Heath PD, Ho S, Holden JL, Howden PJ, Huckle E, Hunt AR, Hunt SE, Jekosch K, Johnson CM, Johnson D, Kay MP, Kimberley AM, King A, Knights A, Laird GK, Lawlor S, Lehvaslaiho MH, Leversha M, Lloyd C, Lloyd DM, Lovell JD, Marsh VL, Martin SL, McConnachie LJ, McLay K, McMurray AA, Milne S, Mistry D, Moore MJ, Mullikin JC, Nickerson T, Oliver K, Parker A, Patel R, Pearce TA, Peck AI, Phillimore BJ, Prathalingam SR, Plumb RW, Ramsay H, Rice CM, Ross MT, Scott CE, Sehra HK, Shownkeen R, Sims S, Skuce CD, Smith ML, Soderlund C, Steward CA, Sulston JE, Swann M, Sycamore N, Taylor R, Tee L, Thomas DW, Thorpe A, Tracey A, Tromans AC, Vaudin M, Wall M, Wallis JM, Whitehead SL, Whittaker P, Willey DL, Williams L, Williams SA, Wilming L, Wray PW, Hubbard T, Durbin RM, Bentley DR, Beck S, Rogers J. The DNA sequence and comparative analysis of human chromosome 20. Nature. 2001;414:865–871. doi: 10.1038/414865a. [DOI] [PubMed] [Google Scholar]
- Brady-Kalnay SM, Tonks NK. Purification and characterization of the human protein tyrosine phosphatase, PTPμ, from a baculovirus expression system. Mol Cell Biochem. 1993;127-128:131–141. doi: 10.1007/BF01076764. [DOI] [PubMed] [Google Scholar]
- Gebbink MFBG, Zondag GCM, Wubbolts RW, Beijersbergen RL, Van Etten I, Moolenaar WH. Cell-cell adhesion mediated by a receptor-like protein tyrosine phosphatase. J Biol Chem. 1993;268:16101–16104. [PubMed] [Google Scholar]
- Brady-Kalnay SM, Flint AJ, Tonks NK. Homophilic binding of PTPμ, a receptor-type protein tyrosine phosphatase, can mediate cell-cell aggregation. J Cell Biol. 1993;122:961–972. doi: 10.1083/jcb.122.4.961. [DOI] [PMC free article] [PubMed] [Google Scholar]
- Sap J, Jiang YP, Freidlander D, Grumet M, Schlessinger J. Receptor tyrosine phosphatase R-PTP-κ mediates homophilic binding. Mol Cell Biol. 1994;14:1–9. doi: 10.1128/mcb.14.1.1. [DOI] [PMC free article] [PubMed] [Google Scholar]
- Zondag GCM, Koningstein GM, Jiang YP, Sap J, Moolenaar WH, Gebbink MBFG. Homophilic interactions mediated by receptor tyrosine phosphatases μ and κ: A critical role for the novel extracellular MAM domain. J Biol Chem. 1995;270:14247–14250. doi: 10.1074/jbc.270.24.14247. [DOI] [PubMed] [Google Scholar]
- Brady-Kalnay SM, Tonks NK. Identification of the homophilic binding site of the receptor protein tyrosine phosphatase PTPμ. J Biol Chem. 1994;269:28472–28477. [PubMed] [Google Scholar]
- Mount SM. A catalogue of splice junction sequences. Nucleic Acids Res. 1982;10:459–472. doi: 10.1093/nar/10.2.459. [DOI] [PMC free article] [PubMed] [Google Scholar]
- Smith CWJ, Valcarcel J. Alternative pre-mRNA splicing: the logic of combinatorial control. TIBS. 2000;25:381–8. doi: 10.1016/S0968-0004(00)01604-2. [DOI] [PubMed] [Google Scholar]
- Fuchs M, Wang H, Ciossek T, Chen Z, Ullrich A. Differential expression of MAM-subfamily protein tyrosine phosphatases during mouse development. Mechanisms of Development. 1998;70:91–109. doi: 10.1016/S0925-4773(97)00179-2. [DOI] [PubMed] [Google Scholar]
- Gebbink MFBG, van Etten I, Hateboer G, Suijkerbuijk R, Beijersbergen RL, van Kessel AG, Moolenar WH. Cloning, expression, and chromosomal localization of a new putative receptor-like protein tyrosine phosphatase. FEBS Lett. 1991;290:123–130. doi: 10.1016/0014-5793(91)81241-Y. [DOI] [PubMed] [Google Scholar]
- Wang HY, Lian ZR, Lerch MM, Chen ZJ, Xie XF, Ullrich A. Characterization of PCP-2, a novel receptor protein tyrosine phosphatase of the MAM domain family. Oncogene. 1996;12:2555–2562. [PubMed] [Google Scholar]
- Cheng J, Wu K, Armanini M, O'Rourke N, Dowbenko D, Lasky LA. A novel protein tyrosine phosphatase related to the homotypically adhering κ and μ receptors. J Biol Chem. 1997;272:7264–7277. doi: 10.1074/jbc.272.11.7264. [DOI] [PubMed] [Google Scholar]
- Ono K, Suga H, Iwabe N, Kuma K, Miyata T. Multiple protein tyrosine phosphatases in sponges and explosive gene duplication in the early evolution of animals before the parazoan-eumetazoan split. J Mol Evol. 1999;48:654–62. doi: 10.1007/pl00006509. [DOI] [PubMed] [Google Scholar]
- Müller CI, Blumbach B, Krasko A, Schröder HC. Receptor protein-tyrosine phosphatases: origin of domains (catalytic domain, Ig-related domain, fibronectin type III module) based on the sequence of the sponge Geodia cydomium. Gene. 2001;262:221–230. doi: 10.1016/S0378-1119(00)00528-X. [DOI] [PubMed] [Google Scholar]
- Frumkin A, Haffner R, Shapira E, Tarcic N, Gruenbaum Y, Fainsod A. The chicken CdxA homeobox gene and axial positioning during gastrulation. Development. 1993;118:553–562. doi: 10.1242/dev.118.2.553. [DOI] [PubMed] [Google Scholar]
- Wurst W, Auerbach AB, Joyner AL. Multiple developmental defects in Engrailed-1 mutant mice: an early mid-hindbrain deletion and patterning defects in forelimbs and sternum. Development. 1994;120:2065–2075. doi: 10.1242/dev.120.7.2065. [DOI] [PubMed] [Google Scholar]
- Sosa-Pineda B, Chowdhury K, Torres M, Oliver G, Gruss P. The Pax4 gene is essential for differentiation of insulin-producing beta cells in the mammalian pancreas. Nature. 1997;386:399–402. doi: 10.1038/386399a0. [DOI] [PubMed] [Google Scholar]
- Besco JA. Genomic structure and alternative splicing of the Type R2B Receptor Protein Tyrosine Phosphatases, and the role of RPTPρ. PhD Thesis, The Ohio State University, The Ohio State Biochemistry Program. 2002.
- Dressler GR, Douglass EC. Pax-2 is a DNA-binding protein expressed in embryonic kidney and Wilms tumor. Proc Natl Acad Sci USA. 1992;89:1179–1183. doi: 10.1073/pnas.89.4.1179. [DOI] [PMC free article] [PubMed] [Google Scholar]
- O'Grady P, Krueger NX, Streuli M, Saito H. Genomic organization of the human LAR protein tyrosine phosphatase gene and alternative splicing in the extracellular fibronectin type-III domains. J Biol Chem. 1994;269:25193–25199. [PubMed] [Google Scholar]
- Honkaniemi J, Zhang JS, Yang T, Zhang C, Tisi MA, Longo FM. LAR tyrosine phosphatase receptor: proximal membrane alternative splicing is coordinated with regional expression and intraneuronal localization. Mol Brain Res. 1998;60:1–12. doi: 10.1016/S0169-328X(98)00151-X. [DOI] [PubMed] [Google Scholar]
- O'Grady P, Thai TC, Saito H. The laminin-nidogen complex is a ligand for a specific splice isoform of the transmembrane protein tyrosine phosphatase LAR. J Cell Biol. 1998;141:1675–84. doi: 10.1083/jcb.141.7.1675. [DOI] [PMC free article] [PubMed] [Google Scholar]
- Kypta RM, Su H, Reichardt LF. Association between a transmembrane protein tyrosine phosphatase and the cadherin-catenin complex. J Cell Biol. 1996;134:1519–1529. doi: 10.1083/jcb.134.6.1519. [DOI] [PMC free article] [PubMed] [Google Scholar]
- Rimm DL, Koslov ER, Kebriaei P, Cianci CD, Morrow JS. α1(E)-catenin is an actin-binding and -bundling protein mediating the attachment of F-actin to the membrane adhesion complex. Proc Natl Acad Sci USA. 1995;92:8813–7. doi: 10.1073/pnas.92.19.8813. [DOI] [PMC free article] [PubMed] [Google Scholar]
- Nagafuchi A, Takeichi M. Cell binding function of E-cadherin is regulated by the cytoplasmic domain. EMBO J. 1988;7:3679–84. doi: 10.1002/j.1460-2075.1988.tb03249.x. [DOI] [PMC free article] [PubMed] [Google Scholar]
- Burden-Gulley SM, Brady-Kalnay SM. PTPμ regulates N-cadherin-dependent neurite outgrowth. J Cell Biol. 1999;144:1323–36. doi: 10.1083/jcb.144.6.1323. [DOI] [PMC free article] [PubMed] [Google Scholar]
- Drosopoulos NE, Walsh FS, Doherty P. A soluble version of the receptor-like protein tyrosine phosphatase κ stimulates neurite outgrowth via a Grb2/MEK1-dependent signaling cascade. Mol Cell Neurosci. 1999;13:441–449. doi: 10.1006/mcne.1999.0758. [DOI] [PubMed] [Google Scholar]
- Brady-Kalnay SM, Rimm DL, Tonks NK. Receptor protein tyrosine phosphatase PTPμ associates with cadherins and catenins in vivo. J Cell Biol. 1995;130:977–86. doi: 10.1083/jcb.130.4.977. [DOI] [PMC free article] [PubMed] [Google Scholar]
- Brady-Kalnay SM, Mourton T, Nixon JP, Pietz GE, Kinch M, Chen H, Brackenbury R, Rimm DL, Del Vecchio RL, Tonks NK. Dynamic interaction of PTPμ with multiple cadherins in vivo. J Cell Biol. 1998;141:287–96. doi: 10.1083/jcb.141.1.287. [DOI] [PMC free article] [PubMed] [Google Scholar]
- Fuchs M, Muller T, Lerch MM, Ullrich A. Association of human protein-tyrosine phosphatase κ with members of the armadillo family. J Biol Chem. 1996;271:16712–9. doi: 10.1074/jbc.271.18.10588. [DOI] [PubMed] [Google Scholar]
- Yan H-E, He Y-Q, Dong H, Zhang P, Zeng J-Z, Cao H-F, Wu M-C, Wang H-Y. Physical and functional interaction between receptor-like protein tyrosine phosphatase PCP-2 and β-catenin. Biochemistry. 2002;41:15854–860. doi: 10.1021/bi026095u. [DOI] [PubMed] [Google Scholar]
- Rosdahl JA, Mourton TL, Brady-Kalnay SM. Protein kinase C δ (PKC δ) is required for protein tyrosine phosphatase in (PTPμ)-dependent neurite outgrowth. Mol Cell Neurosci. 2002;19:292–306. doi: 10.1006/mcne.2001.1071. [DOI] [PubMed] [Google Scholar]
- Rosdahl JA, Ensslen SE, Niedenthal JA, Brady-Kalnay SM. PTPμ-dependent growth cone rearrangement is regulated by Cdc42. J Neurobiol. 2003;56:199–208. doi: 10.1002/neu.10231. [DOI] [PubMed] [Google Scholar]
- Hellberg CB, Burden-Gulley SM, Pietz GE, Brady-Kalnay SM. Expression of the receptor protein-tyrosine phosphatase, PTPμ restores E-cadherin-dependent adhesion in human prostate carcinoma cells. J Biol Chem. 2002;277:11165–11173. doi: 10.1074/jbc.M112157200. [DOI] [PubMed] [Google Scholar]
- Mourton T, Hellberg CB, Burden-Gulley SM, Hinman J, Rhee A, Brady-Kalnay SM. The PTPμ protein-tyrosine phosphatase binds and recruits the scaffolding protein RACK1 to cell-cell contacts. J Biol Chem. 2001;276:14896–901. doi: 10.1074/jbc.M010823200. [DOI] [PubMed] [Google Scholar]
- http://www.ncbi.nlm.nih.gov/genome/seq/HsBlast.html
- http://www.sanger.ac.uk/HGP
- http://www.ncbi.nlm.nih.gov/IEB/Research/Ostell/Spidey
- Davuluri VR, Grosse I, Zhang MQ. Computational identification of promoters and first exons in the human genome. Nature Genetics. 2001;29:412–417. doi: 10.1038/ng780. [DOI] [PubMed] [Google Scholar]
- http://www.ncbi.nlm.nih.gov/blast/bl2seq/bl2.html
- Goessling E, Kel-Margoulis OV, Kel AE, Wingender E. In Proceedings of the German Conference on Bioinformatics (GCB2001) Braunschweig; MATCH™ – a tool for searching transcription factor binding sites in DNA sequences. Application for the analysis of human chromosomes; pp. 158–160. October 7–10, 2001. [Google Scholar]
- Bian F, Chu T, Schilling K, Oberdick J. Differential mRNA transport and the regulation of protein synthesis: Selective sensitivity of Purkinje cell dendritic mRNAs to translational inhibition. Mol Cell Neurosci. 1996;7:116–133. doi: 10.1006/mcne.1996.0009. [DOI] [PubMed] [Google Scholar]


