Abstract
Flow structures, hemodynamics and the hydrodynamic surgical pathway resistances of the final stage functional single ventricle reconstruction, namely the total cavopulmonary connection (TCPC) anatomy, have been investigated extensively. However, the second stage surgical anatomy (i.e., bi-directional Glenn or hemi-Fontan template) has received little attention. We thus initiated a multi-faceted study, involving magnetic resonance imaging (MRI), phase contrast MRI, computational and experimental fluid dynamics methodologies, focused on the second stage of the procedure. Twenty three-dimensional computer and rapid prototype models of 2nd stage TCPC anatomies were created, including idealized parametric geometries (n = 6), patient-specific anatomies (n = 7), and their virtual surgery variant (n = 7). Results in patient-specific and idealized models showed that the Glenn connection template is hemodynamically more efficient with (83% p = 0.08 in patient-specific models and 66% in idealized models) lower power losses compared to hemi-Fontan template, respectively, due to its direct end-to-side anastomosis. Among the several secondary surgical geometrical features, stenosis at the SVC anastomosis or in pulmonary branches was found to be the most critical parameter in increasing the power loss. The pouch size and flare shape were found to be less significant. Compared to the third stage surgery the hydrodynamic resistance of the 2nd stage is considerably lower (both in idealized models and in anatomical models at MRI resting conditions) for both hemi- and Glenn templates. These results can impact the surgical design and planning of the staged TCPC reconstruction.
Keywords: CFD, Patient-specific, Fontan, Congenital, Univentricular, PIV, Hemodynamics
INTRODUCTION
The incidence of children born with a single ventricle congenital heart defect in which there is only one effective pumping chamber is about 2 per 1000 births (or about 2000 in a year in the US). Surgical repairs that separate the pulmonary and systemic circuits, placing them in series with the univentricular pump, termed “Fontan Repairs,” are palliative, but unfortunately not curative30,31 and adult survivors often require a lifetime of limcited intensive medical attention.14,36
Since its introduction in 1971 by Fontan and Baudet, 13 the right heart by-pass surgeries have evolved towards better timing and design of the surgical procedure. The procedure is now typically performed in three different stages, with the first operation performed in neonates and the final stage surgery done at pediatric ages. The hydrodynamic pathway designs have evolved from the original atrio-pulmonary Fontan to the total cavopulmonary connections (TCPC) and recently the extracardiac bifurcated inferior vena cava (IVC).32,46 Based on the several clinical, in vivo and in vitro flow studies,19 two contemporary surgical templates, namely intra-atrial lateral tunnel and extra-cardiac TCPC are now the current final-stage (S3R) surgical procedures of choice.1,28,48 The hemodynamic advantage of one surgical template type over the other is a critical long-asked clinical question.11,29 However a definite conclusion is challenged due to patient-to-patient variations in congenital heart disease, univentricle heart function,50 preload, afterload, pulmonary, hepatic venous physiology, and respiratory pump. Recently through a large number of patient-specific in vitro TCPC models a statistically significant hemodynamic comparison of the intra-atrial vs. extra-cardiac TCPC templates was made possible.55 The quality of hepatic flow distribution,5 anatomical features,27 and in vivo flow structures49 also presented significant differences between these templates.
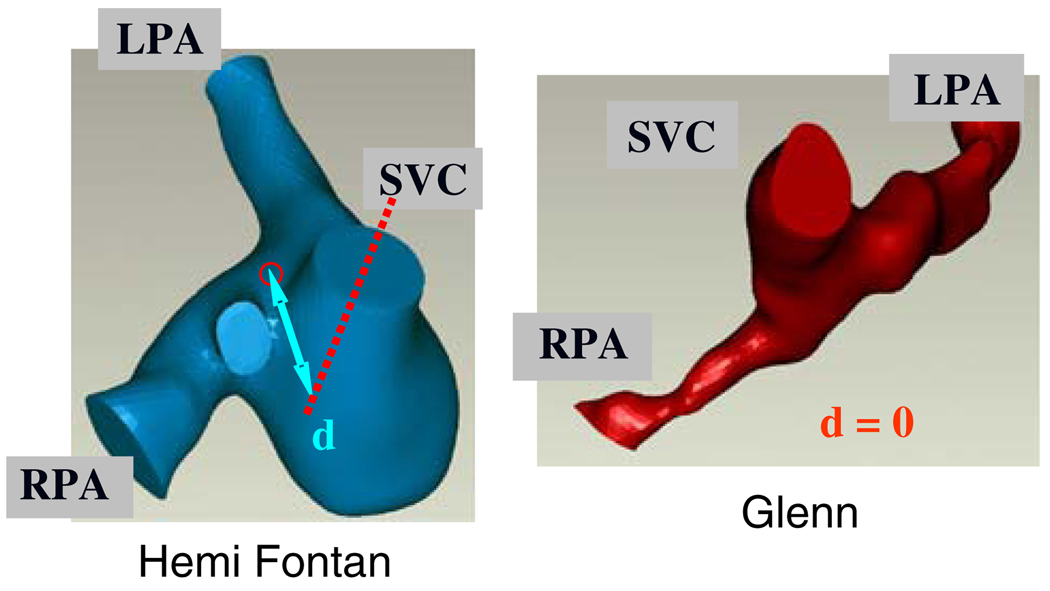
Likewise the hemodynamic basis of surgical template preference for the second stage palliation (S2R) is obscure where either a Glenn (GL)25 or a hemi-Fontan (HM)2,8,37 type SVC anastomosis is the current procedure of choice, Fig. 1. The decision of one template type over the other is mainly left to the surgeon’s discretion, which is primarily based on the former training and experience. Second stage template type is particularly critical as in all cases it poses constraints to the final-stage template as well. A hemi-Fontan connection should be followed by an intra-atrial (or lateral tunnel) type Fontan due to the placement of the atrial patch. Whereas Glenn type 2nd stage template allows both of the two contemporary options for the last stage surgery in which either an intra-atrial or an extra-cardiac type TCPC connection can be created. Second stage surgeries of bilateral SVC always require one Glenn anastomosis at the right SVC. Studies focusing the quantitative hemodynamics and comparative flow dynamics of these surgical templates are limited. To the authors knowledge Glenn and hemi-Fontan 2nd stage templates are compared only in a single study3 which favored the hemi-Fontan type connection for the 2nd stage, based on the CFD results of only a single hybrid idealized/anatomical model. Our recent cohort of multi-institute MRI NIH-congenital heart disease morphology database provided an opportunity to revisit the hemi-Fontan vs. Glenn hemodynamic performance comparison from a neutral perspective and more comprehensively using several patient-specific models.
FIGURE 1.
Typical three-dimensional patient-specific reconstructions of the hemi- and Glenn type S2R pathway templates. Superior caval offset distance is represented by d. LPA: Left pulmonary artery, RPA: Right pulmonary artery, SVC: Superior vena cava.
In order to improve the hemodynamic efficiency of the surgical repair site a large volume of modeling studies with both idealized (earlier) and patient-specific models (more recently) have been performed.7 The biggest challenge in patient-specific modeling is the coexistence of secondary morphological features (like branch stenosis, vessel volume, and pouch size) which influence the fluid flow performance and preclude any conclusions on the TCPC pathway itself. Maintaining a large sample size as employed in our recent study55 through an efficient computational pipeline4 may overcome this challenge. An alternative analysis approach is utilizing the recent “virtual” surgery tools40,41,43,47 where the influencing secondary anatomical features can be selectively removed from the 3D reconstruction and the associated changes in hemodynamics can be evaluated quantitatively.40 The present study presents the quantitative three-dimensional fluid dynamics of 2nd stage templates in multiple patient-specific models for the first time in literature. In addition, this study combines idealized parametric variations, multiple anatomical models and “virtual” surgeries, so that all available quantitative tools are employed for an unbiased conclusion.
Recent quantitative investigations on univentricle circulation using lumped parameter models highlighted the importance of venous inflow parameters on cardiac output.33,34,39 Reasons behind the chronic venous compliance remodeling (up to 400%)26 and acute post-op venous blood volume shift are clarified through these models.39 Governed by the Guytonian venous characteristics,20,21 single ventricle cardiac output is highly sensitive to the pulmonary vascular resistance (PVR),51 which is located downstream of the venous compliance. Hemodynamic influence of the TCPC surgical pathway resistance, in series to the lungs, and comparable in magnitude to the PVR (Typical values are provided in Whitehead et al.54 and Pekkan et al.39) is similar to the effect of pulmonary vascular resistance as pictured by Guyton’s isolated venous theory.21,22 Our recent calculations showed that the sensitivity of cardiac output to the pulmonary vascular resistance is −0.064 and −0.88 for normal and univentricle circulations, respectively.52 While the hydrodynamic resistance of the final stage TCPC surgery is extensively characterized in our previous studies,39,54 the second stage reconstructions have not been studied and their surgical pathway hydrodynamic resistance is still unknown. Its value relative to the PVR is important for understanding the physiology of second stage surgery, to optimize fluid flow and to highlight the physiological differences of S2R from S3R.
METHODOLOGY
Methodology employed in this work has been described extensively in our earlier publications and should be referred for details. The reader should refer Frakes et al.15–17 for anatomical segmentation and 3D reconstruction, Zelicourt et al.56 for rapid-prototyping of the physical in vitro anatomical model, Frakes et al.,18 Soerensen et al.,45 and Sundareswaran et al.49 for MRI velocity acquisition, Soerensen et al.,46 and Zelicourt et al.57,58 for in vitro tests, and Pekkan et al.,40,42 Wang et al.,53 and Whitehead et al.54 for computational fluid dynamics (CFD) modeling. Only parameters specific to the hemi- and Glenn anatomies will be presented here. Particularly the required CFD verification and validation tests for the 2nd stage anatomies are completed since the 2nd stage surgical anatomies are morphologically different than the 3rd stage TCPC (even though they bear a simpler topology, with only three branches). For CFD verification purposes secondary downstream/upstream anatomical features like distal PA bending and 3D reconstruction smoothing influencing the power loss (PL) predictions are investigated as well, and results are reported in the Appendix.
Patient-Specific Anatomies
A multi-center database of Fontan patient MRIs was established as part of an NIH funded research Grant to understand the physiology and hemodynamics the different stages of the TCPC reconstruction (n = 220 and n = 70 for S3R and S2R, respectively, as of October 2008). Informed consent was obtained and all associated studies were approved by the Institutional Review Boards of the Children’s Hospital of Philadelphia, the Children’s Healthcare of Atlanta, the University of North Carolina, and the Georgia Institute of Technology. Six S2R MRI datasets (3 from each set of hemi or Glenn reconstructions) are selected from this database, based on the following criteria: Existence of complete PC-MRI flow information, no apparent branch stenosis, relatively similar pulmonary artery cross-sectional area, similar connection volume and existence of the associated S3R MRI data set in the database (to be used in future studies). A fourth typical Glenn dataset (Database ID: CHOA013) is selected in addition to the aforedescribed set of 3 to be used in the virtual surgery suite (See section “Virtual Surgeries and Computer-aided Anatomy Editing”). This last patient features a moderate stenosis in both PA branches with a distinct bifurcating anastomosis pathway morphology.
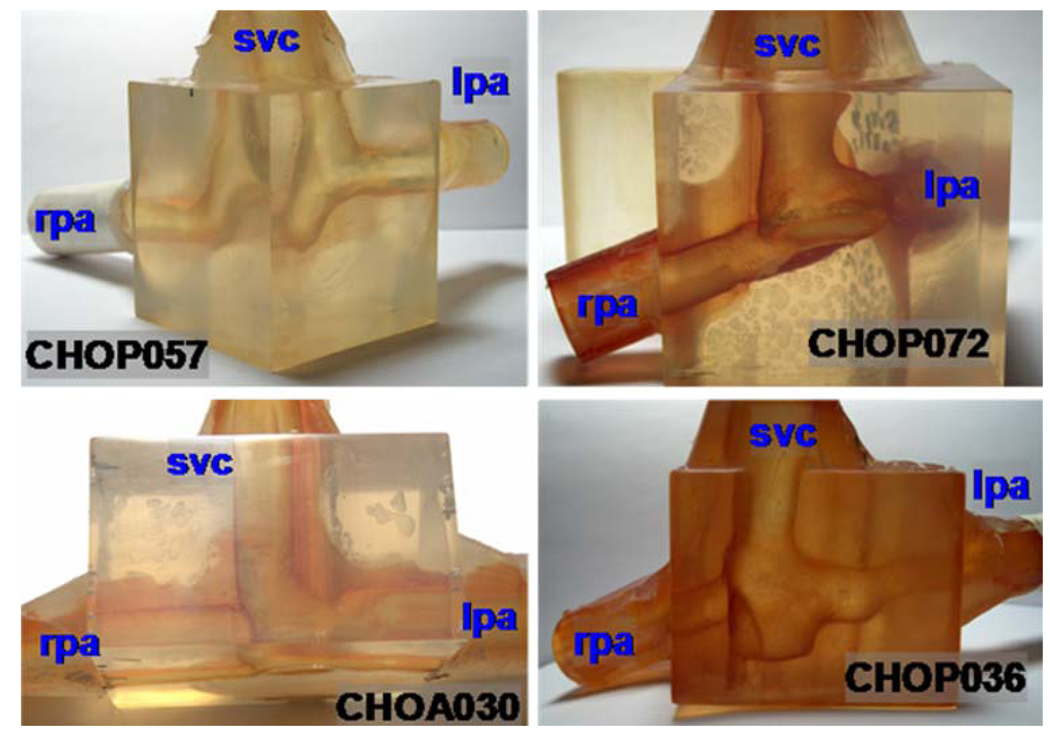
The anatomical models are obtained from the patient MRI datasets by first enhancing the out-of-plane image resolution using an adaptive control grid interpolation technique, then segmenting the vessels of interest, and finally fitting a 3D surface onto the segmented 2D cross-sections. These reconstructed 3D models can directly be used in CFD studies, and the corresponding transparent rapid prototypes are manufactured for use in the particle image velocimetry (PIV) experiments, Fig. 2.
FIGURE 2.
Photographs of the stereolithographic models used in particle image velocimetry experiments. Only 4 out of the 6 s stage patient-specific models that are analyzed are shown in this figure. Left column is Glenn template and Right column is hemi-Fontan.
Virtual Surgeries and Computer-aided Anatomy Editing
For a systematic quantitative investigation of the effects of certain anatomical surgical features (like branch stenosis, pouch size or flare) a virtual anatomy editing tool is employed.41,43,52 In its present version, this tool allows the user to free-form deform the MRI reconstructions in the computer, thus allowing the realization of “virtual” surgery concept40,58 very efficiently. Any number of 3D reconstructions (heart, aorta, veins, IVC, and 2nd stage anatomy) can be assembled together to identify surgical constraints.52 The extent of anatomical modifications performed on the patient-specific anatomies by the user are quantified by the skeletonization and geometrical characterization tools.27
Unit anatomy editing operations (changing connection shape and adding a flare) are performed in both of the 2nd stage templates (Glenn, Database ID: CHOA013 and hemi-Fontan, Database ID: CHOP036) making a total of four additional derived 3D morphologies. Whereas the effect of stenosis is studied only in the Glenn model (Database ID: CHOA013) where two RPA and one LPA stenosis are sequentially dilated in the computer (three new derived models).
PC-MRI Acquisition and Analysis
The study utilized a Siemens 1.5 Tesla whole body MRI scanner for the acquisition of patient-specific boundary conditions. Retrospectively triggered, through-plane, phase-encoded velocity mapping was performed on a plane perpendicular to the flow in the ascending aorta positioned approximately 2 mm above the aortic valve. The velocity encoding used was ±150 cm s−1. The effective repetition time was 20 ms, which yielded 30 cardiac phases, the echo time was 2.5 ms and the image matrix size was 128 × 256 pixels. The field of view was about 30 mm and a rectangular field of view was used. The slice thickness was 5 mm. The caval and pulmonary branch cross-sections were then semi-automatically segmented using a gradient based active contour scheme and flow was quantified throughout the cardiac cycle.
Idealized Models with Parametric Dimensions
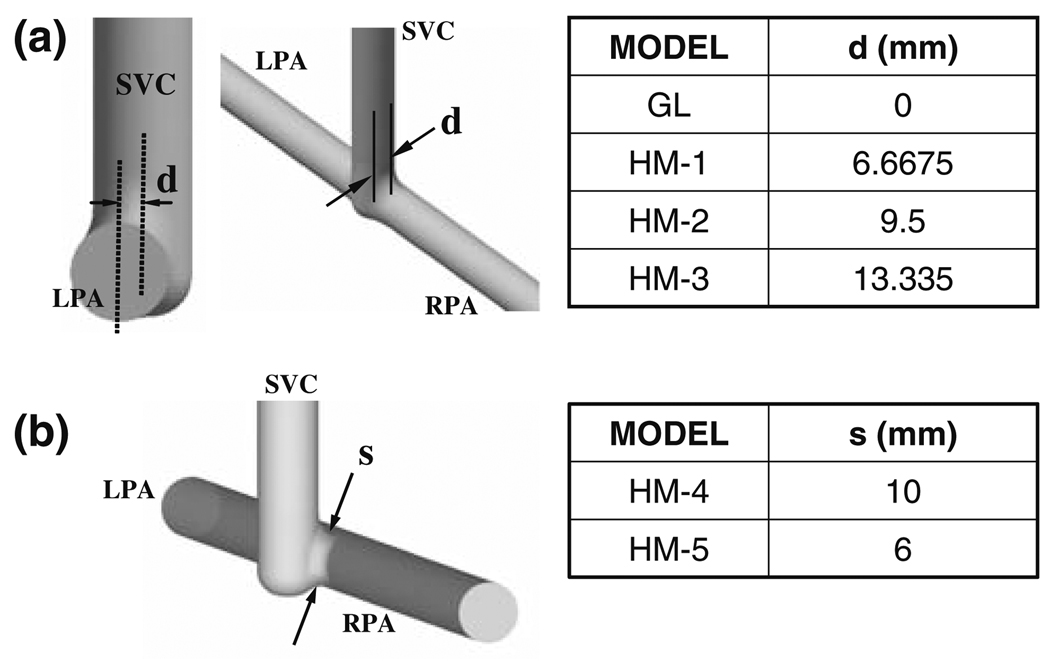
Four idealized parametric geometries models are created using the computer aided design software ProEngineer (PTC Inc., Needham, MA, USA) to investigate the effects of the anterior–posterior offset of the SVC with respect to the PA centerline, Fig. 3. All vessel diameters are set to 13.335 mm diameter so that results obtained in this study may be related to those obtained in similar parametric studies of the 3rd stage TCPC.9,10,44,46 The anterior–posterior SVC offset is uniformly varied from 0 to 13.335 mm. The zero-offset model corresponds to a typical Glenn shunt, while larger offsets are representative of hemi-Fontan geometries. Finally, a clinically significant risk (1.5%24) of generating an SVC pouch stenosis located at the side-to-side anastomosis region has been reported for larger SVC offset values. Accordingly, two idealized parametric models with varying degrees of pouch orifice cross-sectional diameter (6–10 mm), Fig. 3, are generated to study the effect of this constriction type on flow dynamics.
FIGURE 3.
Idealized 2nd stage models with the geometric dimensions and configurations studied in CFD. (a) Four models are created with varying SVC offset diameter, d as summarized in the Table. Case GL with d=0 mm approximate the Glenn configuration. Other three models correspond to hemi-Fontan with larger degree of SVC offset. In (b) variable SVC constriction (stenosis) is studied in two models which are created by reducing the SVC anastomosis pathway crosssectional area in HM-3. (HM-3 model feature the maximum possible superior caval anastomosis area).
Numerics
Grid Generation
High-quality tetrahedral grids are generated using GAMBIT (Fluent Inc., Lebanon, NH) for both idealized and anatomical models. For the baseline idealized 2nd Stage model (Model GL) and for CHOP036 computational grids with different refinement levels are created for verification purposes (sections “Idealized Models” and “Anatomical Models—Flow Structures and Power Loss”). The parameters used in grid generation, are summarized in Table 1. To achieve good convergence strict mesh quality checks are performed.
TABLE 1.
Converged grid sizes used in the CFD simulations.
| Model | Element No. | Node No. | |
|---|---|---|---|
| Idealized | GL | 406186 | 77626 |
| HM-1 | 393313 | 75513 | |
| HM-2 | 428760 | 81330 | |
| HM-3 | 435632 | 82738 | |
| HM-4 | 415339 | 79378 | |
| HM-5 | 442727 | 83981 | |
| Patient-specific | CHOP053 | 623232 | 285953 |
| CHOA030 | 203466 | 115804 | |
| CHOP057 | 534223 | 263390 | |
| CHOP046 | 318935 | 175516 | |
| CHOP072 | 462995 | 164264 | |
| CHOP036 | 330555 | 125704 |
For typical mesh sizes used sensitivity studies please refer to sections “Idealized models” and “Anatomical models—Flow structures and power loss”.
CFD Solver Settings
For all models, flow fields are computed by solving the three-dimensional steady, incompressible Navier– Stokes equations using the commercial CFD solver FIDAP (Fluent Inc., Lebanon, NH) with rigid vessel walls.54 This finite-element solver is 1st and 2nd order accurate along the streamwise and cross-stream directions, respectively. Blood is assumed incompressible and Newtonian, which is consistent with previous experimental and numerical studies (ρ= 1060 kg m−3, μ = 3:5 × 10⁻³ Pa s).
Boundary Conditions
Table 2 summarizes the boundary conditions used in CFD simulations. For all models, the inlet and outlet vessels are extended by 9-diameter beyond the section of interest. For the anatomical models, simulations are performed at the resting PC-MRI flow rates, which are specified as plug-flow velocity profiles at the inflows, and mass flow split at the outflows. In the idealized models, similar plug-flow boundary conditions are used at the inlets, while pressure boundary conditions are used at the outlets. The plug-inflow velocity profile is specified such 1.6 LPM comes from the SVC (that is to say 40%12 of a standard cardiac output value of 4 LPM40,45). Outflow velocity and pressure boundary conditions are tested and found to be equivalent in earlier studies.53 The convergence criterion was set to 10E-4 (maximum residual) for all degrees-of-freedom.
TABLE 2.
Hemodynamic parameters and power loss for the patient-specific anatomical models.
| Model ID | SVC flow (L min−1) |
%RPA flow split |
Vessel diameters
(mm) |
Maximum Reynolds number |
Connection size (10 × mm3) |
Power loss (mW) |
|||
|---|---|---|---|---|---|---|---|---|---|
| LPA | RPA | SVC | |||||||
| Glenn | CHOP053 | 0.878 | 55 | 10.3 | 13.9 | 9.8 | 243 (RSVC) | 441 | 0.136 |
| CHOA030 | 0.788 | 60 | 7.8 | 8.1 | 13.9 | 354 (RPA) | 1200 | 0.250 | |
| CHOP057 | 0.699 | 60 | 11.6 | 15.4 | 14.7 | 288 (SVC) | 1260 | 0.044 | |
| hemi | CHOP046 | 0.849 | 40 | 6.5 | 10.7 | 12.4 | 475 (LPA) | 769 | 0.622 |
| CHOP036 | 1.145 | 60 | 6.6 | 9.2 | 10.5 | 664 (SVC) | 647 | 1.450 | |
| CHOP072 | 0.918 | 60 | 15.0 | 8.4 | 9.6 | 371 (SVC) | 1050 | 0.382 | |
Maximum Reynolds number is based on vessel diameter and the corresponding vessel is also indicated in the Table. CHOP053 is a bilateral SVC model with 55/45 LSVC/RSVC flow split and 12.6 mm LSVC hydraulic diameter.
Particle Image Velocimetry
Digital particle image velocimetry experiments are conducted in two of the patient-specific geometries (1 hemi and 1 Glenn) at in vivo cardiac output and 50–50 PA splits. These experiments are conducted using a LaVision system (LaVision GmbH, Germany), including a data acquisition software package (DaVis-Flowmaster), two 17 mJ miniYag lasers (λ = 514 nm) and one camera. In order to increase image quality, the flow is seeded with fluorescent Rhodamine B particles (MF/RhB, size range: 2.5–5 µm, Microparticles GmbH, Berlin, Germany). Description of the in vitro experimental set up and measurement technique are described in earlier studies of the 3rd stage TCPC.57,58 The only notable modifications for the adaptation to 2nd stage anatomies are the elimination of vena cava (IVC) piping for all models and the addition of LSVC pipe for Chop53. The laser sheet optical pathway mechanism is also redesigned so that it can be traversed throughout the model more efficiently.
RESULTS
Idealized Models
For the idealized geometries, a grid verification study is performed in the idealized Glenn anatomy using four different grid (computational mesh) densities (79929, 242070, 406186, and 553686 elements). Flow fields for all models are qualitatively similar. Results demonstrate a 14.8, 9.5, and 1.4% difference in power loss compared to the finest grid size model, respectively. The mesh density corresponding to the 406186 elements (resulting 1.4% difference) is maintained in all idealized models.
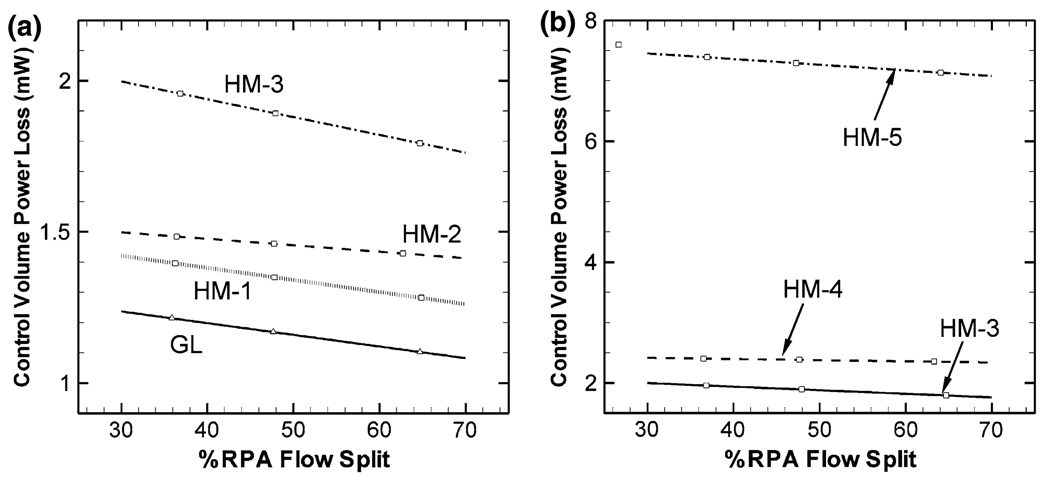
Hydrodynamic power loss values at different pulmonary flow splits are calculated from the CFD results for all idealized models and plotted in Figs. 4a and 4b. The hydrodynamic power loss of model GL is lower for all the hemi-Fontan models. Larger SVC offsets increase the power loss even further. The GL model power loss is 16, 26, and 62% lower compared to HM-1, HM-2, and HM-3, respectively (the three hemi-Fontan models with different degrees of SVC offset). Compared to the earlier power loss results of the idealized third stage one-diameter-offset TCPC model (~5.6 mW),9,40 second stage power losses are considerably lower (~1.9 mW for HM-3) (~66% lower for HM-3).
FIGURE 4.
Power loss characteristics of the idealized S2R models at different right pulmonary artery splits (% RPA). Superior vena cava (SVC) flow rate is 1.6 LPM for all models. Effect of SVC offset and SVC anastomosis narrowing is compared in (a) and (b), respectively.
Effect of anastomosis stenosis on hydrodynamic power loss is presented in Fig. 4b. Hydrodynamic power loss is significantly more sensitive to the anastomosis stenosis than to the SVC offset parameter. Larger stenosis diameters cause considerably larger power losses in the second stage cavopulmonary connection, Fig. 4b (1.9, 2.4, and 7.3 mW for HM-3, HM-5, and HM-6, respectively).
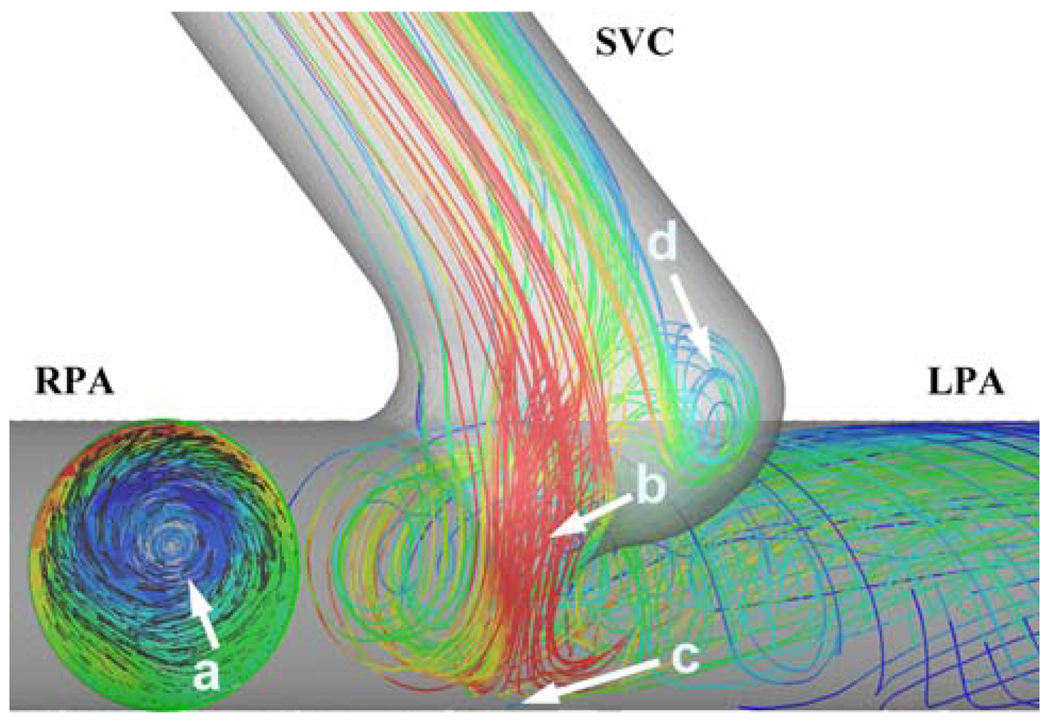
At the pulmonary branches swirling flow is observed in all models, Fig. 5. Unlike the PA swirl characteristics of the final stage TCPC, the second stage has only a single swirl structure (vortex) at each PA. A relatively minor swirling flow structure at the pouch region is also noticed. SVC anastomosis creates jet-like flow in the connection which stagnates and bifurcates at the PA lateral wall, Fig. 5.
FIGURE 5.
Major flow structures in the idealized 2nd stage models. The CFD model is viewed from the inferior direction. (a) Flow swirl structure at the LPA (colors indicate through plane vorticity magnitude, red color: 89 s−1 red color: 247 s−1). (b) SVC jet through the anastomosis. (c) Stagnation region of the SVC jet. (d) Pouch vortex. Only the streamlines going to the left lung are plotted for better clarification of the flow structures. Colors of the streamlines correspond to velocity magnitude, red: high velocity (0.5 m s−1) and blue low velocity (0.03 m s−1).
Experimental Validation
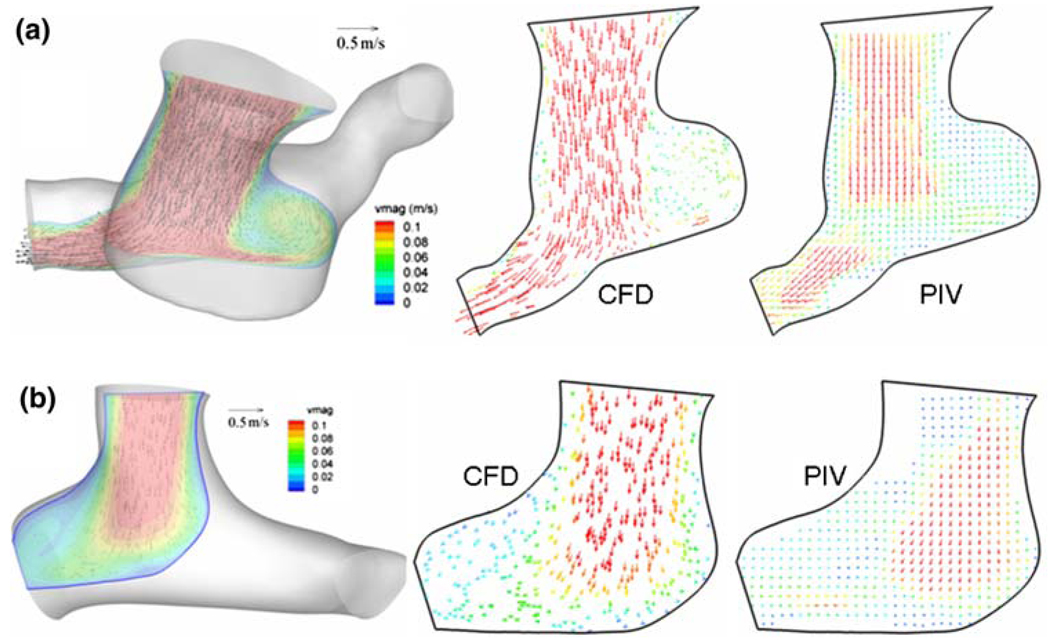
Experimental validation of the second stage TCPC CFD model for the patient-specific anatomical models is an essential task and performed by comparing flow fields obtained from CFD and particle image velocimetry. Figures 6a and 6b show the comparison of computed vector fields with the measured velocity field using PIV in one slice of hemi (CHOP072) and Glenn (CHOP057) model, respectively. As seen, the computational scheme successfully captures the topology of flow structures through both these models. However, we acknowledge here a mismatch between velocity magnitudes in certain regions of the measurement plane and attribute this some missing flow vectors in the experimental PIV flow fields due to poor laser illumination and to the fully developed forcing at the inlets of these models in the computational scheme. Inflow velocity profiles are very difficult to control experimentally due to small vessel sizes and circular pipe connections. Hence, despite a pipe entrancelength designed to ensure fully developed inflow in the experiments, the measured flow fields demonstrate otherwise, which may explain the slight discrepancy in velocity magnitude.
FIGURE 6.
CFD and PIV flow-fields along a typical section (registered on the 3D anatomy on the left) computed from CFD and measured using particle image velocimetry (PIV), (a) for the hemi-Fontan and (b) for the Glenn model.
Anatomical Models—Flow Structures and Power Loss
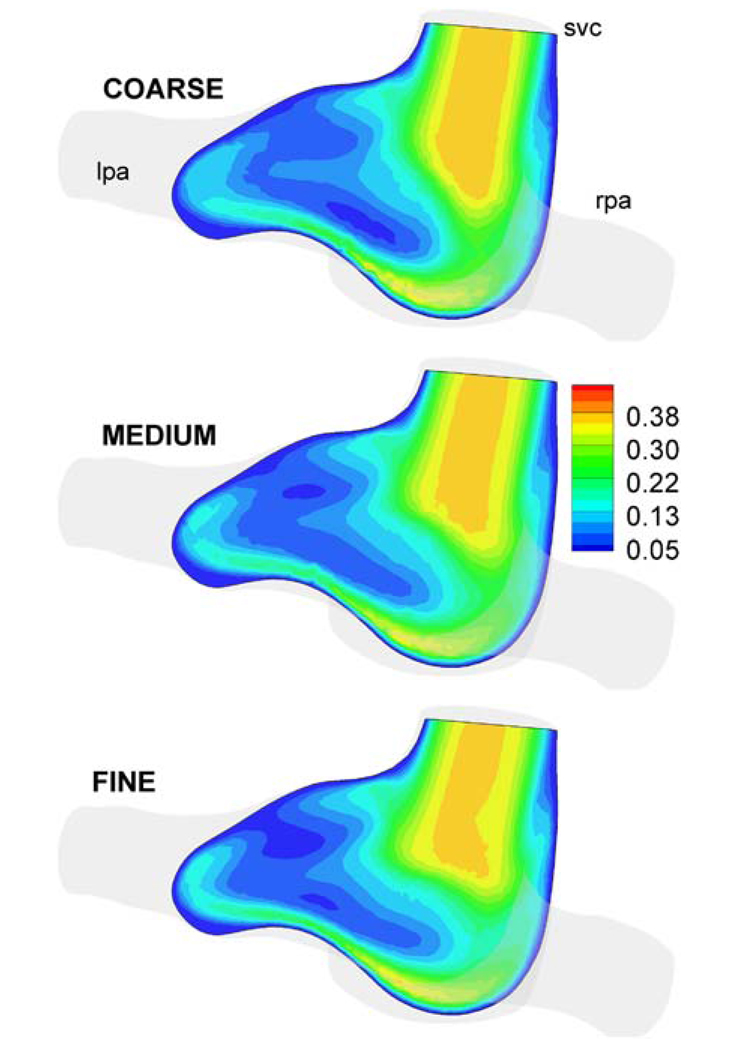
Similarly to the idealized geometries, a grid verification study is performed for anatomical geometries. Three different grid sizes (133936, 232036, and 330555 elements) are generated for a hemi-Fontan model (Database ID: CHOP036). Results show a 3.4 and 1.5% difference in power loss compared to the finest grid size, respectively. The velocity magnitude is integrated over the slices shown in Fig. 7, which demonstrates a 3.2 and 1.3% difference for coarse and medium grids, respectively, compared to the finest grid computations. All simulations in the anatomical configurations are thus conducted using a mesh spacing equivalent to that of the medium grid.
FIGURE 7.
Velocity magnitude (m s−1) in a typical section of the hemi-Fontan model (Database ID: CHOP036) for three different mesh refinements. COARSE: 133936, MEDIUM: 232036, and FINE: 330555 mesh sizes.
For the six 2nd stage patient-specific models the calculated power loss values are tabulated in Table 2 with other major determinants of power loss (PA diameter, model size, SVC flow rate). Average power loss for the three Glenn models is 83% lower than for the three hemi-Fontan models. This difference is near significance (p-value of 0.08) considering such a low sample size and the inclusion of a bilateral model. The test used was 2-sample unpaired Mann Whitney Nonparametric Test. The same test for the other major determinants like RPA diameter Glenn vs. RPA diameter hemi-Fontan gives a p value of 1.0.
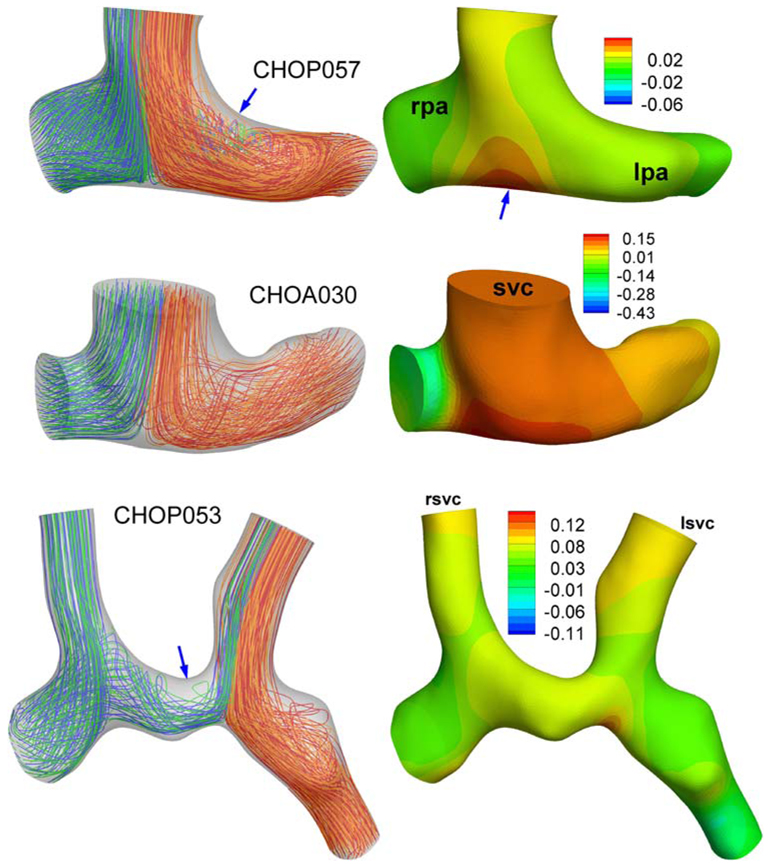
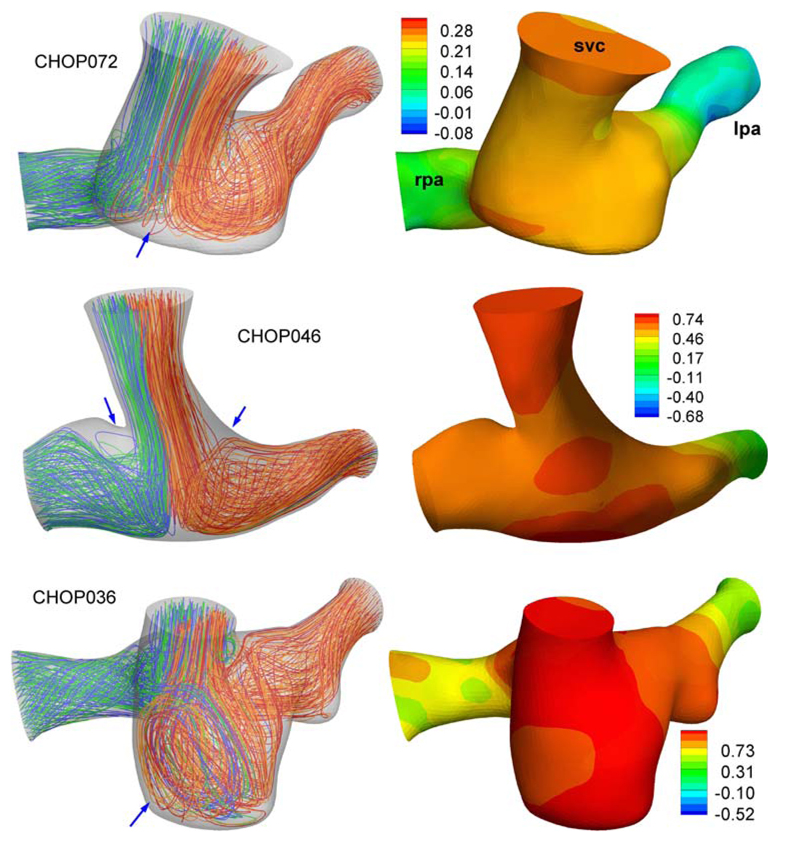
We have visualized the pressure and flow fields in Glenn and hemi-Fontan models with alternating color streamline technique (Supplementary Material of Whitehead54) in Fig. 8 and Fig. 9, respectively. Flow fields in Glenn models are found to be more uniform and bifurcated without any recirculation to the pulmonary arteries. The only exception is CHOP057 where the RPA stream goes into the LPA branch before flowing back to the left lung. Hemi-Fontan models with large pouches feature very complex swirling flow structures at the connection and in both PA (preferably at LPA) branches, Fig. 9. Well-defined stagnation flow pressure fields, with increasing pressure values at the connection region are observed in Glenn models, Fig. 8 (This potential energy is converted to the kinetic energy in the accelerating PA flow). Pressure drop in hemi-Fontan models are larger compared to the Glenn models.
FIGURE 8.
Flow streamlines (Left) and pressure distribution (Right) of Glenn models. SVC: Superior vena cava, LPA: Left pulmonary artery, RPA: Right pulmonary artery. Pressures are in mmHg and measured with respect to the LPA outlet. LPA streamlines are marked with alternating colors of blue-green and RPA streamlines are marked with orange-red. Blue arrows indicate major flow structures as discussed in section “Anatomical models—Flow structures and power loss”.
FIGURE 9.
Flow streamlines (Left) and pressure distribution (Right) of hemi-Fontan models. SVC: Superior vena cava, LPA: Left pulmonary artery, RPA: Right pulmonary artery. Pressures are in mmHg and measured with respect to the LPA outlet. LPA streamlines are marked with alternating colors of blue-green and RPA streamlines are marked with orange-red. Blue arrows indicate major flow structures as discussed in section “Anatomical models—Flow structures and power loss”.
Relative Influence of Morphological Features
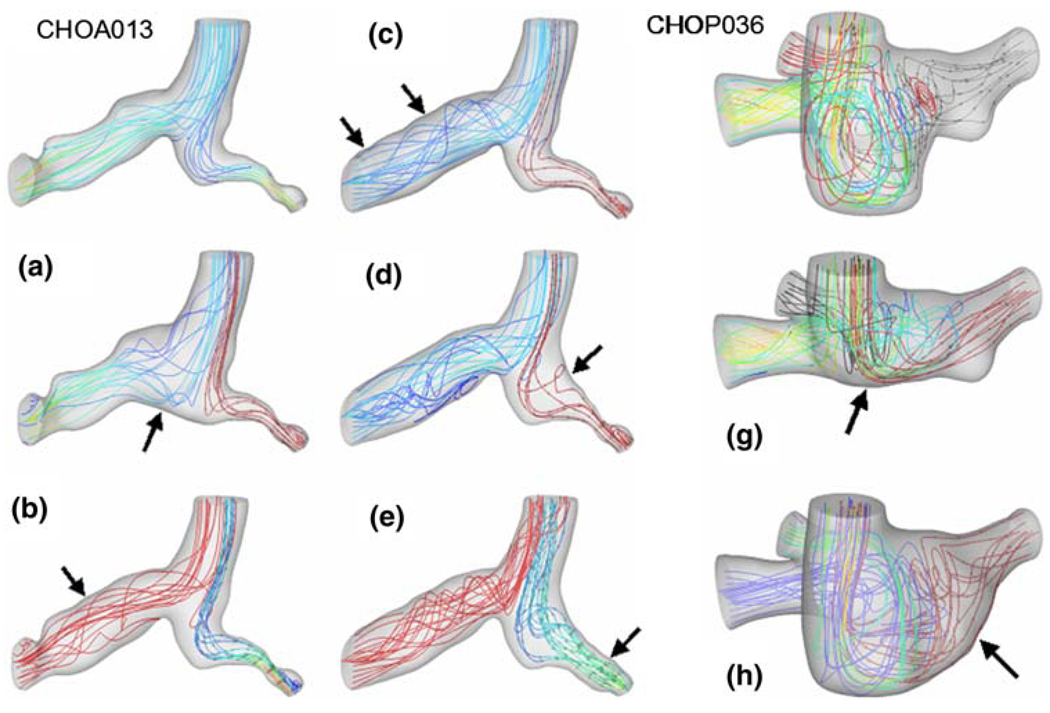
For the original and “virtual” anatomies, calculated three-dimensional flow streamlines are plotted in Fig. 10. The original hemi-Fontan and Glenn models used in this study are CHOP036 and CHOA013, respectively. In spite of the differences in flow streamlines, virtual modifications of the connection region produced little variation in hydrodynamic power loss for both Glenn (CHOA013 to Model-A in Fig. 10) and hemi-Fontan templates (CHOP036 to Model-G in Fig. 10). Creating a flatter PA bifurcation (larger connection size) in the Glenn model (Model-A) produced 8.6% decrease in the power loss, while pouch size reduction (Model-G) produced only 6.6% increase in average power loss in the hemi-Fontan model. Addition of a large virtual LPA flare to both hemi-Fontan (CHOP036 to Model-H in Fig. 10) and Glenn models (Model-C to Model-D in Fig. 10) produced insignificant changes in the power loss characteristics.
FIGURE 10.
“Virtual” surgeries exploring the effects of anatomical features selectively. Left: Glenn model (NIH Database ID: CHOA013) where three PA stenosis are removed (Model C, B, and E), anastomosis is enlarged with a patch (Model A) and RPA flare added (Model E) to the original anatomy. Right: Three virtual modifications performed on the hemi-Fontan anatomy (NIH Database ID: CHOP036) where the pouch size is reduced (Model G) and LPA flare is added (Model H) to the original anatomy.
On the other hand, significant differences in power loss values are observed when progressively dilating the branch stenoses present in the Glenn (CHOA013). CHOA013 featured two RPA and one LPA branch stenoses, which are virtually dilated one-by-one. Proximal RPA stenosis dilation (Model-A to Model-B in Fig. 10) results in a 13% decrease in average power loss values, while distal RPA stenosis dilation (Model-B to Model-C in Fig. 10) and discrete LPA stenosis dilation (Model-D to Model-E in Fig. 10) yield an additional 34 and 70% decrease, respectively.
DISCUSSION
The present study reports a large-scale modeling attempt involving 18 different patient-specific S2R morphologies and 6 idealized models to quantify the hemodynamic differences between hemi- and Glenn type surgical pathways. This study contributes to the earlier understanding that was based on a single idealized/anatomical model.23 Using a large number of anatomical models and the recent virtual “anatomy editing” tool the significant hemodynamic differences between the two surgical pathways and the sensitivity of hydrodynamic performance to the major anatomical features are quantified. Among the pouch shape, flare size, caval confluence, PA bifurcation, and branch diameters, the last two geometrical features are found to be most significant in influencing the hydrodynamic loss. The importance of 3D caval inlet orientation have been highlighted extensively in the earlier reports for S3R and are found to be equally important for S2R. Effect of 3D reconstruction smoothing in relatively smaller S2R models compared to the S3R on the power loss results of the S2R is also visited in the Appendix for verification purposes.
The “most optimal” S3R pathway design that can be realized is different for the hemi- and Glenn type anastomosis and requires an extensive modeling study involving pre- and post-op MRI scans of several patients. While detailed pre- and post-power loss studies with patient-specific models are underway, for the present idealized S2R models we completed the Fontan palliation in the computer and verified that the SVC offset of the hemi-Fontan template results an increased power loss at S3R as well with similar percentage. However, S3R introduces additional secondary influencing factors6 and therefore we strongly believe that optimization studies should be customized for each patient based on the preoperative MRI anatomy via the CFD tools.
In spite of being a temporary time-point in staged palliation, hydrodynamic performance at the 2nd stage post-op is critical for understanding the physiology of the univentricular circulation. Characteristics of the pathway hemodynamics at this stage will provide important data for lumped parameter models, single ventricle heart function and PA growth studies. Due to the unaltered inferior venous return the effect of hydrodynamic power loss on cardiac output at this stage should be relatively minor. Studies that target further improvements should focus on SVC venous return and head-neck perfusion balance. Likewise for a typical leg exercise pattern (only increasing the IVC flow rate), the S2R pathway resistance is less significant for the exercise performance compared to the lower oxygen saturation of second stage. The pathway resistance values for the S2R are found to be considerably lower compared to the typical values of the S3R. This is mostly attributable to the lower cardiac output that runs through the S2R surgical pathway (SVC return in the idealized models were kept higher in this study (1.6LPM) compared to the anatomical set (~1LPM) to be compatible with the earlier S3R onediameter offset idealized model studies). Power loss variation for different PA splits for S2R was also found to be flatter compared to the S3R characteristics. These results enable quantitative comparison of the hydrodynamic factors as a major determinant of the single ventricle physiology.
A few limitations of this in vitro study should be mentioned. First, this study was conducted using steady inflow conditions. Changing the inflow conditions to unsteady patient-specific ones will most likely alter the observed flow structures and associated power losses. Variation of power loss over the cardiac cycle is critical. However for the S2R stage, having a single SVC inlet, the mean flow is adequate for comparing the hydrodynamic performance at different timepoints. Factors such as the intra-thoracic pressure variations due to breathing, diaphragm and heart motion, which are known to induce significant unsteadiness into the single-ventricle venous flow, should ultimately be alleviated. For example, detailed pulmonary characteristics can be modeled giving the information at a single pulmonary split, while the present analysis methodology quantifies the pathway performance for multiple PA split conditions. In addition, this study assumes the vessel walls to be rigid. Numerical simulations with flexible walls have recently been presented by Masters et al.35 and DeGroff and coworkers38 for idealized TCPC geometries. However, relieving these assumptions in patient-specific geometries will require the development of fast 3D reconstruction algorithms that spans all CMRI phases and high-resolution CFD solvers which are ongoing and planed for future communications.
CONCLUSIONS
This study investigated the pathway hemodynamics of two contemporary second stage palliation templates (Glenn and hemi-Fontan) through multiple quantitative analysis tools (idealized models, patient-specific models, virtual surgeries and experimental fluid dynamics). Due to the lower total flow rate traversing the connection, the hydrodynamic power loss of both second stage templates is considerably lower than the final completed TCPC. Comparative and parametric analyses of the two templates demonstrate more favorable hemodynamics and 3D fluid dynamic performance in Glenn type anastomosis than in hemi-Fontans. However, it should be kept in mind that other clinical factors and surgeons/cardiologists judgment based on the condition of individual patient are equally important for deciding the best template and achieving optimal outcome. The clinical validation of one template over the other is challenging and will ultimately require prospective testing in Fontan patients.
ACKNOWLEDGMENTS
This work was supported by a grant from the National Heart, Lung, and Blood Institute, HL67622. We also acknowledge Dr. Dave Frakes for providing the ACGI technology and Dr. Hiroumi Kitajima for processing the patient MRI datasets. Experimental and computational studies were made possible by the help of our brilliant undergraduate students: Vasu Yernini, Maria Restrepo, Kiyu Kim, and Quantez Freeman.
APPENDIX
Effects of Secondary Morphological Features on Hydrodynamic Power Loss
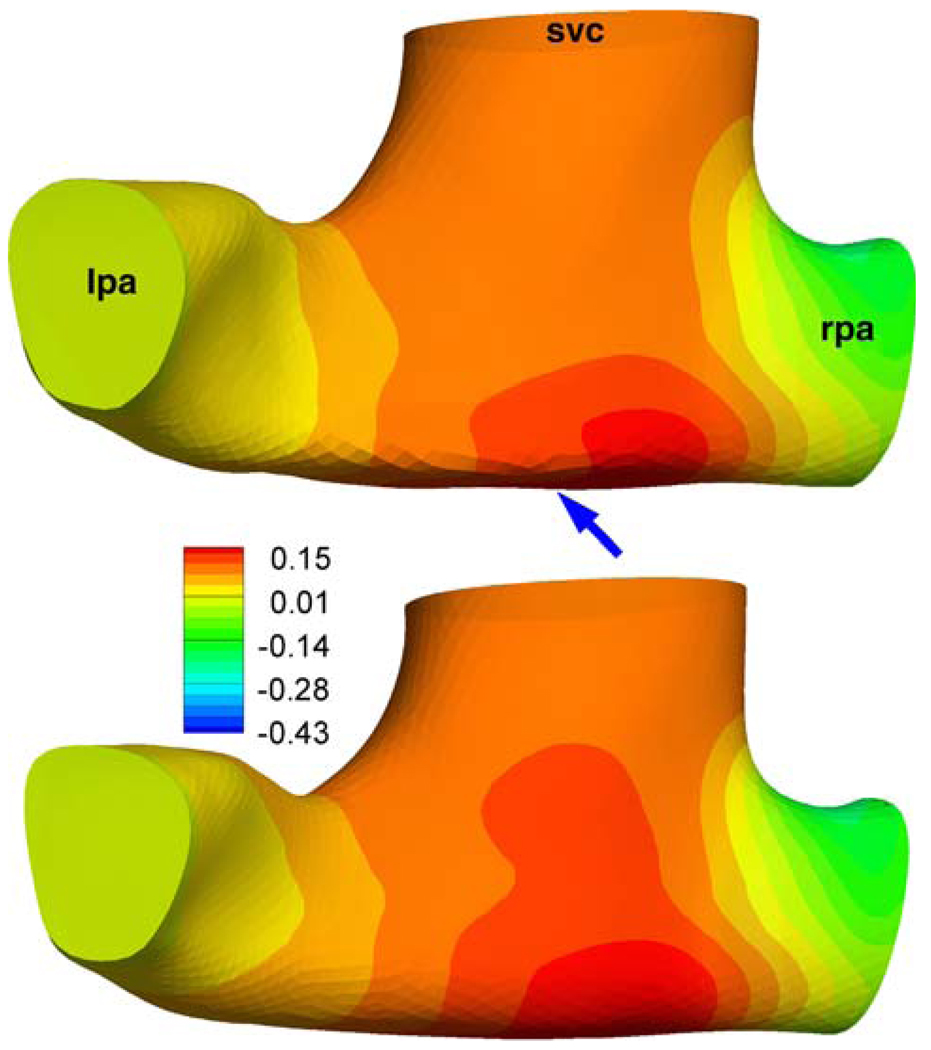
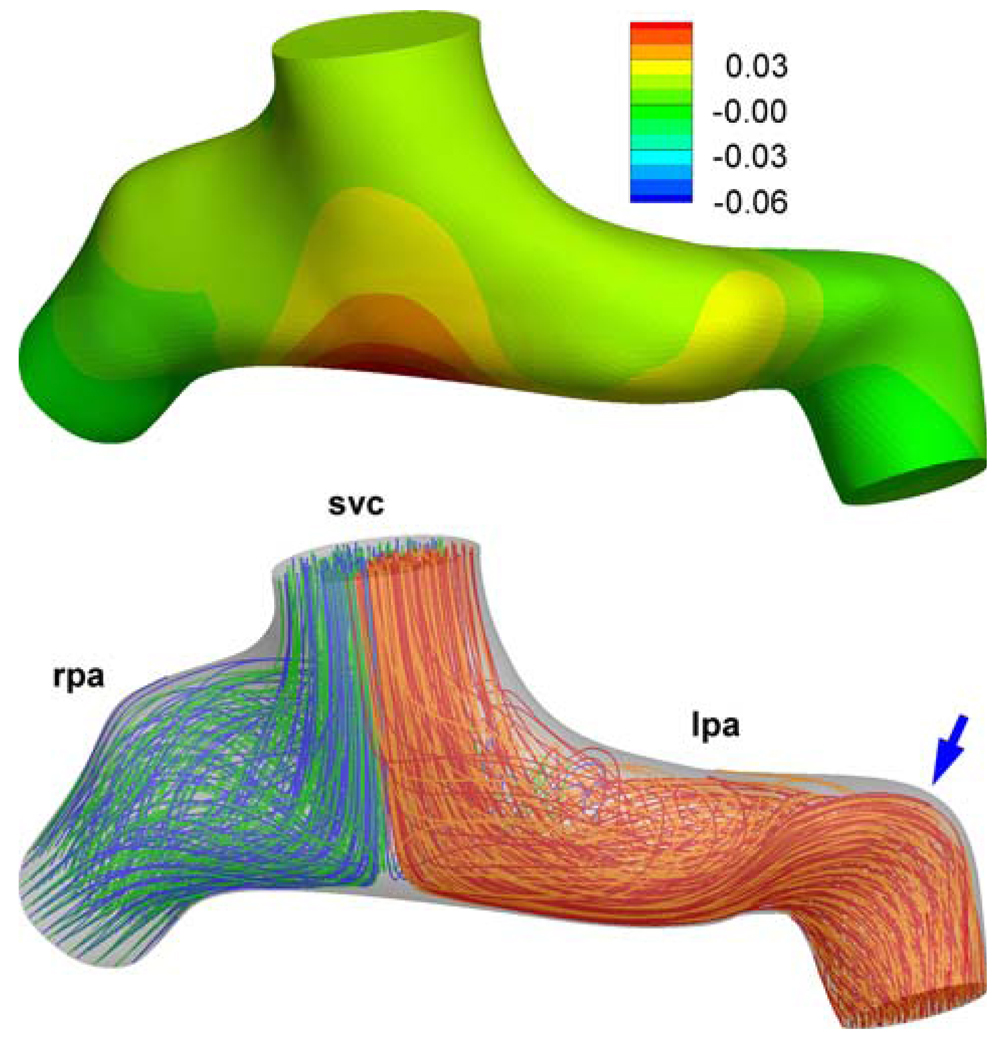
The effects of secondary and peripheral anatomical features on the computed TCPC power loss values (S3R) have been well established in the earlier verification studies. This communication is an appropriate place to summarize these briefly for the S2R. These factors should influence the computed fluid dynamics of both Glenn and hemi-Fontan models more-or-less in the same magnitude thus should not influence the stated conclusions of this manuscript. The effect of the extra 3D reconstruction smoothing has studied in the Glenn model (CHOA030), Fig. A1. Calculated power loss values are −0.250 mW and −0.277 mW with our standard reconstruction protocol and with the extra surface smoothed model, respectively. The effect of PA branch length and proximal bending is studied in another Glenn model (CHOP057), Fig. A2. As expected the PA bending increased the power loss values from 0.044 mW to 0.045 mW which was negligible for this configuration. For all other models morphology of the PA branches are relatively straight with gentler radii of curvature.
FIGURE A1.
Effect of extra smoothing on the pressure distribution (mmHg) for a Glenn model (Database ID: CHOA030). Top: is the 3D reconstruction from the standard methodology (For the coronal view please refer to Fig. 8). Bottom: Over smoothed model, see arrow. No major differences were apparent in the streamline patterns of these two models.
FIGURE A2.
Effect of distal PA morphology (arrow) on the computed flow fields and pressure drop (mmHg). For the model with a straight PA please refer to Fig. 8. (Database ID:Chop057).
REFERENCES
- 1.Azakie A, McCrindle BW, Van Arsdell G, Benson LN, Coles J, Hamilton R, Freedom RM, Williams WG. Extracardiac conduit versus lateral tunnel cavopulmonary connections at a single institution: impact on outcomes. J. Thorac. Cardiovasc. Surg. 2001;122(6):1219–1228. doi: 10.1067/mtc.2001.116947. doi: 10.1067/mtc.2001.116947. [DOI] [PubMed] [Google Scholar]
- 2.Bando K, Turrentine MW, Park HJ, Sharp TG, Scavo V, Brown JW. Evolution of the Fontan procedure in a single center. Ann. Thorac. Surg. 2000;69(1873–9) doi: 10.1016/s0003-4975(00)01316-3. doi: 10.1016/S0003-4975(00)01316-3. [DOI] [PubMed] [Google Scholar]
- 3.Bove EL, de Leval MR, Migliavacca F, Guadagni G, Dubini G. Computational fluid dynamics in the evaluation of hemodynamic performance of cavopulmonary connections after the Norwood procedure for hypoplastic left heart syndrome. J. Thorac. Cardiovasc. Surg. 2003;126(4):1040–1047. doi: 10.1016/s0022-5223(03)00698-6. doi: 10.1016/S0022-5223(03)00698-6. [DOI] [PubMed] [Google Scholar]
- 4.Cebral JR, Castro MA, Burgess JE, Pergolizzi RS, Sheridan MJ, Putman CM. Characterization of cerebral aneurysms for assessing risk of rupture by using patient-specific computational hemodynamics models. Am. J. Neuroradiol. 2005;26(10):2550–2559. [PMC free article] [PubMed] [Google Scholar]
- 5.Dasi LP, Pekkan K, Whitehead K, Fogel M, Yoganathan AP. Hepatic blood flow distribution in the total cavopulmonary connection: patient-specific anatomical models. ASME 2007 Summer Bioengineering Conference (SBC2007), P. o. t. ASME; Keystone Resort & Conference Center; Keystone, Colorado. 2007. edited by. [Google Scholar]
- 6.Dasi LP, Pekkan K, Katajima HD, Yoganathan AP. Functional analysis of Fontan energy dissipation. J. Biomech. 2008;41(10):2246–2252. doi: 10.1016/j.jbiomech.2008.04.011. [DOI] [PMC free article] [PubMed] [Google Scholar]
- 7.Degroff CG. Modeling the Fontan circulation: where we are and where we need to go. Pediatr. Cardiol. 2008;29(1):3–12. doi: 10.1007/s00246-007-9104-0. [DOI] [PubMed] [Google Scholar]
- 8.Douglas WI, Goldberg CS, Mosca RS, Law IH, Bove EL. Hemi-Fontan procedure for hypoplastic left heart syndrome: outcome and suitability for Fontan. Ann. Thorac. Surg. 1999;68:1361–1368. doi: 10.1016/s0003-4975(99)00915-7. doi: 10.1016/S0003-4975(99)00915-7. [DOI] [PubMed] [Google Scholar]
- 9.Ensley AE, Lynch P, Chatzimavroudis GP, Lucas C, Sharma S, Yoganathan AP. Toward designing the optimal total cavopulmonary connection: an in vitro study. Ann. Thorac. Surg. 1999;68(4):1384–1390. doi: 10.1016/s0003-4975(99)00560-3. doi: 10.1016/ S0003-4975(99)00560-3. [DOI] [PubMed] [Google Scholar]
- 10.Ensley AE, Ramuzat A, Healy TM, Chatzimavroudis GP, Lucas C, Sharma S, Pettigrew R, Yoganathan AP. Fluid mechanic assessment of the total cavopulmonary connection using magnetic resonance phase velocity mapping and digital particle image velocimetry. Ann. Biomed. Eng. 2000;28(10):1172–1183. doi: 10.1114/1.1317533. doi: 10.1114/1.1317533. [DOI] [PubMed] [Google Scholar]
- 11.Fiore AC, Turrentine M, Rodefeld M, Vijay P, Schwartz TL, Virgo KS, Fischer LK, Brown JW. Fontan operation: a comparison of lateral tunnel with extracardiac conduit. Ann. Thorac. Surg. 2007;83:622–630. doi: 10.1016/j.athoracsur.2006.09.070. doi: 10.1016/j.athoracsur.2006.09.070. [DOI] [PubMed] [Google Scholar]
- 12.Fogel MA, Weinberg PM, Rychik J, Hubbard A, Jacobs M, Spray TL, Haselgrove J. Caval contribution to flow in the branch pulmonary arteries of Fontan patients with a novel application of magnetic resonance presaturation pulse. Circulation. 1999;99(9):1215–1221. doi: 10.1161/01.cir.99.9.1215. [DOI] [PubMed] [Google Scholar]
- 13.Fontan F, Baudet E. Surgical repair of tricuspid atresia. Thorax. 1971;26(3):240–248. doi: 10.1136/thx.26.3.240. [DOI] [PMC free article] [PubMed] [Google Scholar]
- 14.Fontan F, Kirklin JW, Fernandez G, Costa F, Naftel DC, Tritto F, Blackstone EH. Outcome after a “perfect“ Fontan operation. Circulation. 1990;81(5):1520–1536. doi: 10.1161/01.cir.81.5.1520. [DOI] [PubMed] [Google Scholar]
- 15.Frakes DH, Conrad CP, Healy TM, Monaco JW, Fogel M, Sharma S, Smith MJ, Yoganathan AP. Application of an adaptive control grid interpolation technique to morphological vascular reconstruction. IEEE. Trans. Biomed. Eng. 2003;50(2):197–206. doi: 10.1109/TBME.2002.807651. doi: 10.1109/TBME.2002.807651. [DOI] [PubMed] [Google Scholar]
- 16.Frakes DH, Dasi LP, Pekkan K, Kitajima HD, Sundareswaran K, Yoganathan AP, Smith MJ. A new method for registration-based medical image interpolation. IEEE Trans. Med. Imaging. 2008;27(3):370–377. doi: 10.1109/TMI.2007.907324. [DOI] [PubMed] [Google Scholar]
- 17.Frakes DH, Smith MJ, Parks J, Sharma S, Fogel SM, Yoganathan AP. New techniques for the reconstruction of complex vascular anatomies from MRI images. J. Cardiovasc. Magn. Reson. 2005;7(2):425–432. doi: 10.1081/jcmr-200053637. doi: 10.1081/JCMR-200053637. [DOI] [PubMed] [Google Scholar]
- 18.Frakes D, Smith MJT, Zelicourt D, Pekkan K, Yoganathan AP. Three-dimensional velocity field reconstruction. J. Biomech. Eng. 2004;126(6):727–735. doi: 10.1115/1.1824117. doi: 10.1115/1.1824117. [DOI] [PubMed] [Google Scholar]
- 19.Giroud JM, Jacobs JP. Fontan’s operation: evolution from a procedure to a process. Cardiol. Young. 2006;16(Suppl 1):67–71. doi: 10.1017/S1047951105002350. doi: 10.1017/S1047951105002350. [DOI] [PubMed] [Google Scholar]
- 20.Guyton AC, editor. Cardiac Output and Venous Return, and Their Regulation. Philadelphia, PA: Saunders; 1961. [Google Scholar]
- 21.Guyton AC, Abernathy B, Langston JB, Kaufmann BN, Fairchild HM. Relative importance of venous and arterial resistances in controlling venous return and cardiac output. Am. J. Physiol. 1959;196(5):1008–1014. doi: 10.1152/ajplegacy.1959.196.5.1008. [DOI] [PubMed] [Google Scholar]
- 22.Guyton AC, Lindsey AW, Kaufmann BN. Effect of mean circulatory filling pressure and other peripheral circulatory factors on cardiac output. Am. J. Physiol. 1955;180(3):463–468. doi: 10.1152/ajplegacy.1955.180.3.463. [DOI] [PubMed] [Google Scholar]
- 23.Hirsch JC, Ohye RG, Devaney EJ, Goldberg CS, Bove EL. The lateral tunnel fontan procedure for hypoplastic left heart syndrome: results of 100 consecutive patients. Pediatr. Cardiol. 2007;28:426–432. doi: 10.1007/s00246-007-9002-5. [DOI] [PubMed] [Google Scholar]
- 24.Hosein RB, Clarke AJ, McGuirk SP, Griselli M, Stumper O, De Giovanni JV, Barron DJ, Brawn WJ. Factors influencing early and late outcome following the Fontan procedure in the current era. The ‘Two Commandments’? Eur. J. Cardiothorac. Surg. 2007;31(3):344–352. doi: 10.1016/j.ejcts.2006.11.043. doi: 10.1016/j.ejcts.2006.11.043; discussion 353. [DOI] [PubMed] [Google Scholar]
- 25.Kaulitz R, Hofbeck M. Current treatment and prognosis in children with functionally univentricular hearts. Arch. Dis. Child. 2005;90:757–762. doi: 10.1136/adc.2003.034090. doi: 10.1136/adc.2003.034090. [DOI] [PMC free article] [PubMed] [Google Scholar]
- 26.Kelly JR, Mack GW, Fahey JT. Diminished venous vascular capacitance in patients with univentricular hearts after the Fontan operation. Am. J. Cardiol. 1995;76:158–163. doi: 10.1016/s0002-9149(99)80049-6. doi: 10.1016/S0002-9149(99)80049-6. [DOI] [PubMed] [Google Scholar]
- 27.Krishnankuttyrema R, Dasi L, Pekkan K, Sundareswaran K, Kitajima H, Yoganathan AP. A unidimensional representation of the total cavopulmonary connection. ASME 2007 Summer Bioengineering Conference (SBC2007), P. o. t. ASME; Keystone Resort & Conference Center; Keystone, Colorado. 2007. edited by. [Google Scholar]
- 28.Kumar SP, Rubinstein CS, Simsic JM, Taylor AB, Saul JP, Bradley SM. Lateral tunnel versus extracardiac conduit fontan procedure: a concurrent comparison. Ann. Thorac. Surg. 2003;76(5):1389–1397. doi: 10.1016/s0003-4975(03)01010-5. doi: 10.1016/S0003-4975(03)01010-5. [DOI] [PubMed] [Google Scholar]
- 29.Lee JR, Kwak JG, Kim KJ, Min SK, Kim W, Kim YJ, Rhoa JR. Comparison of lateral tunnel and extracardiac conduit Fontan procedure. Interact. Cardiovasc. Thorac. Surg. 2007;6:328–330. doi: 10.1510/icvts.2006.146928. doi: 10.1510/icvts.2006.146928. [DOI] [PubMed] [Google Scholar]
- 30.de Leval M. The Fontan circulation: what have we learned? What to expect? Pediatr. Cardiol. 1988;19(4):316–320. doi: 10.1007/s002469900315. doi: 10.1007/s002469900315. [DOI] [PubMed] [Google Scholar]
- 31.de Leval M. The Fontan circulation: a challenge to William Harvey? Nat. Clin. Pract. Cardiovasc. Med. 2005;2(4):202–208. doi: 10.1038/ncpcardio0157. doi: 10.1038/ncpcardio0157. [DOI] [PubMed] [Google Scholar]
- 32.de Leval MR, Kilner P, Gewillig M, Bull C. Total cavopulmonary connection: a logical alternative to atriopulmonary connection for complex Fontan operations. Experimental studies and early clinical experience. J. Thorac. Cardiovasc. Surg. 1988;96(5):682–695. [PubMed] [Google Scholar]
- 33.Mace L, Dervanian P, Bourriez A, Mazmanian GM, Lambert V, Neveux J. Changes in venous return parameters associated with univentricle Fontan circulations. Am. J. Physiol. Heart Circ. Physiol. 2000;279:H2335–H2343. doi: 10.1152/ajpheart.2000.279.5.H2335. [DOI] [PubMed] [Google Scholar]
- 34.Magosso E, Cavalcanti S, Ursino M. Theoretical analysis of rest and exercise hemodynamics in patients with total cavopulmonary connection. Am. J. Physiol. Heart Circ. Physiol. 2002;282:H1018–H1034. doi: 10.1152/ajpheart.00231.2001. [DOI] [PubMed] [Google Scholar]
- 35.Masters JC, Ketner M, Bleiweis MS, Mill M, Yoganathan A, Lucas CL. The effect of incorporating vessel compliance in a computational model of blood flow in a total cavopulmonary connection (TCPC) with caval centerline offset. J. Biomech. Eng. 2004;126(6):709–713. doi: 10.1115/1.1824126. doi: 10.1115/1.1824126. [DOI] [PubMed] [Google Scholar]
- 36.Mitchell ME, Ittenbach RF, Gaynor JW, Wernovsky G, Nicolson S, Spray TL. Intermediate outcomes after the Fontan procedure in the current era. J. Thorac. Cardiovasc. Surg. 2006;131(1):172–180. doi: 10.1016/j.jtcvs.2005.08.047. doi: 10.1016/j.jtcvs.2005.08.047. [DOI] [PubMed] [Google Scholar]
- 37.Norwood W, Jacobs ML. Fontan’s procedure in two stages. Am. J. Surg. 1993;166:548–551. doi: 10.1016/s0002-9610(05)81151-1. doi: 10.1016/S0002-9610(05)81151-1. [DOI] [PubMed] [Google Scholar]
- 38.Orlando W, Shandas R, DeGroff C. Efficiency differences in computational simulations of the total cavopulmonary circulation with and without compliant vessel walls. Comput. Methods Programs Biomed. 2006;81(3):220–227. doi: 10.1016/j.cmpb.2005.11.010. doi: 10.1016/j.cmpb.2005.11.010. [DOI] [PubMed] [Google Scholar]
- 39.Pekkan K, Frakes D, De Zelicourt D, Lucas CW, Parks WJ, Yoganathan AP. Coupling pediatric ventricle assist devices to the Fontan circulation: simulations with a lumped-parameter model. Asaio J. 2005;51(5):618–628. doi: 10.1097/01.mat.0000176169.73987.0d. doi: 10.1097/01.mat.0000176169.739 87.0d. [DOI] [PubMed] [Google Scholar]
- 40.Pekkan K, Kitajima H, Forbess J, Fogel M, Kanter K, Parks JM, Sharma S, Yoganathan AP. Total cavopulmonary connection flow with functional left pulmonary artery stenosis—fenestration and angioplasty in vitro. Circulation. 2005;112(21):3264–3271. doi: 10.1161/CIRCULATIONAHA.104.530931. doi: 10.1161/CIRCULATIONAHA.104.530931. [DOI] [PubMed] [Google Scholar]
- 41.Pekkan K, Whited B, Kanter K, Sharma S, de Zelicourt D, Sundareswaran K, Frakes D, Rossignac J, Yoganathan AP. Patient-specific surgical planning and hemodynamic computational fluid dynamic optimization through free-form haptic anatomy editing tool (SURGEM) Med. Biol. Eng. Comput. 2008 Aug 5; doi: 10.1007/s11517-008-0377-0. [Epub ahead of print] [DOI] [PubMed] [Google Scholar]
- 42.Pekkan K, Zelicourt D, Ge L, Sotiropoulos F, Frakes D, Fogel MA, Yoganathan AP. Physics-driven CFD modeling of complex anatomical cardiovascular flows—a TCPC case study. Ann. Biomed. Eng. 2005;33(3):284–300. doi: 10.1007/s10439-005-1731-0. doi: 10.1007/s10439-005-1731-0. [DOI] [PubMed] [Google Scholar]
- 43.Rossignac J, Pekkan K, Whited B, Kanter K, Sharma S, Yoganathan A. Surgem: Next Generation CAD Tools for Interactive Patient-specific Surgical Planning and Hemodynamic Analysis. Atlanta: Georgia Institute of Technology; 2006. [Google Scholar]
- 44.Ryu K, Healy TM, Ensley AE, Sharma S, Lucas C, Yoganathan AP. Importance of accurate geometry in the study of the total cavopulmonary connection: computational simulations and in vitro experiments. Ann. Biomed. Eng. 2001;29(10):844–853. doi: 10.1114/1.1408930. doi: 10.1114/1.1408930. [DOI] [PubMed] [Google Scholar]
- 45.Soerensen DD, Pekkan K, Sundareswaran KS, Yoganathan AP. New power loss optimized Fontan connection evaluated by calculation of power loss using high resolution PC-MRI and CFD; Conf. Proc. IEEE Eng. Med. Biol. Soc; 2004. pp. 1144–1147. [DOI] [PubMed] [Google Scholar]
- 46.Soerensen DD, Pekkan K, de Zelicourt D, Sharma S, Kanter K, Fogel M, Yoganathan AP. Introduction of a new optimized total cavopulmonary connection. Ann. Thorac. Surg. 2007;83(6):2182–2190. doi: 10.1016/j.athoracsur.2006.12.079. doi: 10.1016/j.athoracsur.2006.12.079. [DOI] [PubMed] [Google Scholar]
- 47.Sorensen TS, Greil GF, Hansen OK, Mosegaard J. Surgical simulation—a new tool to evaluate surgical incisions in congenital heart disease? Interact. Cardiovasc. Thorac. Surg. 2006;5(5):536–539. doi: 10.1510/icvts.2006.132316. doi: 10.1510/icvts.2006.132316. [DOI] [PubMed] [Google Scholar]
- 48.Stamm C, Friehs I, Mayer JE, Zurakowski D, Triedman JK, Moran AM, Walsh EP, Lock JE, Jonas RA, del Nido PJ. Long-term results of the lateral tunnel Fontan operation. J. Thorac. Cardiovasc. Surg. 2001;121(1):28–41. doi: 10.1067/mtc.2001.111422. doi: 10.1067/mtc.2001.111422. [DOI] [PubMed] [Google Scholar]
- 49.Sundareswaran K, Fogel M, Pekkan K, Kitajima H, Parks W, Sharma S, Yoganathan A. Viscous Dissipation Power Loss of the Total Cavopulmonary Connection Evaluated Using Phase Contrast Magnetic Resonance Imaging. Chicago: The American Heart Association (AHA) Scientific Sessions; 2006. [Google Scholar]
- 50.Sundareswaran KS, Kanter KR, Kitajima HD, Krishnankutty R, Sabatier JF, Parks WJ, Sharma S, Yoganathan AP, Fogel M. Impaired power output and cardiac index with hypoplastic left heart syndrome: a magnetic resonance imaging study. Ann. Thorac. Surg. 2006;82(4):1267–1275. doi: 10.1016/j.athoracsur.2006.05.020. doi: 10.1016/j.athoracsur.2006.05.020; discussion 1275–1267. [DOI] [PubMed] [Google Scholar]
- 51.Sundareswaran KS, Pekkan K, Dasi LP, Whitehead K, Sharma S, Kanter KR, Fogel MA, Yoganathan AP. The Total Cavopulmonary Connection Resistance: A Significant Impact on Single Ventricle Hemodynamics at Rest and Exercise. Am. J. Physiol. Heart Circ. Physiol. 2008 Oct 17; doi: 10.1152/ajpheart.00628.2008. [Epub ahead of print] (in press) [DOI] [PMC free article] [PubMed] [Google Scholar]
- 52.Sundareswaran K, de Zelicourt D, Pekkan K, Jayaprakash G, Kim D, Rossignac J, Fogel M, Kanter K, Yoganathan A. Anatomically realistic patient-specific surgical planning of complex congenital heart defects using MRI and CFD. 29th IEEE EMBS Annual International Conference, Cité Internationale; Lyon, France. 2007. [DOI] [PubMed] [Google Scholar]
- 53.Wang C, Pekkan K, de Zelicourt D, Hormer M, Parihar A, Kulkarni A, Yoganathan A. Progress in the CFD modeling of flow instabilities in anatomical total cavopulmonary connections. Ann. Biomed. Eng. 2007 doi: 10.1007/s10439-007-9356-0. (in press) [DOI] [PubMed] [Google Scholar]
- 54.Whitehead KK, Pekkan K, Kitajima HD, Paridon SM, Yoganathan AP, Fogel MA. Nonlinear power loss during exercise in single-ventricle patients after the Fontan: insights from computational fluid dynamics. Circulation. 2007;116(Suppl 11):I165–I171. doi: 10.1161/CIRCULATIONAHA.106.680827. [DOI] [PubMed] [Google Scholar]
- 55.Whitehead KK, Pekkan K, Kitajima H, Paridon S, Fogel M, Yoganathan AP. Computational Model of Exercise Effects on Fontan Hemodynamics Demonstrates Favorable Energetics in Extracardiac Fontans When Compared to Lateral Tunnel. Orlando, FL: The American Heart Association (AHA) Scientific Sessions Orange County Convention Center; 2007. Nov 4–7, (Also published in the Oct 31, 2007, special issue of Circulation: Journal of the American Heart Association) [Google Scholar]
- 56.Zelicourt D, Pekkan K, Kitajima H, Frakes D, Yoganathan AP. Single-step stereolithography of complex anatomical models for optical flow measurements. J. Biomech. Eng. 2005;127(1):204–207. doi: 10.1115/1.1835367. doi: 10.1115/1.1835367. [DOI] [PubMed] [Google Scholar]
- 57.Zélicourt D, Pekkan K, Parks WJ, Kanter K, Fogel M, Yoganathan AP. Flow study of an extra-cardiac connection with persistent left superior vena cava. J. Thorac. Cardiovasc. Surg. 2006;131(4):785–791. doi: 10.1016/j.jtcvs.2005.11.031. doi: 10.1016/j.jtcvs.2005.11.031. [DOI] [PubMed] [Google Scholar]
- 58.Zelicourt D, Pekkan K, Wills L, Kanter KS, Fogel M, Yoganathan AP. In vitro flow analysis of a patient specific intra-atrial TCPC. Ann. Thorac. Surg. 2005;79(6):2094–2102. doi: 10.1016/j.athoracsur.2004.12.052. doi: 10.1016/j.athoracsur.2004.12.052. [DOI] [PubMed] [Google Scholar]


