

Abstract
The current in-depth proteomics makes use of long chromatography gradient to get access to more peptides for protein identification, resulting in covering of as many as 8000 mammalian gene products in 3 days of mass spectrometer running time. Here we report a fast sequencing (Fast-seq) workflow of the use of dual reverse phase high performance liquid chromatography - mass spectrometry (HPLC-MS) with a short gradient to achieve the same proteome coverage in 0.5 day. We adapted this workflow to a quantitative version (Fast quantification, Fast-quan) that was compatible to large-scale protein quantification. We subjected two identical samples to the Fast-quan workflow, which allowed us to systematically evaluate different parameters that impact the sensitivity and accuracy of the workflow. Using the statistics of significant test, we unraveled the existence of substantial falsely quantified differential proteins and estimated correlation of false quantification rate and parameters that are applied in label-free quantification. We optimized the setting of parameters that may substantially minimize the rate of falsely quantified differential proteins, and further applied them on a real biological process. With improved efficiency and throughput, we expect that the Fast-seq/Fast-quan workflow, allowing pair wise comparison of two proteomes in 1 day may make MS available to the masses and impact biomedical research in a positive way.
The performance of mass spectrometry has been improved tremendously over the last few years (1–3), making mass spectrometry-based proteomics a viable approach for large-scale protein analysis in biological research. Scientists around the world are striving to fulfill the promise of identifying and quantifying almost all gene products expressed in a cell line or tissue. This would make mass spectrometry-based protein analysis an approach that is compatible to the second-generation mRNA deep-seq technique (4, 5).
Two liquid chromatography (LC)-MS strategies have been employed to achieve deep proteome coverage. One is a single run with a long chromatography column and gradient to take advantage of the resolving power of HPLC to reduce the complexity of peptide mixtures; the other is a sequential run with two-dimensional separation (typically ion-exchange and reverse phase) to reduce peptide complexity. It was reported by two laboratories that 2761 and 4500 proteins were identified with a 10 h chromatography gradient on a dual pressure linear ion-trap orbitrap mass spectrometer (LTQ Orbitrap Velos)(6–8). Similarly, 3734 proteins were identified using a 8 h gradient on a 2 m long column with a hybrid triple quadrupole - time of flight (Q-TOF, AB sciex 5600 Q-TOF)(9) mass spectrometer. The two-dimensional approach has yielded more identification with longer time. For example, 10,006 proteins (representing over 9000 gene products, GPs)1 were identified in U2OS cell (10), and 10,255 proteins (representing 9207 GPs) from HeLa cells (11). It took weeks (for example, 2–3 weeks) of machine running time to achieve such proteome coverage, pushing proteome analysis to the level that is comparable to mRNA-seq. With the introduction of faster machines, human proteome coverage now has reached the level of 7000–8500 proteins (representing 7000–8000 GPs) in 3 days (12). Notwithstanding the impressive improvement, the current approach using long column and long gradient suffers from inherent limitations: it takes long machine running time and it is challenging to keep reproducibility among repeated runs. Thus, current throughput and reproducibility have hindered the application of in-depth proteomics to traditional biological researches. A timesaving approach is in urgent need.
In this study, we used the first-dimension (1D) short pH 10 RP prefractionation to reduce the complexity of the proteome (13), followed by sequential 30 min second-dimension (2D) short pH 3 reverse phase-(RP)-LC-MS/MS runs for protein identification (14). The results demonstrated that it is possible to identify 8000 gene products from mammalian cells within 12 h of total MS measurement time by applying this dual-short 2D-RPLC-MS/MS strategy (Fast sequencing, Fast-seq). The robustness of the strategy was revealed by parallel testing on different MS systems including quadrupole orbitrap mass spectrometer (Q-Exactive), hybrid Q-TOF (Triple-TOF 5600), and dual pressure linear ion-trap orbitrap mass spectrometer (LTQ-Orbitrap Velos), indicating the inherent strength of the approach as to merely taking advantage of the better MS instruments. This strategy increases the efficiency of MS sequencing in unit time for the identification of proteins. We achieved identification of 2200 proteins/30 mins on LTQ-Orbitrap Velos, 2800 proteins/30 mins on Q-Exactive and Triple-TOF 5600 respectively. We further optimized Fast-seq and worked out a quantitative-version of the Fast-seq workflow: Fast-quantification (Fast-quan) and applied it for protein abundance quantification in HUVEC cell that was treated with a drug candidate MLN4924 (a drug in phase III clinical trial). We were able to quantify > 6700 GPs in 1 day of MS running time and found 99 proteins were up-regulated with high confidence. We expect this efficient alternative approach for in-depth proteome analysis will make the application of MS-based proteomics more accessible to biological applications.
MATERIALS AND METHODS
Preparation of Protein Samples
Proteins of HeLa, HepG2, or HUVEC cells were extracted with 8 m urea, and 200 to 400 μg of protein was reduced by adding 2.96 μl of 0.1 m dithiothreitol for 4 h at 37 °C and then alkylated by adding 3.29 μl of 0.5 m iodoacetamide for 60 min at room temperature in the dark. The protein sample was finally digested using trypsin at a mass ratio of 1:50 enzyme/protein overnight at 37 °C and stopped by addition of 1% formic acid (FA).
First Dimension High pH RP Chromatography
The first dimension RP separation by microLC was performed on an l-3000 HPLC System (Rigol) by using a Durashell RP column (5 μm, 150 Å, 250 mm × 4.6 mm i.d., Agela). Mobile phases A (2% acetonitrile, adjusted pH to 10.0 using NH3·H20) and B (98% acetonitrile, adjusted pH to 10.0 using NH3·H20) were used to develop a gradient. The solvent gradient was set as follows: 5–8% B, 2 min; 8–18% B, 11 min; 18–32% B, 9 min; 32–95% B, 1 min; 95% B, 1 min; 95–5% B, 2 min. The tryptic peptides were separated at an eluent flow rate of 1.5 ml/min and monitored at 214 nm. The column oven was set as 60 °C. Eluent was collected every minute. The samples were dried under vacuum and reconstituted in 15 μl of 0.1% (v/v) FA, 2% (v/v) acetonitrile in water for subsequent analyses.
Second Dimension Low pH RP Chromatography Coupled with MS/MS Measurement
Fractions from the first dimension RPLC were dissolved with loading buffer and then separated by a C18 column (75 μm inner-diameter, 360 μm outer-diameter × 10 cm, 3 μm C18). Mobile phase A consisted of 0.1% formic acid in water solution, and mobile phase B consisted of 0.1% formic acid in acetonitrile solution; a series of adjusted linear gradients according to the hydrophobicity of fractions eluted in 1D LC with a flow rate of 350 nL/min was applied. The MS conditions are as the followings: For LTQ-Orbitrap Velos, the source was operated at 1.8 kV, with no sheath gas flow and with the ion transfer tube at 350 °C. The mass spectrometer was programmed to acquire in a data dependent mode. The survey scan was from m/z 375 to 1600 with resolution 60,000 at m/z 400. The 50 most intense peaks with charge state 2 and above were acquired with collision induced dissociation with normalized collision energy of 35%, activation time of 5 ms, one microscan and the intensity threshold was set at 500. The MS2 spectra were acquired in the LTQ normal scan mode. For Triple-TOF 5600: A spray voltage of 2600 V was applied. The MS scan range was m/z 350–1250. The top 50 precursor ions were selected in each MS scan for subsequent MS/MS scans with high resolution. MS scans were performed for 0.25 s, and subsequently 50 MS/MS scans were performed for 0.04 s of each. The dynamic exclusion for MS/MS was set as 12s. The collision induced dissociation (CID) energy was automatically adjusted by the rolling CID function of Analyst TF 1.5.1. For Orbitrap Q-Exactive: The source was operated at 1.8 kV. For full MS survey scan, automatic gain control (AGC) target was 3e6, scan range was from 300 to 1400 with the resolution of 70,000. The 75 most intense peaks with charge state 2 and above were selected for fragmentation by higher-energy collision dissociation (HCD) with normalized collision energy of 27%. The MS2 spectra were acquired with 17, 500 resolution.
Protein Identification
Raw files from Orbitrap Q-Exactive and LTQ-Orbitrap Velos were searched by Proteome Discovery version 1.3 using MASCOT search engine with percolator against the human ref-sequence protein database (34,361 proteins, updated on 07-04-2012). The mass tolerance was set to be 20 ppm for precursor. As for the tolerance of product ions, QE was set as 20 mmu and Velos was set as 0.5 Da. Oxidation (Met), Acetyl (N terminus) was chosen as variable modifications; carbamidomethyl (Cys) was chosen as a fixed modification; and one missed cleavage on trypsin was allowed. Wiff files from Triple-TOF 5600 were first searched by ProteinPilot version 4.2 using Paragon search engine against the human ref-sequence protein database (34,361 proteins, updated on 07-04-2012). Mascot generic format (Mgf) files containing MS peak lists were then exported by ProteinPilot and delivered to Proteome Discovery version 1.3 to search with the same parameters as with QE's.
Thorough and Stringent Data Analysis in Proteome Discovery
We also re-analyze all the data in another platform that permits the calculation of protein false discovery rate (FDR).
(Step 1) All the raw files of mass spectra were converted into mgf files using the msconvert module (15) in Trans-Proteomic Pipeline (TPP v4.5.2)(16). The MS/MS peak lists (mgf files) were searched using the Mascot v2.3.2 local server (17) against the database containing all the human protein sequences from NCBI Reference Sequences Database. Search parameters were: precursor and product ion peaks were searched with an initial mass tolerance of 20 ppm and 0.05 Da respectively. The enzyme specificity with trypsin was used. Up to two missed cleavages were allowed and peptides with at least seven amino acids were retained. Carbamidomethylation cysteine (+57.0215Da) was set as a fixed modification and oxidation (+15.9949Da) on methionine was set as a variable modification.
(Step 2) Identification Quality Control: The target-decoy based strategy was applied to control both peptide and protein level FDRs lower than 1%(18). PepDistiller (19) was used to calculate the probability value (q-value) that keep the FDR measured by the decoy hits lower than 1% for every peptide-spectrum match (PSM). Then all the peptide lengths shorter than seven amino acids was removed. The cutoff ion score for peptide identification was 20. All the PSMs in all fractions were combined for protein quality control, which was a more stringent quality control strategy (20). The q-values of both target and decoy peptide sequences were dynamically increased until the corresponding protein FDR was less than 1% employing the parsimony principle (21).
Protein Quantification and Absolute Amount Estimation
For each LC-MS/MS run, we first loaded identification results and the raw data from mzXML file. Then for each identified peptide, we extracted its XIC by searching against the MS1 based on its identification information, and estimate its abundance by calculating the area under the extracted XIC curve using a home-made program that improved XIC calculation of Protein Discoverer 1.3 as supplied by the manufacturer. For protein abundance calculation, we make use of the nonredundant peptide list to assemble proteins by using the parsimony principle at first. Proteins are sorted as equivalent, subset, superset, subsumable, differentiable, and distinct proteins (21). These differentiable, distinct, and equivalent proteins with more than one unique peptide are retained. Then, the protein abundances are estimated by using the iBAQ algorithm (22). For estimation of protein “absolute amounts,” summed iBAQ values of total proteome were taken as proxies. Likewise, we divided the protein amount loaded on the column (400 μg × 20% loading) by the average molecular weight (60 kDa) to calculate molar mass of the total amount of protein. These two quantities should be equal to each other, which allowed us to estimate the “absolute amounts” for each protein from its normalized MS signal.
Statistical Analysis of Quantification Proteome Data Set
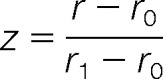
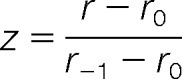
The differential proteins of the data set was determined by the method as described previously (23). Briefly, we took the natural logarithm of all normalized protein ratios and calculated the 15.87, 50, and 84.13 percentiles r-1, r0, and r1. We define r1-r0 and r0-r-1 as the right- and left-sided robust standard deviations. A suitable measure for a ratio r>r0 of being significantly far away from the main distribution would be the distance to r0 measured in terms of the right standard deviation
 |
Similarly, for a ratio r<r0 one would take
 |
p value
 |
Number of p value <0.01 (NO.p value <0.01).
In 1-repeat scheme, only 1 p value set was calculated (RP2-repeat1/RP1-repeat1), whereas 4 sets and 9 sets were calculated in the 2-repeat scheme (RP2-repeat1/RP1-repeat1, RP2-repeat1/RP1-repeat2, RP2-repeat2/RP1-repeat1, RP2-repeat2/RP1-repeat2) and 3-repeat (RP2-repeat1/RP1-repeat1, RP2-repeat1/RP1-repeat2, RP2-repeat1/RP1-repeat3, RP2-repeat2/RP1-repeat1, RP2-repeat2/RP1-repeat2, RP2-repeat2/RP1-repeat3, RP2-repeat3/RP1-repeat1, RP3-repeat3/RP1-repeat2, RP3-repeat3/RP1-repeat3) scheme respectively. The NO.p value <0.01 was set as filter for differential protein determination. For example, “NO.p value <0.01 ≥ 5” means proteins that have at least 5 p value lower than 0.01.
RESULTS
A Streamlined Workflow of Fast-seq
We used two-dimensional chromatography-MS/MS for peptide sequencing. We firstly employed high pH (pH 10) RP-LC (13, 24) to decrease the complexity of the tryptic digest of the HeLa total cell lysate. We collected 24 fractions in the first dimension RP-LC of a 72-min gradient. Then each fraction was run with a 60-min RP-LC gradient running at pH-3 coupled with a Q-Exactive MS. This experimental set required 1 day of instrument time (24 fractions × 60 min) and 8586 proteins (8406 GPs) were identified (supplemental Figs. S1A and 1B and Supplemental Table S1). We modified the workflow to reduce running time of both RP dimensions time to 30 min (supplemental Fig. 1C). In this experiment, 22 fractions were collected and measured in parallel on Q-Exactive (QE), Triple-TOF 5600 (5600), and LTQ-Orbitrap Velos (Velos) with the second dimension LC-MS/MS running with a 30 mins gradient (Fig. 1). The gradient of the second dimension LC was adjusted to match the hydrophobicity of fractions eluted from the first dimension RP-LC (supplemental Fig. S1D). A total of 8154, 8145, and 6763 proteins (representing 8032, 8031, and 6683 GPs) were found on QE, 5600 and Velos, respectively in 12 h of MS running (Fig. 2A and 2B and supplemental Table S2). We further reduced the MS running time by pooling the first RP fractions into 11 fractions that resulted in identification of more than 6000 gene products within 6 h on all three machines (supplemental Fig. S2A and S2B). These results indicated that 12-hour MS running a good compromise between proteome coverage and MS running time.
Fig. 1.
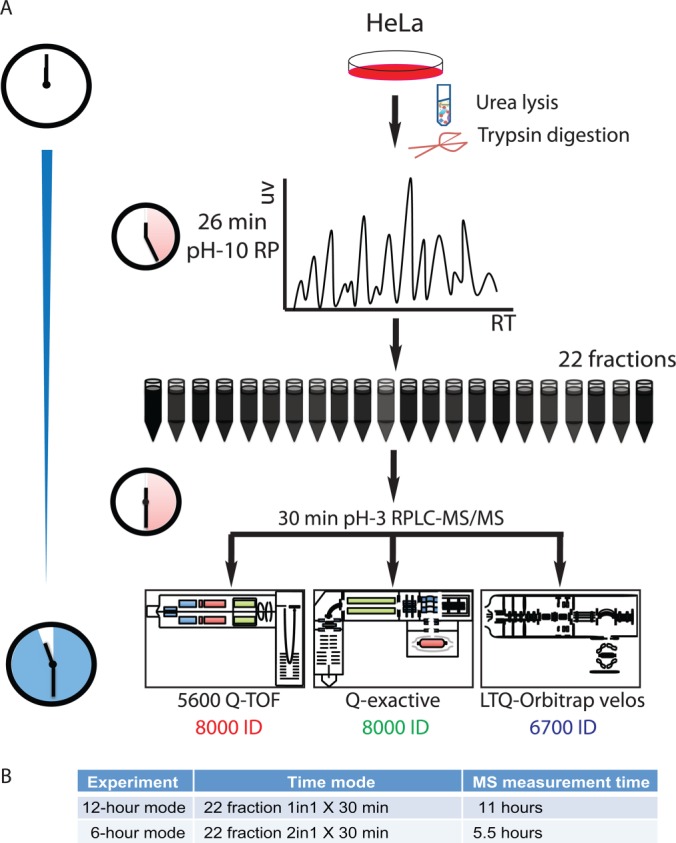
Streamlined workflow of Fast-seq strategy. Total proteins were extracted in urea solution and then digested by trypsin. Reverse phase chromatography with 30 min gradient in pH 10 condition was employed to pre-fractionate peptides complex. A series of second dimension reverse phase chromatography with 30 min gradient in pH 3 condition was applied and online deliver peptides to different types of MS for identification.
Fig. 2.

High efficiency of Fast-seq strategy in deep proteome coverage. A, Individual identified protein counts of first dimension RP fractions measured by three different MS platforms in 12-hour mode. B, Cumulative protein mass identified by three MS in 12-hour mode. C, Venn diagram of identified protein from three MS. D, Dynamic range of Fast-seq analysis of HeLa cells identified by three MS. Ranking of proteins according to their absolute amounts. Quantification is based on added peptide intensities of the proteins as described in the Materials and Methods section.
We reanalyzed a data set of 12-hour mode Fast-seq from QE for rigorous evaluation by applying more stringent quality control strategy (see Materials and Methods, Peptide length ≥7, Mascot ion score >20, peptide FDR < 1%, protein FDR < 1%, applying the parsimony principle (21) in peptide grouping) and gained over 7700 protein (representing 7593 GPs) identifications. Using MaxQuant, we also identified > 7600 proteins with < 1% FDR on both peptide and protein level (supplemental Table S2), confirming our analysis. We concluded that Fast-seq that takes 12 h of MS running time is an in-depth and efficient approach for proteome coverage (online resource with annotated spectra information. http://61.50.134.133/browseOneExperiment.jsp?experiment=Hela).
The Fast-seq Strategy Improves MS Identification Efficiency
The fast-seq workflow achieved high efficiency for protein ID on all three tested MS instruments including the slower Velos instrument. In the 12-hour mode, the average number of protein identified was 2223 ± 356, 2439 ± 392, and 1454 ± 226 and the maximum number of identified protein were 2533, 2862, and 1737 on QE, 5600 and Velos in the 30-mins MS run, respectively (Figs. 2A and 2B). In the 6-hour mode, the average number of identified proteins increased to 2398 ± 155, 2553 ± 104 and 2065 ± 133 and the maximum value were 2718, 2741 and 2241 per 30 min on the three MS platforms (supplemental Fig. S2A and S2B). The number of proteins identified in this workflow with 30-min gradient is no fewer than those from longer gradient (7, 8). We detected 73,680 unique peptides on QE from the 12-h run, which resulted in 21.26% median sequence coverage of identified proteins. The unique peptide number and coverage percentage were 70,552 and 19.86% in the 5600 data set, demonstrating a similar performance of Fast-seq approach on different MS platforms. Detection of 8000 gene products implies high dynamic range covered in the data set. As a result, a dynamic range of 5.5 and 6 orders of magnitude was achieved for precursor intensity of identified peptides in 6 h and 12 h mode respectively (supplemental Fig. S2C). The results indicated that the Fast-seq workflow is indeed an efficient and deep proteome strategy not only in protein number counts, but also in protein sequence coverage.
Combining three data sets of 12-hour running, we found 9037 proteins (represent 8823 gene products) at 1% FDR at the protein level, representing most efficient in-depth proteome covered in a mammalian cell line with the shortest MS measurement time (10, 11) (12 h × 3 instruments) (Fig. 2C and supplemental Table S3). When overlaying these data onto pathway database of the Kyoto Encyclopedia of Genes and Genome (KEGG)(25), we found 196 of 200 KEGG pathways were covered, and more than 100 of which have coverage of over 50%, indicating our dataset has good coverage of the proteome/genome. The three data sets from different instruments have similar coverage for the KEGG pathways as shown in supplemental Fig. S3.
Using the intensity based absolute quantification (iBAQ) algorithm (22), we estimated the distribution of protein abundance ranged up to 6 orders of magnitude (Fig. 2D). The predicted median protein amount was 2 fmole, 9 fmole, and 19 fmole (in 400 μg of total protein applied to the first dimension HPLC) in QE, 5600 and Velos data set respectively after fraction of the total (FOT) normalization with the assumption that average molecular weight is 60 kDa (8) (Materials and Methods).
Evaluation of Repeatability of Fast-seq Using Label-free Quantification
We then evaluated the possibility of using the fast-seq workflow for large-scale proteome quantification. Whole cell extract of HepG2 cells was digested and processed with Fast-seq strategy. We performed two parallel MS analysis from either same fractions of one RP experiment (MS repeats), or equivalent fractions of two RP-LC experiments (RP repeats) (Fig. 3A). In these data set, 8226 proteins were identified, and over 7000 proteins could be quantified for repeatability evaluation. After log2-transformation, the correlation coefficient (R2) of protein abundance was 0.94 and 0.93 within MS repeats, and was over 0.80 across RP repeats (Fig. 3B), implying good repeatability of the Fast-seq workflow. The median coefficient of variation (CV) was 0.75% and 0.82% in MS repeats, and was 1.8% across RP repeats (Figs. 3C and 3D). These data suggested that the Fast-seq workflow may be usable for label-free proteome quantification.
Fig. 3.

Repeatability evaluation of Fast-seq strategy with label-free quantification. A, Experimental design to estimate the accuracy of Fast-seq strategy in quantification, B, correlation curve of identified proteins iBAQ value in MS repeats or RP repeats. iBAQ value was calculated and transformed to base-2 logarithms. Coefficient of variation that comes from the proteinsidentified in MS repeats and RP repeats in Fast-seq strategy is visualized as box plots (C) and density plots (D).
Optimization of Fast-seq for Large-scale Proteome Quantification: A Quantitative Version of Fast-seq—Fast Quantification (Fast-quan)
In Fast-seq, we found the protein/peptide accumulation curve rapidly reached its plateau in the first several runs, suggesting a compromise could be made to further reduce the MS running time without reducing proteome coverage too much. Shorter MS running time has the added benefit that the MS instrument running conditions could be constant, which is a prerequisite for label-free quantification.
We then evaluated the efficiency and accuracy for label-free quantification of different variations of the Fast-seq workflow within 12 h of MS running time. We divided equally a tryptic digest of HeLa whole cell lysate and then added tryptic peptides of 10 isotope-labeled quantitative concatenated protein (QconCAT) proteins with known ratios (supplemental Table S4). We fractionated them in the first dimension LC and collected 24 fractions for each run (RP1 and RP2). In the confinement of 12 h MS running time, we run the 24 fractions once (24 × 1, scheme 1), pooled two fractions for 12 MS runs with two MS repeats (12 × 2, scheme 2), and pooled three fractions for 8 MS runs with three MS repeats (8 × 3, scheme 3) (Fig. 4A). As expected, the proteome identification was reduced by 15% in the three-repeat scheme as compared with the one-repeat scheme (Table I).
Fig. 4.

Development of Fast-quan strategy in large-scale proteome quantification. A, Experimental design of two repetitive RP-LC-MS experiments with equal background proteome and differentially spiked labeled standard proteins QconCAT. B, Number of significant false quantified proteins plot in correlated to differential ratio threshold. X-axis stands for number of false quantified proteins (whose NO.p value<0.01 = 1 in 1-repeat group, NO.p value<0.01 = 4 in 2-repeat group, NO.p value<0.01 = 9 in 3-repeat group) that distribute in rejection region whose thresholds were defined in y-axis ( log2 (Ratio) ). Valued arrows marked in figure stand for logarithmic differential threshold value of 1% false quantified protein rate. C, Total quantifiable proteins and false quantified proteins (NO.p value<0.01 = 9) comparison in Fast-quan (3-repeat) dataset according to criteria of minimum number of peptides match for protein quantification. Percentage values marked in figure stand for false quantification rate of the dataset. D, Experimental QconCAT ratios quantified by #1, #2, and #3 Fast-seq scheme (Fast-quan) were consistent with their theoretical spiked ratios.
Table I. Statistic evaluation of differential protein determination in three Fast-seq quantitative adjustments. *Number of p value that lower than 0.01.
| Fast-seq scheme | Fractions × repeat | Total MS measuring time | p value filter* | Qconcat | Theorytical differential QconCAT | Detected differential QconCAT | False negative number | Identified Protein | Theorytical differential protein | Deteceted differential proteins (False positive number) | False positive rate (%) |
|---|---|---|---|---|---|---|---|---|---|---|---|
| 1-repeat | 21 (1 in 1) × 1 | 12 hours | NUM≥1 | 10 | 9 | 10 | 0 | 7758 | 0 | 677 | 8.73 |
| 2-repeat | 10 (2 in 1) × 2 | 12 hours | NUM≥1 | 10 | 9 | 10 | 0 | 7120 | 0 | 1212 | 17.02 |
| NUM≥2 | 10 | 9 | 9 | 0 | 7120 | 0 | 814 | 11.43 | |||
| NUM≥3 | 10 | 9 | 9 | 0 | 7120 | 0 | 390 | 5.48 | |||
| NUM≥4 | 10 | 9 | 9 | 0 | 7120 | 0 | 268 | 3.76 | |||
| 3-repeat | 7 (3 in 1) × 3 | 12 hours | NUM≥4 | 10 | 9 | 10 | 0 | 6529 | 0 | 924 | 14.15 |
| NUM≥5 | 10 | 9 | 9 | 0 | 6529 | 0 | 442 | 6.77 | |||
| NUM≥6 | 10 | 9 | 9 | 0 | 6529 | 0 | 303 | 4.64 | |||
| NUM≥7 | 10 | 9 | 9 | 0 | 6529 | 0 | 191 | 2.93 | |||
| NUM≥8 | 10 | 9 | 9 | 0 | 6529 | 0 | 148 | 2.27 | |||
| NUM≥9 | 10 | 9 | 9 | 0 | 6529 | 0 | 117 | 1.79 |
We applied the statistics of significant test to calculate p values of proteins identified in RP1 and RP2 from the three schemes to find the differentially expressed proteins (supplemental Fig. S4A) (23). One paired comparison could be made in scheme 1, whereas four and nine paired comparisons could be made in scheme 2 and 3, respectively. We chose the p value <0.01 as a gauge for assigning differentially expressed proteins. In addition to the p value evaluation, we could also use the numbers of p value <0.01 as a secondary parameter for differential protein determination.
Because samples from RP1 and RP2 are identical, proteins that were identified as differentially expressed proteins from the significant test can be considered as false quantified differential proteins (FQDPs). We evaluated the rate of false quantification considering the parameters of iBAQ ratio and the number of p values <0.01, which can be determined from the number of repeats. Even with 9 p values <0.01 (the 3-repeat scheme), a significant number of false quantified proteins were found and plotted at a function of iBAQ ratio (Fig. 4B). The numbers of FQDPs in 1- (NO.p value <0.01 = 1), 2- (NO.p value <0.01 = 4), and 3- (NO.p value <0.01 = 9) repeat schemes were 770, 275, and 117, respectively. Considering proteins were identified with 1% FDR, it was logical to assume that the lower limit of FQDPs in global proteome was 1%. Taking 1% false quantification rate for all identified proteins, we found that the minimum confidence limit of iBAQ log2 ratio was 2.13, 3.14, and 7.01, (corresponding to ratio of 5, 10, and 50) respectively for 3, 2, and 1 repeat experiment (Fig. 4B). The false quantification rate may be composed of two parts: (1) inaccuracy in quantification, (2) FDR in identification. The above calculation included proteins identified with 1 peptide. Increasing the threshold of number of detected peptides for protein quantification reduced both quantifiable proteins and FQDPs, and the rate of drop for FQDPs is faster than that of quantified proteins, which can be explained by increasing of quantification accuracy and decreasing of FDR of protein identification (Fig. 4C and supplemental Fig. S4C). Demanding ≥ 2 peptides detected for protein quantification dramatically decreased the differential expression threshold of iBAQ log2 ratio to 0.22, 1.66, 3.17 (corresponding to ratio of 1.2, 3.2, and 10) for 1% false quantification rate in 3, 2, and 1-repeat scheme, respectively (supplemental Fig. S4D).
We then tested the correlation of various parameters (iBAQ ratio, number of p values<0.01, and number of peptides detected in protein identification) with false quantification rate. For the 3-repeat scheme, relaxing the number of p value <0.01 from 9 to 5 resulted in increasing of FQDPs, but the rate of increase was insignificant at higher iBAQ ratios region (supplemental Fig. S4B). Increasing threshold of minimum number of matched peptides to 2-peptide for protein quantification can dramatically compromise the loss of accuracy caused by relaxing in NO.p values < 0.01 (supplemental Fig. S4E). Importantly, the ratios of all spiked QconCAT proteins were correctly determined in the 3-repeat scheme (Fig. 4D). We concluded that the false quantification rate of the 3-repeat scheme can be kept in a low level and named this scheme as the Fast-quantification (Fast-quan) approach.
An Application of the Fast-quan Workflow: Screening of Accumulated Proteins in Response to CRLs/SCF Inactivation Induced by MLN4924
Cullin-RING ubiquitin ligases (CRLs) represent the largest E3 ubiquitin ligase family in eukaryotes. The discovery of their substrates, which is critical to revealing regulation of the proteome, attracted broad interest (26, 27). MLN4924 is a small molecule that selective inhibits Nedd8-activating enzyme (NAE)(28). Inhibition of NAE by MLN4924 prevents the conjugation of cullin proteins with NEDD8, resulting in inactivation of the entire family of CRLs. We employed the Fast-quan strategy to infer CRL substrates by comparing proteome pattern of MLN4924 treated group with vehicle group in human umbilical vein endothelial cell HUVEC. In all, 6784 gene products were identified (online recourse with annotated spectra information: http://61.50.134.133/browseOneExperiment.jsp?experiment=HUVEC_DMSO_QE, http://61.50.134.133/browseOneExperiment.jsp?experiment=HUVEC_MLN_QE). Taking into account the known subtracts based on prior knowledge, we generated two candidate lists for up-regulated proteins: (1) A sensitive but less accurate 194-candidate list (Ratio of MLN4924/Vehicle > 5, at least 6 p values < 0.01), which has roughly 0.8% of false quantification rate (60 FQDPs); (2) A accurate but less sensitive 99-candidate list (Ratio of MLN4924/Vehicle > 5, at least 6 p values < 0.01, at least 2 peptides matched), which has roughly 0.3% of false quantification rate (25 FQDPs) (supplemental Table S5 and supplemental Fig. S4F).
We subjected differentially accumulated proteins to Ingenuity Pathway Analysis (IPA, www.ingenuity.com) and found that accumulated proteins interacted with each other and concentrated in the cell cycle regulation pathway (Figs. 5A and 5B). As the CRLs/SCF systems play major roles in the maintenance of genomic integrity and cellular homeostasis, which are important for tumor suppression and oncogenesis (29), many tumoorgenesis related proteins were found to be significantly accumulated in response to CRLs/SCF inactivation, including MT1X (30), CDCA2 (31), TPX2 (32), PLAUR (33), PLEK2 (34), SLC7A11 (35), and SUV39H1 (36), suggesting potential mechanism for suppressing of cancer cells by MLN4924 in cancer therapy.
Fig. 5.

Ingenuity analysis of representative accumulated proteins in response to inactivation of CRL/SCF system. A, Interacted network, and (B) cellular pathway focus of accumulated proteins induced by MLN4924.
DISCUSSION
The improvement in MS performance has made it possible to achieve deep coverage of the proteome (11). Current proteomics strategy tends to use prefractionation and to employ long gradient in the second dimension HPLC/MS/MS to overcome the problem of sample complexity (8), this is achieved at the expense of MS running time, such that a typical experiment for proteome coverage takes days and weeks to complete. Such long time of MS running is cost prohibitive for many scientists and is challenging to maintain the instrument at constant conditions during different runs so that the results can be compared. This shortcoming has hindered the wide spread use of proteome deep sequencing in biomedical applications.
In this study, we sought for a strategy that effectively balances the efficiency and depth in proteome covering. Previous studies have revealed the outstanding capability of 2-D RP-RP system in peptide separation (13, 24, 37). RP-RP approaches using two different pH values were further demonstrated to have good potential in fractionating complex protein mixtures (14, 38, 39). Based on previous knowledge, we chose an opposite way from current proteomics strategies by using a dual-short RP/RPLC-MS/MS approach (Fast-seq strategy) in proteome deep-coverage (Fig. 1). The results have shown an increase in efficiency for proteome identification. An average of over 2000 protein identifications in 30 min on all three tested MS platforms far exceeded any reported MS records from the literature. It is possible to identify 8000 GPs in 12 h of MS running time and this implies that it is possible to reach deep proteome coverage in a short time.
We combined data sets of the 12 h mode from three instruments and gained over 8800 GPs from HeLa whole cell lysate (Fig. 2). Meanwhile, the sequence coverage of identified protein was over 20% on average, indicating the approach is indeed an efficient and deep proteome strategy not only in protein number counts. Repeatability evaluation of protein abundance has further extended the application of Fast-seq in biological research on entire proteome quantification across different physiology/pathology processes (Fig. 3).
The Fast-seq approach has several attractive characteristics. First, the method is efficient in that it only requires 12 h of MS measurement time to map a human proteome at the depth of 8000 GPs. This is a sufficiently deep proteome coverage that the majority of regulatory proteins that include kinases, transcription factors (40), trans-membrane receptors (41), tumor suppressor proteins, and onco-proteins are detected, facilitating research in regulatory biology. Second, the RP-RP approach eliminates the desalting step, further simplifying the workflow of proteome analysis. Third and most important, the Fast-seq approach is compatible with any label- and label-free based absolute and relative quantification.
We adapted the Fast-seq workflow to a version that allowed for protein quantification—Fast-quan. We subjected two identical samples to the fast-quan workflow, which allowed us to systematically evaluate different parameters that impact the sensitivity and accuracy of the Fast-quan workflow (Fig. 4). Using the statistics of significant test, we unraveled the existence of substantial falsely quantified differential proteins (FQDPs) and estimated correlation of false quantification rate and parameters that are applied in label-free quantification. The rate of FQDPs is composed of the false discovery rate (FDR) in identification, inaccuracy in AUC calculation, and reproducibility of HPLC and MS runs. Our systematic evaluation suggested that it is possible to obtain reasonable numbers of FQDPs (< 20 proteins) when using the following parameters: 3 MS repeats, iBAQ ratio > 5, NO.p values < 0.01 = 9 and at least two peptides detected with 1% FDR in protein identification.
Last, we employed the quantitative version of Fast-seq: Fast-quan on differential proteome screenings in response to de-activation of CRL/SCF system blocked by MLN4924, aiming to find CRL/SCF regulated proteins. A total of 6784 GPs were identified and quantified. The flexibility of the Fast-quan workflow and its associated data analysis method allowed us to take into account of the known subtracts based on prior knowledge and generate two candidate lists for up-regulated proteins: (1) A sensitive but less accurate 194-candidate list, which may include 60 FQDPs and (2) An accurate but less sensitive 99-candidata list, which may include 25 FQDPs. We believe that for biological applications with known positive controls, it is necessary to adjust the parameter set of Fast-quan data analysis so that the positive controls are included, but it is important to keep in mind the number of FQDPs under the parameter set used for the analysis.
Our measurement yielded many known CRL substrates including CDC25A, CDKN1A, CDKN1B, DTL, NFE2L2, CCND, JUN, NUSAP1 (26), CEP110 (42), FBXO5, WEE1, and ORC1 (43), suggesting the sensitivity of Fast-quan in large-scale proteome quantification. Apart from CDC25A, CCND1, FBXO5 and NFE2L2 that have only single-peptide identified, other known substrates were matched with at least two peptides. Besides direct substrates of CRLs, changes of other proteins that related to CRLs/SCF system were also quantified. Sororin (also known as CDC5A) was identified as a substrate of the anaphase-promoting complex (APC)(44). Emi1 (also known as FBXO5), another substrate of CRLs/SCF, inhibits the activity of APC. We detected accumulation of both Emi1 and Sororin under MLN4924 treatment. Thus, the candidate list includes both CRLs/SCF substrates and the proteins that they regulate.
Previous proteomics study (27) had screened similar biological processes and achieved comparable proteome coverage with over 100 h (80 fractions × 80 min gradient) of total MS measuring time for each condition. With the Fast-quan workflow, we finished three MS technique repeats and achieved over 6700 GPs within 12 h of total MS measuring time for each condition. This corresponds to the reduction of MS measuring time from 8 days to 1 day. The reduction in time consumption may improve the measurement accuracy, as it is likely that MS running can be kept under constant conditions over a shorter time.
Fast-seq and Fast-quan may serve different proteomics purposes. Fast-seq is an efficient tool to push the envelope of in-depth proteomics, whereas Fast-quan is a relatively conservative strategy that ensures accuracy of quantification at the expense of slightly reduced proteome coverage. With outstanding efficiency and throughput, we expect that the Fast-seq/Fast-quan workflow will impact biomedical research in a positive way and may make MS available to the masses.
Supplementary Material
Footnotes
* This work is supported by National Program on Key Basic Research Project (973 Program, 2012CB910300, 2012CB910600); National High-tech R&D Program of China (863 program, 2012AA020200, 2012AA020201); National International Cooperation Grant (2012DFB30080); National Natural Science Foundation of China (31200582) and Beijing Natural Science Foundation (5132012).
 This article contains supplemental Figs. S1 to S4 and Tables S1 to S5.
1 The abbreviations used are:
- GPs
- gene products
- MS
- mass spectrometer
- FDR
- false discovery rate
- MS/MS
- tandem mass spectrometry
- RP-LC
- reverse phase liquid chromatography.
REFERENCES
- 1. Michalski A., Damoc E., Hauschild J. P., Lange O., Wieghaus A., Makarov A., Nagaraj N., Cox J., Mann M., Horning S. (2011) Mass spectrometry-based proteomics using Q Exactive, a high-performance benchtop quadrupole Orbitrap mass spectrometer. Mol Cell Proteomics 10, M111.011015. [DOI] [PMC free article] [PubMed] [Google Scholar]
- 2. Andrews G. L., Simons B. L., Young J. B., Hawkridge A. M., Muddiman D. C. (2011) Performance characteristics of a new hybrid quadrupole time-of-flight tandem mass spectrometer (TripleTOF 5600). Anal. Chem. 83, 5442–5446 [DOI] [PMC free article] [PubMed] [Google Scholar]
- 3. Michalski A., Damoc E., Lange O., Denisov E., Nolting D., Müller M., Viner R., Schwartz J., Remes P., Belford M., Dunyach J. J., Cox J., Horning S., Mann M., Makarov A. (2012) Ultra high resolution linear ion trap Orbitrap mass spectrometer (Orbitrap Elite) facilitates top down LC MS/MS and versatile peptide fragmentation modes. Mol. Cell. Proteomics 11, O111 013698 [DOI] [PMC free article] [PubMed] [Google Scholar]
- 4. Nagalakshmi U., Wang Z., Waern K., Shou C., Raha D., Gerstein M., Snyder M. (2008) The transcriptional landscape of the yeast genome defined by RNA sequencing. Science 320, 1344–1349 [DOI] [PMC free article] [PubMed] [Google Scholar]
- 5. Mortazavi A., Williams B. A., McCue K., Schaeffer L., Wold B. (2008) Mapping and quantifying mammalian transcriptomes by RNA-Seq. Nat. Methods 5, 621–628 [DOI] [PubMed] [Google Scholar]
- 6. Köcher T., Swart R., Mechtler K. (2011) Ultra-high-pressure RPLC hyphenated to an LTQ-Orbitrap Velos reveals a linear relation between peak capacity and number of identified peptides. Anal. Chem. 83, 2699–2704 [DOI] [PubMed] [Google Scholar]
- 7. Köcher T., Pichler P., Swart R., Mechtler K. (2012) Analysis of protein mixtures from whole-cell extracts by single-run nanoLC-MS/MS using ultralong gradients. Nat. Protoc. 7, 882–890 [DOI] [PubMed] [Google Scholar]
- 8. Thakur S. S., Geiger T., Chatterjee B., Bandilla P., Fröhlich F., Cox J., Mann M. (2011) Deep and highly sensitive proteome coverage by LC-MS/MS without prefractionation. Mol. Cell. Proteomics 10, M110 003699 [DOI] [PMC free article] [PubMed] [Google Scholar]
- 9. Iwasaki M., Sugiyama N., Tanaka N., Ishihama Y. (2012) Human proteome analysis by using reversed phase monolithic silica capillary columns with enhanced sensitivity. J. Chromatogr. A 1228, 292–297 [DOI] [PubMed] [Google Scholar]
- 10. Beck M., Schmidt A., Malmstroem J., Claassen M., Ori A., Szymborska A., Herzog F., Rinner O., Ellenberg J., Aebersold R. (2011) The quantitative proteome of a human cell line. Mol. Syst. Biol. 7, 549. [DOI] [PMC free article] [PubMed] [Google Scholar]
- 11. Nagaraj N., Wisniewski J. R., Geiger T., Cox J., Kircher M., Kelso J., Pääbo S., Mann M. (2011) Deep proteome and transcriptome mapping of a human cancer cell line. Mol. Syst. Biol. 7, 548. [DOI] [PMC free article] [PubMed] [Google Scholar]
- 12. Geiger T., Wehner A., Schaab C., Cox J., Mann M. (2012) Comparative proteomic analysis of eleven common cell lines reveals ubiquitous but varying expression of most proteins. Mol Cell Proteomics 11, M111.014050. [DOI] [PMC free article] [PubMed] [Google Scholar]
- 13. Wiczling P., Markuszewski M. J., Kaliszan M., Kaliszan R. (2005) pH/organic solvent double-gradient reversed-phase HPLC. Anal. Chem. 77, 449–458 [DOI] [PubMed] [Google Scholar]
- 14. Delmotte N., Lasaosa M., Tholey A., Heinzle E., Huber C. G. (2007) Two-dimensional reversed-phase x ion-pair reversed-phase HPLC: an alternative approach to high-resolution peptide separation for shotgun proteome analysis. J. Proteome Res. 6, 4363–4373 [DOI] [PubMed] [Google Scholar]
- 15. Kessner D., Chambers M., Burke R., Agus D., Mallick P. (2008) ProteoWizard: open source software for rapid proteomics tools development. Bioinformatics 24, 2534–2536 [DOI] [PMC free article] [PubMed] [Google Scholar]
- 16. Deutsch E. W., Mendoza L., Shteynberg D., Farrah T., Lam H., Tasman N., Sun Z., Nilsson E., Pratt B., Prazen B., Eng J. K., Martin D. B., Nesvizhskii A. I., Aebersold R. (2010) A guided tour of the Trans-Proteomic Pipeline. Proteomics 10, 1150–1159 [DOI] [PMC free article] [PubMed] [Google Scholar]
- 17. Perkins D. N., Pappin D. J., Creasy D. M., Cottrell J. S. (1999) Probability-based protein identification by searching sequence databases using mass spectrometry data. Electrophoresis 20, 3551–3567 [DOI] [PubMed] [Google Scholar]
- 18. Elias J. E., Gygi S. P. (2007) Target-decoy search strategy for increased confidence in large-scale protein identifications by mass spectrometry. Nat. Methods 4, 207–214 [DOI] [PubMed] [Google Scholar]
- 19. Li N., Wu S., Zhang C., Chang C., Zhang J., Ma J., Li L., Qian X., Xu P., Zhu Y., He F. (2012) PepDistiller: A quality control tool to improve the sensitivity and accuracy of peptide identifications in shotgun proteomics. Proteomics 12, 1720–1725 [DOI] [PubMed] [Google Scholar]
- 20. Peng J., Elias J. E., Thoreen C. C., Licklider L. J., Gygi S. P. (2003) Evaluation of multidimensional chromatography coupled with tandem mass spectrometry (LC/LC-MS/MS) for large-scale protein analysis: the yeast proteome. J. Proteome Res. 2, 43–50 [DOI] [PubMed] [Google Scholar]
- 21. Yang X., Dondeti V., Dezube R., Maynard D. M., Geer L. Y., Epstein J., Chen X., Markey S. P., Kowalak J. A. (2004) DBParser: web-based software for shotgun proteomic data analyses. J. Proteome Res. 3, 1002–1008 [DOI] [PubMed] [Google Scholar]
- 22. Schwanhausser B., Busse D., Li N., Dittmar G., Schuchhardt J., Wolf J., Chen W., Selbach M. (2011) Global quantification of mammalian gene expression control. Nature 473, 337–342 [DOI] [PubMed] [Google Scholar]
- 23. Cox J., Mann M. (2008) MaxQuant enables high peptide identification rates, individualized p.p.b.-range mass accuracies and proteome-wide protein quantification. Nat. Biotechnol. 26, 1367–1372 [DOI] [PubMed] [Google Scholar]
- 24. Song C., Ye M., Han G., Jiang X., Wang F., Yu Z., Chen R., Zou H. (2010) Reversed-phase-reversed-phase liquid chromatography approach with high orthogonality for multidimensional separation of phosphopeptides. Anal. Chem. 82, 53–56 [DOI] [PubMed] [Google Scholar]
- 25. Kanehisa M., Goto S. (2000) KEGG: kyoto encyclopedia of genes and genomes. Nucleic Acids Res. 28, 27–30 [DOI] [PMC free article] [PubMed] [Google Scholar]
- 26. Emanuele M. J., Elia A. E., Xu Q., Thoma C. R., Izhar L., Leng Y., Guo A., Chen Y. N., Rush J., Hsu P. W., Yen H. C., Elledge S. J. (2011) Global identification of modular cullin-RING ligase substrates. Cell 147, 459–474 [DOI] [PMC free article] [PubMed] [Google Scholar]
- 27. Liao H., Liu X. J., Blank J. L., Bouck D. C., Bernard H., Garcia K., Lightcap E. S. (2011) Quantitative proteomic analysis of cellular protein modulation upon inhibition of the NEDD8-activating enzyme by MLN4924. Mol Cell Proteomics 10, M111.009183. [DOI] [PMC free article] [PubMed] [Google Scholar]
- 28. Soucy T. A., Smith P. G., Milhollen M. A., Berger A. J., Gavin J. M., Adhikari S., Brownell J. E., Burke K. E., Cardin D. P., Critchley S., Cullis C. A., Doucette A., Garnsey J. J., Gaulin J. L., Gershman R. E., Lublinsky A. R., McDonald A., Mizutani H., Narayanan U., Olhava E. J., Peluso S., Rezaei M., Sintchak M. D., Talreja T., Thomas M. P., Traore T., Vyskocil S., Weatherhead G. S., Yu J., Zhang J., Dick L. R., Claiborne C. F., Rolfe M., Bolen J. B., Langston S. P. (2009) An inhibitor of NEDD8-activating enzyme as a new approach to treat cancer. Nature 458, 732–736 [DOI] [PubMed] [Google Scholar]
- 29. Lipkowitz S., Weissman A. M. (2011) RINGs of good and evil: RING finger ubiquitin ligases at the crossroads of tumour suppression and oncogenesis. Nat. Rev. Cancer 11, 629–643 [DOI] [PMC free article] [PubMed] [Google Scholar]
- 30. Peng B., Gu Y., Xiong Y., Zheng G., He Z. (2012) Microarray-assisted pathway analysis identifies MT1X & NFkappaB as mediators of TCRP1-associated resistance to cisplatin in oral squamous cell carcinoma. PLoS One 7, e51413. [DOI] [PMC free article] [PubMed] [Google Scholar]
- 31. Uchida F., Uzawa K., Kasamatsu A., Takatori H., Sakamoto Y., Ogawara K., Shiiba M., Bukawa H., Tanzawa H. (2013) Overexpression of CDCA2 in Human Squamous Cell Carcinoma: Correlation with Prevention of G1 Phase Arrest and Apoptosis. PLoS One 8, e56381. [DOI] [PMC free article] [PubMed] [Google Scholar]
- 32. Aguirre-Portolés C., Bird A. W., Hyman A., Canamero M., Perez de Castro I., Malumbres M. (2012) Tpx2 controls spindle integrity, genome stability, and tumor development. Cancer Res. 72, 1518–1528 [DOI] [PubMed] [Google Scholar]
- 33. Li D., Wei P., Peng Z., Huang C., Tang H., Jia Z., Cui J., Le X., Huang S., Xie K. (2013) The critical role of dysregulated FOXM1-PLAUR signaling in human colon cancer progression and metastasis. Clin. Cancer Res. 19, 62–72 [DOI] [PMC free article] [PubMed] [Google Scholar]
- 34. Luo Y., Robinson S., Fujita J., Siconolfi L., Magidson J., Edwards C. K., Wassmann K., Storm K., Norris D. A., Bankaitis-Davis D., Robinson W. A., Fujita M. (2011) Transcriptome profiling of whole blood cells identifies PLEK2 and C1QB in human melanoma. PLoS One 6, e20971. [DOI] [PMC free article] [PubMed] [Google Scholar]
- 35. Nabeyama A., Kurita A., Asano K., Miyake Y., Yasuda T., Miura I., Nishitai G., Arakawa S., Shimizu S., Wakana S., Yoshida H., Tanaka M. (2010) xCT deficiency accelerates chemically induced tumorigenesis. Proc. Natl. Acad. Sci. U.S.A. 107, 6436–6441 [DOI] [PMC free article] [PubMed] [Google Scholar]
- 36. Dong C., Wu Y., Wang Y., Wang C., Kang T., Rychahou P. G., Chi Y. I., Evers B. M., Zhou B. P. (2012) Interaction with Suv39H1 is critical for Snail-mediated E-cadherin repression in breast cancer. Oncogene 32, 1351–1362 [DOI] [PMC free article] [PubMed] [Google Scholar]
- 37. Kaliszan R., Wiczling P., Markuszewski M. J. (2004) pH gradient reversed-phase HPLC. Anal. Chem. 76, 749–760 [DOI] [PubMed] [Google Scholar]
- 38. Nakamura T., Kuromitsu J., Oda Y. (2008) Evaluation of comprehensive multidimensional separations using reversed-phase, reversed-phase liquid chromatography/mass spectrometry for shotgun proteomics. J. Proteome Res. 7, 1007–1011 [DOI] [PubMed] [Google Scholar]
- 39. Zhou F., Cardoza J. D., Ficarro S. B., Adelmant G. O., Lazaro J. B., Marto J. A. (2010) Online nanoflow RP-RP-MS reveals dynamics of multicomponent Ku complex in response to DNA damage. J. Proteome Res. 9, 6242–6255 [DOI] [PMC free article] [PubMed] [Google Scholar]
- 40. Vaquerizas J. M., Kummerfeld S. K., Teichmann S. A., Luscombe N. M. (2009) A census of human transcription factors: function, expression and evolution. Nat. Rev. Genet. 10, 252–263 [DOI] [PubMed] [Google Scholar]
- 41. Wu C. C., Yates J. R., 3rd (2003) The application of mass spectrometry to membrane proteomics. Nat. Biotechnol. 21, 262–267 [DOI] [PubMed] [Google Scholar]
- 42. D'Angiolella V., Donato V., Vijayakumar S., Saraf A., Florens L., Washburn M. P., Dynlacht B., Pagano M. (2010) SCF(Cyclin F) controls centrosome homeostasis and mitotic fidelity through CP110 degradation. Nature 466, 138–142 [DOI] [PMC free article] [PubMed] [Google Scholar]
- 43. Méndez J., Zou-Yang X. H., Kim S. Y., Hidaka M., Tansey W. P., Stillman B. (2002) Human origin recognition complex large subunit is degraded by ubiquitin-mediated proteolysis after initiation of DNA replication. Mol. Cell 9, 481–491 [DOI] [PubMed] [Google Scholar]
- 44. Rankin S., Ayad N. G., Kirschner M. W. (2005) Sororin, a substrate of the anaphase-promoting complex, is required for sister chromatid cohesion in vertebrates. Mol. Cell 18, 185–200 [DOI] [PubMed] [Google Scholar]
Associated Data
This section collects any data citations, data availability statements, or supplementary materials included in this article.