Abstract
Many reports have shown that autophagy has a role as both a promoter and inhibitor in tumor development. However, the mechanism of this paradox is unknown. Tumor development is a multistep process. Therefore, we investigated whether the role of autophagy in hepatocarcinoma formation depended on the stage of tumor development. Based on our results, autophagy inhibition by chloroquine had a tumor-promotive effect in the rat model with N-diethylnitrosamine-induced hepatocarcinogenesis in its dysplastic stage (Ds) and a tumor-suppressive effect in its tumor-forming stage (Ts). In the Ds, autophagy inhibition enhanced cell proliferation, DNA damage and inflammatory cytokines expression in liver. These changes were dependent on the upregulation of reactive oxygen species (ROS) that was resulted from autophagy inhibition, and ultimately accelerated the process of hepatocarcinogenesis. However, in the Ts, autophagy inhibition restrained tumor formation by decreasing tumor cell survival and proliferation. In this stage, autophagy inhibition led to excessive ROS accumulation in the tumor, which promoted cell apoptosis, and prominently suppressed tumor cell metabolism. Taken together, our data suggested that autophagy suppressed hepatocarcinogenesis in the Ds by protecting normal cell stability and promoted hepatocarcinogenesis in the Ts by supporting tumor cells growth. Autophagy always had a role as a protector throughout the process of hepatocarcinoma development.
Keywords: autophagy, hepatocarcinoma development, different stages, paradoxical role, ROS
Hepatocarcinoma is the sixth most frequently diagnosed cancer and the third leading cause of cancer mortality worldwide.1 Many studies have suggested that the major risk factor for hepatocarcinoma is chronic liver inflammation because of viral infection, alcohol consumption and toxic insults.2 Unfortunately, how the interaction between hepatocarcinoma risk factors and liver-protective mechanisms affects tumor development has not been fully clarified. Therefore, macroautophagy (autophagy hereafter), an important self-protective mechanism, has obtained increasing attention.
Autophagy is an evolutionarily conserved self-digestive mechanism, which involves many steps. These steps include: aggregation of double-membrane, formation of autophagosome that engulfs the targeted region, its fusion with lysosomes and digestion in autolysosomes.3 Under starvation or other stresses, autophagy is required for cell survival to eliminate the damaged cellular components and to maintain nutrition and energy homeostasis.4 Therefore, autophagy has a close relationship with many biological or pathological phenomena including carcinogenesis.5
Many studies have indicated that autophagy has a tumor-suppressive function. Heterozygous disruption of beclin1, a major regulator of mammalian autophagy, has been shown to promote the spontaneous cancer, including lymphomas, lung cancer and hepatocarcinoma.6, 7 Moreover, deletion of beclin1-binding proteins, including UVRAG8 and Bif-1,9 or other autophagy genes, such as atg4C,10 atg5 and atg7,11 also resulted in acceleration of tumor development. Besides tumor-suppressive function, autophagy has been reported to promote tumor development. Many recent studies have revealed that autophagy was essential for oncogene-mediated tumorigenesis,12, 13, 14 which seemingly raises a paradox. However, autophagy probably has different roles in different stages of tumor development, which is a multistep and complicated process.
Chloroquine (CQ), an old drug, is an effective and slightly toxic autophagy inhibitor, which has been used to explore cancer therapies targeting autophagy in clinical trials.15 In our study, rats were treated with CQ to inhibit autophagy in the dysplastic or tumor-forming stage (Ts) of N-diethylnitrosamine (DEN)-induced hepatocarcinoma development. The results suggested that autophagy prevented normal cell tumorization in the dysplastic stage (Ds) by inhibiting reactive oxygen species (ROS)-dependent hyperproliferation, DNA damage and expression of inflammatory cytokines. However, autophagy facilitated tumor formation in the Ts by supporting cell proliferation and decreasing cell apoptosis. In this period, autophagy reduced excessive ROS accumulation and supported cell metabolism in the tumor. These mechanisms could potentially contribute to the dual role of autophagy in the Ds and Ts of hepatocarcinoma development.
Results
Autophagy inhibition had a tumor-promotive effect in the Ds of hepatocarcinoma development and a tumor-suppressive effect in its Ts
In order to explore the effects of autophagy on the process of hepatocarcinoma development, we used a DEN-treated rat model. As a commonly used carcinogen, DEN could induce multiple liver tumors resembling human hepatocarcinoma in rats.16 We fed male Sprague–Dawley (SD) rats with drinking water containing 100 p.p.m. DEN17, 18 for 13 weeks, which was then replaced with normal water. At 17 weeks after initial administration of DEN, >90% of the rats developed tumor nodules (diameters ≥1 mm) in their livers (Supplementary Figure 1).When rats were fed with DEN water for only 9 weeks, mere hyperproliferative liver tissues were observed even at 23 weeks after the initial DEN administration (Supplementary Figure 2). However, when they were fed with DEN water for 10 weeks, tumor nodules were observed in 20% of rat livers (2 to 10) at 23 weeks (data not shown). Therefore, the 9th week was an important ‘cutoff point' in this model.
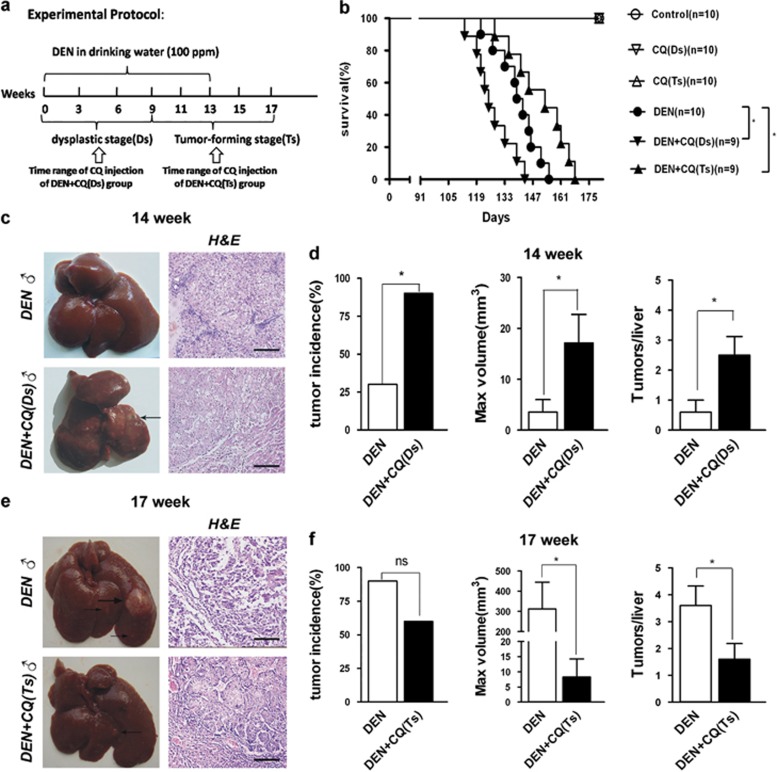
During the time interval between initial administration of DEN (0 week) and the time when DEN-treated rats developed visible hepatoma nodule (17th week), the time period from 0 to 9th week could be roughly considered as Ds of hepatocarcinoma development. Similarly, the time period from 10th to 17th week was considered as Ts. The autophagy inhibitor CQ was used to study different roles of autophagy in the Ds and Ts of DEN-induced hepatocarcinoma development. Besides DEN treatment group, we also used two combined treatment groups: DEN+CQ (Ds) and DEN+CQ (Ts). In addition to DEN administration, the rats of DEN+CQ (Ds) group were also given extra CQ by intraperitoneal (i.p.) injection once every 3 days during the Ds of DEN-induced hepatocarcinogenesis. Similarly, the DEN+CQ (Ts) group was treated with the same method during the Ts (Figure 1a).
Figure 1.
Autophagy inhibition promoted tumor formation in the Ds of hepatocarcinoma development and suppressed tumor formation in its Ts. (a) A diagram of experimental protocol. Rats were administrated DEN (100 p.p.m., 95 mg/l) in their drinking water for 13 weeks. The DEN water was replaced by normal water later. The DEN+CQ (Ds) group was given extra i.p. injection of CQ solution (50 mg/kg) once every 3 days in the Ds (weeks 0–9) of hepatocarcinoma development. The DEN+CQ (Ts) group was given CQ injection with the same method mentioned in the Ts (weeks 10–17). (b) Survival curves of DEN, DEN+CQ (Ds) and DEN+CQ (Ts) groups (*P<0.05). (c and e) Rat livers of DEN and DEN+CQ (Ds) groups at 14 weeks (c), or rat livers of DEN and DEN+CQ (Ts) groups at 17 weeks (e). Liver sections were stained with H&E. Arrow indicates tumor (bar: 100 μm). (d and f) Tumor incidence (left panel), max tumor volume (middle panel) and multiplicity (right panel) of DEN and DEN+CQ (Ds) groups at 14 weeks (d), or DEN and DEN+CQ (Ts) groups at 17 weeks (f). Data are mean±S.E.M. (n=10; NS, no significant difference; *P<0.05)
In a cohort of rats monitored for survival, DEN+CQ (Ds) group exhibited a shorter mean survival time as compared with that of the DEN-treated group. However, DEN+CQ (Ts) group showed a longer mean survival time as compared with that of the DEN-treated group (Figure 1b). Meanwhile, at 14 weeks, 90% of the rats in the DEN+CQ (Ds) group developed liver tumor nodules that revealed a typical hepatocarcinoma structure. The liver tumor incidence in the DEN-treated group was only 30% (Figures 1c and d, left panel). Furthermore, DEN+CQ (Ds) group exhibited a fivefold higher maximum volume of liver tumor nodules (17.1±5.6 versus 3.5±2.5 mm3) and a fourfold higher liver tumor multiplicity (2.5±0.6 versus 0.6±0.4) as compared with those of the DEN-treated group (Figure 1d, middle and right panels). Interestingly, at 17 weeks, although the liver tumor incidence was not significantly different between DEN-treated and DEN+CQ (Ts) groups (Figures 1e and f, left panel), DEN-treated group exhibited a 40-fold higher maximum volume of liver tumor nodules (312.0±132.9 versus 8.3±6.0 mm3) and a 2-fold higher liver tumor multiplicity (3.6±0.7 versus 1.6±0.6) as compared with those of the DEN+CQ (Ts) group (Figure 1f, middle and right panels).
The DEN+CQ-treated rats, which were injected with CQ throughout the whole process of hepatoma development (from 0 to 17th week), had similar tumor incidence, maximum volume of tumor nodules and tumor multiplicity as compared with those of the DEN-treated group at 14 and 17 weeks (data not shown). In addition, tumor nodules were absent in CQ-treated group at 14 and 17 weeks (data not shown).
All the above data demonstrated that autophagy inhibition had a tumor-promotive effect in the Ds of DEN-induced rat hepatocarcinoma development and a tumor-suppressive effect in its Ts.
Autophagy inhibition promoted cell proliferation, DNA damage and expression of inflammatory cytokines in the Ds of hepatocarcinoma development
The Ds of tumor development is consider as a process of chronic tissue damage containing a cycle of cell death and death-driven compensatory proliferation.19 As autophagy is regarded as a cellular self-protective mechanism,4 we attempted to study how autophagy inhibition affects the Ds of hepatocarcinoma development and whether autophagy inhibition promotes DEN-induced cell death and subsequent death-driven compensatory proliferation.
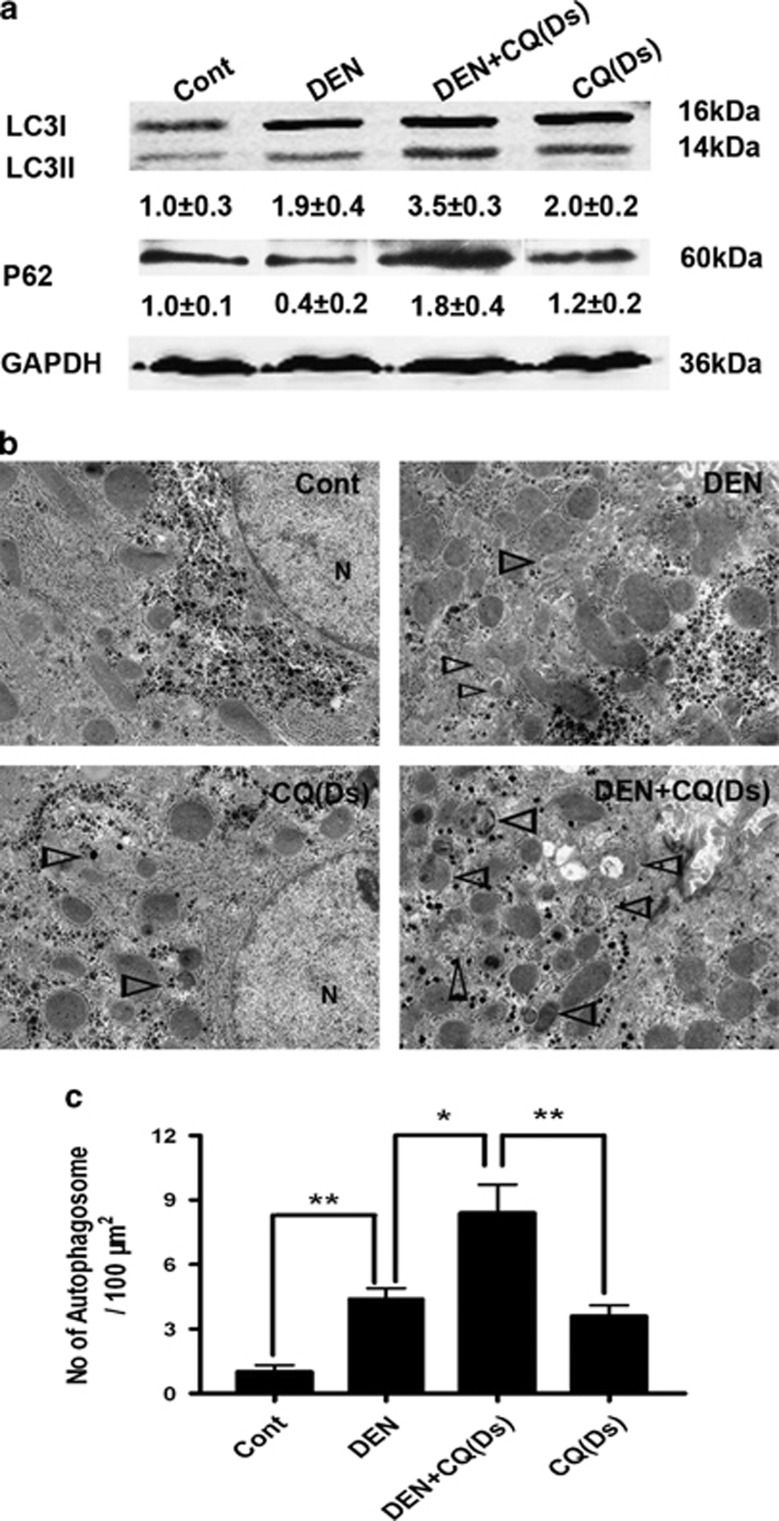
We verified the impact of CQ on autophagy in the Ds of DEN-induced rat hepatocarcinoma development. At 9 weeks after the initial DEN administration, we tested the effects of DEN on isoform conversation of LC3, an indicator of autophagosome formation, and on the progressive reduction of p62/SQSTM1, a ubiquitin-binding scaffold protein selectively degraded by autophagy. Immunoblot analysis suggested that the LC3-II level was increased by DEN treatment, while the p62 level was decreased (Figure 2a). Meanwhile, electron microscopy (EM) analysis revealed an obvious gathering of autophagosomes following DEN treatment (Figures 2b and c). Co-treatment of rats with CQ further increased the level of LC3-II and the number of autophagosomes, but decreased the degradation of p62 (Figures 2a and c). These results suggested that CQ inhibited autophagic flux in the Ds of DEN-induced rat hepatocarcinoma development.
Figure 2.
CQ inhibited the autophagic flux in the Ds of rat hepatocarcinoma development. (a) Four groups of wild-type rats were treated as indicated. Nine weeks after the initial DEN administration, liver fractions were analyzed by immunoblot assay. Semiquantitative densitometry analysis (versus GAPDH) of LC3-II and p62 was performed for each sample. Data are shown as mean±S.E.M. (n=3). (b) The liver samples were processed for EM. Triangles denote autophagosomes (N, nucleus; bar: 2 μm). (c) The number of autophagosomes per 100 μm2 was determined. Data are mean±S.E.M. (n=5; *P<0.05; **P<0.01)
However, further examination showed that the serum levels of alanine aminotransferase (ALT) and aspartate aminotransferase (AST), two classical markers of liver injury, had no significant difference between DEN and DEN+CQ (Ds) groups at 9 weeks after the initial DEN administration (Supplementary Figure 3a). Furthermore, DEN+CQ (Ds) group did not show higher apoptosis in liver cells as compared with that of the DEN-treated group as determined by immunostaining for actived-caspase 3 and Tunel staining (Supplementary Figures 3b and c). Histological analysis also suggested that autophagy inhibition did not prominently affect the level of necrosis in the liver cells in DEN-treated rats at 9 weeks after the initial DEN administration (data not shown).
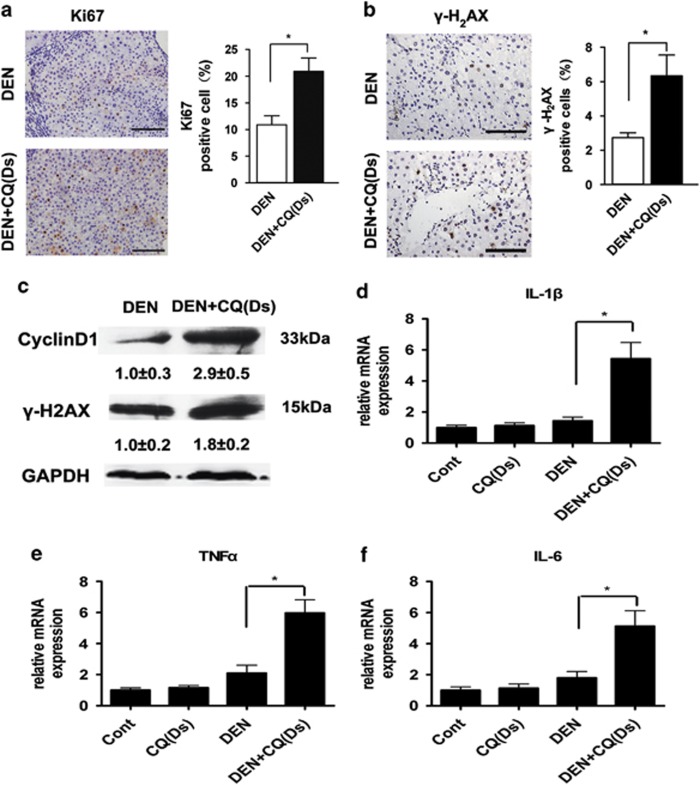
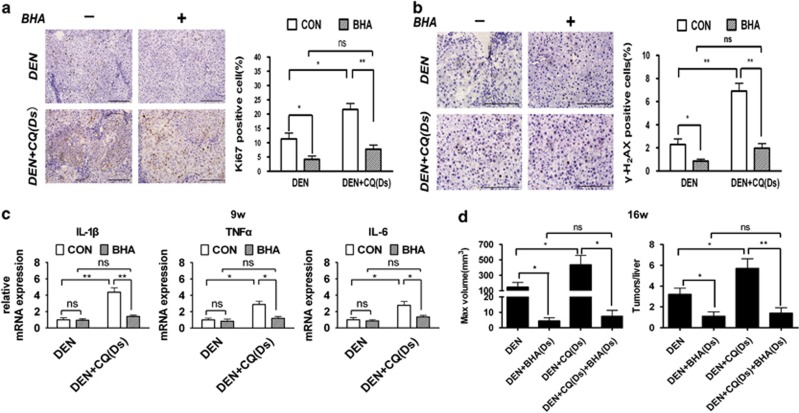
Surprisingly, although autophagy inhibition did not affect the DEN-induced cell death, rats of DEN+CQ (Ds) group contained more proliferating (Ki67-positive) liver cells as compared with those of the DEN-treated group (Figure 3a). In addition, immunostaining of phospho-histone H2AX (γ-H2AX) showed a rapid response to DNA damage. This demonstrated that the number of DNA-damaged (γ-H2AX-positive) cells were significantly increased in the rat livers of DEN+CQ (Ds) group as compared with those of the DEN-treated group (Figure 3b). Immunoblot analyses also demonstrated that rat livers of DEN+CQ (Ds) group had a higher cyclin D1 level, which was another cell proliferation indicator, as well as a higher γ-H2AX level than those of the DEN-treated group (Figure 3c). The mRNA levels of inflammatory cytokines (IL-1β, TNFα and IL-6) were prominently increased in the rat livers of DEN+CQ (Ds) group relative to DEN-treated group (Figures 3d–f). IL-1β, TNFα and IL-6 were crucial pro-inflammatory mediators and had important roles in hepatocarcinogenesis.20, 21 In addition, CQ treatment alone had no obvious impact on the cell proliferation and DNA damage (Supplementary Figure 4) and inflammatory cytokines expression (Figures 3d–f) in normal rat liver.
Figure 3.
Autophagy inhibition promoted cell proliferation, DNA damage and expression of inflammatory cytokines in the Ds of hepatocarcinoma development. (a and b) Immunostaining for Ki67 (a, left) and γ-H2AX (b, left panel) in the rat livers of the DEN-treated and DEN+CQ (Ds) groups at 9 weeks after the initial DEN administration (bar: 100 μm). Percentages of positive cells are shown in the graphs (right panel). Data are mean±S.E.M. (n=5; *P<0.05). (c) Cell lysates that were obtained from rat livers of DEN and DEN+CQ (Ds) groups were immunoblotted with the indicated antibodies (n=4) at 9 weeks after the initial DEN administration. (d–f) Rats were treated as indicated, and total liver mRNAs were extracted at 9 weeks after the initial DEN administration. The expressions of IL-1β (d), TNFα (e) and IL-6 (f) mRNAs were semiquantified (versus β-actin). Data are mean±S.E.M. (n=5; *P<0.05)
Our data demonstrated that autophagy inhibition did not significantly affect the DEN-induced cell death, but promoted subsequent cell proliferation, DNA damage and expression of inflammatory cytokines in the Ds of hepatocarcinoma development.
ROS accumulation resulting from autophagy inhibition promoted the Ds of DEN-induced hepatocarcinoma development
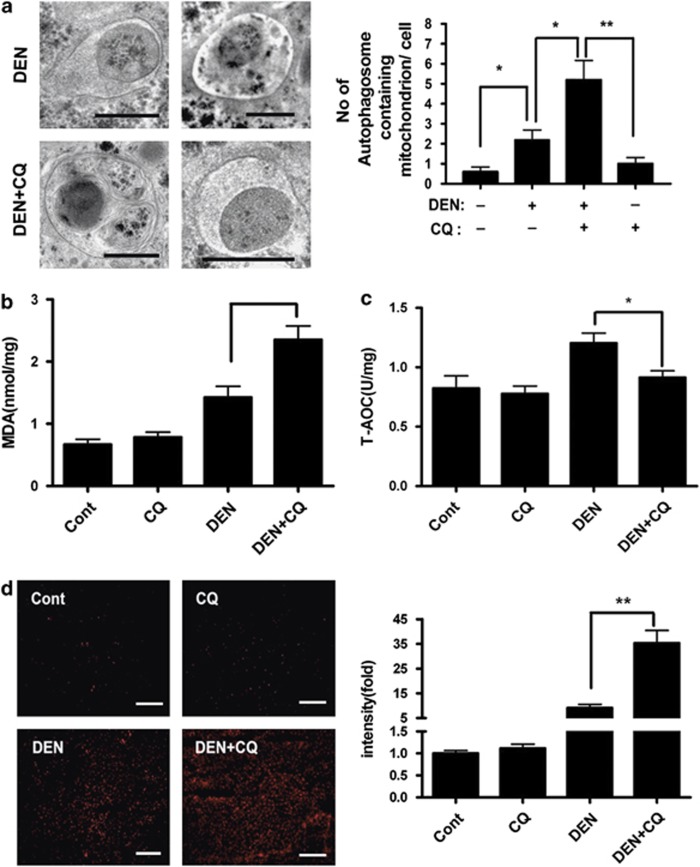
We further explored how autophagy inhibition affected these factors in the DEN-treated rat livers. Previous reports suggested that DEN administration resulted in mitochondrial damage in the liver cells.22 The damaged mitochondria were the main source of ROS production, which were cleared by mitophagy.23, 24 One week after the initial DEN administration, EM analysis was performed and showed that many autophagosomes in the liver cells of DEN-treated rats contained mitochondria, which were further accumulated by co-treatment with CQ (Figure 4a). Meanwhile, rat livers of DEN+CQ (Ds) group had a higher content of malondialdehyde (MDA), which was used to assess ROS-induced lipid peroxidation, as well as a lower content of total antioxidative capacity (T-AOC), which represented all the enzyme and non-enzyme antioxidants in the body, as compared with those of the DEN-treated group (Figures 4b and c).
Figure 4.
Autophagy inhibition enhanced ROS accumulation in the DEN-treated rat livers. (a) Rats were treated as indicated. Liver sections were processed for EM at 1 week after the initial DEN administration. Representative liver EM images of autophagosomes containing mitochondrion were shown (left panel) and data were quantified (right panel) (bar: 500 nm). Data are shown as mean±S.E.M. (n=3; *P<0.05; **P<0.01). (b and c) Lipid peroxidation and oxidation resistance were examined at 1 week after the initial DEN administration by measuring MDA (b) and T-AOC (c) in liver homogenates, respectively. Data are mean±S.E.M. (n=5; *P<0.05). (d) Rats were treated as indicated. At 1 week after the initial DEN administration, liver cryosections were incubated with 2 μM MitoSOX Red mitochondrial superoxide indicator for 30 min at 37 °C. Staining positive cells were identified by fluorescence microscopy (left panel) and quantified by Image J software (right panel) (bar: 100 μm). Data are mean±S.E.M. (n=3; **P<0.01)
The changes in MDA and T-AOC level suggested that autophagy inhibition increased the oxidative stress in the DEN-treated rat livers. To confirm this, we stained freshly frozen liver sections with MitoSOX Red mitochondrial superoxide indicator at 1 week after the initial DEN administration. More extensive fluorescence was observed in the rat livers of DEN+CQ (Ds) group as compared with those of the DEN-treated group (Figure 4d). These results showed that autophagy inhibition enhanced the ROS accumulation of liver cells in the DEN-treated rats.
To investigate whether ROS mediated the influence of autophagy inhibition on the DEN-treated rat livers and even the Ds of hepatocarcinoma development, we added antioxidant butylated hydroxyanisole (BHA) to rat chow. The 8-hydroxy-2-deoxyguanosin (8-OHdG) was used as an indicator of DNA oxidative damage. At 9 weeks after the initial DEN administration, rat livers of DEN+CQ (Ds) group accumulated more ROS and DNA oxidative damage (8-OHdG-positive cells) as compared with those of the DEN-treated group. The BHA decreased ROS accumulation and DNA oxidative damage in the DEN-treated or DEN+CQ (Ds) groups. Moreover, the level of ROS accumulation and the proportion of cells with DNA oxidative damage had no prominent difference between rat livers of DEN+BHA (Ds) and DEN+CQ (Ds) +BHA (Ds) groups (Supplementary Figure 5). In both DEN-treated and DEN+CQ (Ds) groups, the rats that were kept on the BHA-supplemented diet, showed a marked reduction in cell proliferation and DNA damage. Most importantly, rat livers of DEN+BHA (Ds) and DEN+CQ (Ds) +BHA (Ds) groups were not different in terms of cell proliferation and DNA damage (Figures 5a and b). The rat livers of DEN+CQ (Ds) group showed higher mRNA expression of IL-1β, TNFα and IL-6 as compared with those of the DEN-treated group, and the BHA administration reversed this trend (Figure 5c). Further studies displayed that at 16 weeks after the initial DEN administration, both maximum tumor volume and tumor multiplicity had no marked difference in the livers of the DEN+BHA (Ds) and DEN+CQ (Ds) +BHA (Ds) groups (Figure 5d). In addition, CQ (Ds), BHA (Ds) and BHA (Ds) +CQ (Ds) treatments had no significant effect on rat livers (data not shown). To rule out any potential side effect of BHA treatment, we used another antioxidant, N-acetyl cysteine, to confirm these findings and obtained similar results (Supplementary Figure 6). These data demonstrated that the mechanism by which autophagy inhibition promoted Ds of hepatocarcinoma development depended on ROS accumulation in liver cells.
Figure 5.
Antioxidant restrained tumor-promotive effect of autophagy inhibition in the Ds of hepatocarcinoma development. (a–e) Rats were fed either with BHA-supplemented (0.5%) or regular chow from 2 days before DEN administration for 9 weeks. The BHA-supplemented chow was replaced by regular chow. (a and b) Rats were treated as indicated. Immunostaining for Ki67 (a, left panel) and γ-H2AX (b, left panel) in the rat livers at 9 weeks (bar: 100 μm). Percentages of positive cells are shown in the graphs (right panel). Data are mean±S.E.M. (n=5; NS, no significant difference; *P<0.05; **P<0.01). (c) Rats were treated as indicated, and total liver mRNAs were extracted at 9 weeks. The expressions of IL-1β, TNFα and IL-6 mRNAs were semiquantified (versus β-actin). Data are mean±S.E.M. (n=5; *P<0.05; **P<0.01). (d) Rats were treated as indicated, and then killed at 16 weeks. Maximum tumor volume (left panel) and multiplicity are shown. Data are mean±S.E.M. (n=10; *P<0.05; **P<0.01)
Autophagy inhibition reduced tumor cell proliferation and survival in the Ts of hepatocarcinoma development
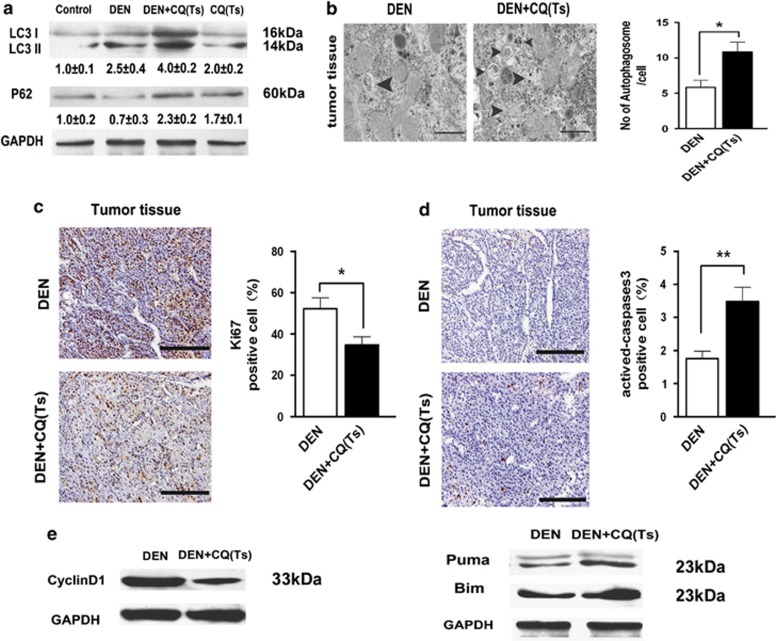
Our results showed that the CQ treatment had a tumor-suppressive effect in the Ts. To investigate its mechanism of action, we verified the impact of CQ on autophagy level of hepatocarcinoma cells. Immunoblot analysis showed that rats of DEN+CQ (Ts) group had more LC3II and p62 accumulation in their hepatocarcinoma cells as compared with those of the DEN-treated group at 17 weeks (Figure 6a). Meanwhile, EM analysis demonstrated that the CQ treatment caused more autophagosome accumulation in the hepatocarcinoma cells (Figure 6b). These data exhibited that CQ was able to inhibit autophagy level of hepatocarcinoma cells in Ts of hepatocarcinoma development.
Figure 6.
Autophagy inhibition suppressed tumor cell proliferation and promoted tumor cell apoptosis in the Ts of hepatocarcinoma development. (a) Four groups of rats were treated as indicated. At 17 weeks, liver tumor tissues of DEN and DEN+CQ (Ts) groups and liver tissues of normal and CQ (Ts)-treated rats were analyzed by immunoblot assay. Semiquantitative densitometry analysis (versus GAPDH) of LC3-II and p62 was performed for each sample. Data are mean±S.E.M. (n=3). (b) Liver tumor tissues of DEN and DEN+CQ (Ts) groups were processed for EM at 17 weeks. Triangles denote autophagosomes (bar: 1 μm). The number of autophagosomes per cell was determined. Data are mean±S.E.M. (n=3; *P<0.05). (c and d) Immunostaining for Ki67 (c) and actived-caspase 3 (d) in the liver tumor tissues of DEN and DEN+CQ (Ts) groups at 17 weeks (bar: 100 μm). Percentages of positive cells are shown in the graphs (right panel). Data are mean±S.E.M. (n=5; *P<0.05; **P<0.01). (e) Cell lysates that were obtained from liver tumor tissues of DEN and DEN+CQ (Ts) groups at 17 weeks were immunoblotted with the indicated antibodies (n=3)
We further tested the mechanism of autophagy inhibition that affected the hepatocarcinoma cells. Examination of cell proliferation by immunostaining for Ki67 showed that autophagy inhibition remarkably decreased the proliferative level of tumor tissue (Figure 6c). On the other hand, the level of apoptosis (actived-caspase 3-positive) in hepatocarcinoma nodules showed a prominent increase in the rats of DEN+CQ (Ts) group as compared with the ones in the DEN-treated group (Figure 6d). Immunoblot analysis demonstrated that rat livers of DEN+CQ (Ts) group had a lower level of cyclin D1 and higher levels of Puma and Bim, as compared with those of the DEN-treated group (Figure 6e). The Puma and Bim are two important pro-apoptotic factors. These findings suggested that, during the Ts of hepatocarcinoma development, autophagy inhibition reduced cell proliferation and promoted apoptosis in the tumor cells.
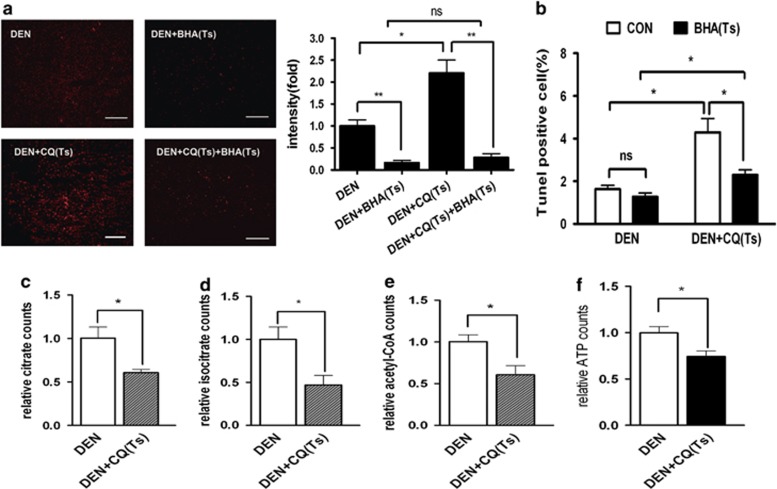
We further attempted to investigate how autophagy inhibition impacted the hepatocarcinoma cell proliferation and apoptosis. As it has been reported in the literature, moderate ROS accumulation promotes cell proliferation, whereas excessive ROS accumulation could lead to cell death.25 Therefore, we examined whether autophagy inhibition caused ROS accumulation of hepatocarcinoma cells and whether this accumulation exerted any effects on hepatocarcinoma cell apoptosis. The rats of DEN+CQ (Ts) group had more ROS accumulation in the hepatocarcinoma tissue as compared with that of the rats of DEN-treated group as demonstrated by MitoSOX staining (Figure 7a).
Figure 7.
Autophagy inhibition resulted in ROS-induced apoptosis and suppressed metabolism in the liver tumor cells. (a) Rats were treated as indicated. At 17 weeks, liver tumor sections were incubated with 2 μM MitoSOX Red mitochondrial superoxide indicator for 30 min at 37 °C. Positively stained cells were identified by fluorescence microscopy (left panel) and quantified by Image J software (right panel) (bar: 100 μm). Data are mean±S.E.M. (n=3; NS, no significant difference; *P<0.05; **P<0.01). (b) Rats were treated as indicated. Percentages of Tunel-positive cells in the liver tumors of these rats are shown in the graph. Data are mean±S.E.M. (n=3; *P<0.05. (c–f) The levels of citrate (c), isocitrate (d), acetyl-CoA (e) and ATP (f) in the liver tumors of DEN and DEN+CQ (Ts) groups. Data are mean±S.E.M. (n=3; *P<0.05)
Feeding special chow with antioxidant BHA had no obvious impact on hepatocarcinoma cells of the rats in the DEN-treated group, but it significantly inhibited hepatocarcinoma cell apoptosis (Tunel staining-positive) in the rats of DEN+CQ (Ts) group (Figure 7b). However, even when they were fed with BHA-supplemented chow, hepatocarcinoma cells of the rats in DEN-treated group had more apoptotic cells than those in the DEN+CQ (Ts) group (Figure 7b). This result showed that when autophagy was inhibited, ROS accumulation was an important reason but not the only one for the increase in hepatocarcinoma cell apoptosis.
Autophagy is considered as a source of biosynthetic and energy generating substrates especially in starvation.26 Meanwhile, in the nutrition-deficient tumor microenvironment, tumor cells need adequate metabolic level to support survival and hyperproliferation.27 Therefore, we examined whether autophagy inhibition impaired hepatocarcinoma cell metabolism in Ts of hepatocarcinoma development. Tricarboxylic acid (TCA) cycle has a central role in cell metabolism. TCA intermediates, citrate, isocitrate and acetyl-CoA, are also the key factors of many biosynthetic pathways. Our results suggested that TCA level was reduced in the hepatocarcinoma cells of rats in the DEN+CQ (Ts) group as compared with those of the DEN-treated group (Figures 7c–e). Meanwhile, hepatocarcinoma cells of the DEN+CQ (Ts) group showed a lower ATP level than those of the DEN-treated group (Figure 7f). In addition, CQ (Ts) treatment had no significant effect on the levels of citrate, isocitrate, acetyl-CoA and ATP in the normal rat livers (Supplementary Figures 7a–d).
These results showed that in the hepatocarcinoma cells, autophagy inhibition caused prominent metabolism suppression, which could suppress cell proliferation and promote cell death.28 The levels of these three TCA intermediates as well as ATP had no remarkable difference in the livers of DEN-treated and DEN+CQ (Ds) groups at 9 weeks after initial DEN treatment. These data showed that, unlike the Ts of hepatocarcinoma development, autophagy inhibition had no significant effect on metabolism of liver cells in the Ds of hepatocarcinoma development (Supplementary Figures 7e–h).
Discussion
Autophagy is considered to have dual role in tumor development.29 Many researchers attempted to illustrate the underlying basis of this complexity. Besides tumor type and context, multiple steps involved in the process of tumor development could be another possible factor to explain the contradictory role of autophagy in tumors. In this study, we attempted to explore the different influences of autophagy on the Ds and Ts of hepatocarcinoma development.
In the liver, DEN is metabolized into an alkylating agent, which could induce DNA damage. DNA damage is the main cause of mutation accumulation, which often results in tumorigenesis.30 The DNA damage response often initiates cell cycle arrest, DNA repair or apoptosis, all of which act as barriers to tumorigenesis.31
However, our results suggested that autophagy inhibition not only aggravated the DEN-induced DNA damage but also promoted liver cell proliferation in the Ds of hepatocarcinogenesis. The concurrent increase in cell proliferation and DNA damage led to more DNA mutation accumulation and genomic instability of liver cells. Meanwhile, autophagy inhibition increased the expression of inflammatory cytokines IL-1β, TNFα and IL-6. IL-1β, an important pro-inflammatory cytokine, triggers inflammation and its polymorphism has close association with hepatocarcinoma development.20, 32 Both TNFα and IL-6 promoted hepatocarcinogenesis through different pathways.33 All of these changes due to autophagy inhibition contribute to the transformation from a normal cell to a tumor cell.
Autophagy inhibition caused further ROS accumulation in the DEN-treated liver cells, especially mitochondrial ROS. The ROS accumulation has been observed in many autophagy-deficient models. However, these studies were mainly focused on DNA oxidative damage and cell death.24 In fact, ROS has been reported to have impacts on the expression of many tumorigenesis-associated genes, which enhances cell proliferation or resists cell apoptosis, such as JNK and STAT3.25 On the other hand, ROS acts as a signal molecule to enhance inflammatory cytokine IL-1β production by inflammasome NLRP3-dependent pathway.34 Moreover, ROS accumulation triggers TNFα and IL-6 production by activating MAPK pathway.35 Our results showed that during the Ds of hepatocarcinoma development, ROS accumulation had a crucial role in the tumor-promotive effect of autophagy inhibition.
The Ts of hepatocarcinoma development is different from its Ds. Compared with normal cells, tumor cells have an increased metabolic activity, which supports their proliferative capacity. The increase in metabolic activity contributes to mitochondrial dysfunction, which results in more ROS production. This leads to a higher ROS level in tumor cells as compared with normal cells.36, 37 Inhibition of autophagy in the tumor causes excessive ROS accumulation, followed by p53 activation, further mitochondrial dysfunction, severe DNA damage and ultimately cell apoptosis.38
On the other hand, along with tumor development, tumor cells need to overcome many obstacles in their unique microenvironments, such as limited nutrition. Under nutrition-deficient condition, autophagy contributes to tumor maintenance by propelling cellular components recycle to support cell metabolism.27 The metabolic needs of proliferating cells include enough ATP and numerous macromolecules, such as proteins, nucleotides, fatty acids and membrane lipids. Autophagy degrades macromolecules and organisms in order to make up for the substrate deficiency in the process of energy generating and biosynthetic pathways, such as TCA cycle.26 Metabolic inhibition in starvation has prominent effect on the survival of the tumor cells and xenograft tumor growth.13, 39 The importance of autophagy for tumor growth results in ‘autophagy addiction' in the Ts of hepatocarcinoma development.
Autophagy inhibition mainly impacts the normal cells within a relatively suitable microenvironment during the Ds while it affects the tumor cells within a harsh microenvironment during the Ts. The difference in the microenvironments is an important reason, which leads to the different effects of autophagy inhibition in normal cells versus tumor cells. Autophagy inhibition did not affect the metabolism of normal cells in a nutrient-sufficient microenvironment (Supplementary Figures 7 and 8), but prominently suppressed the metabolism of tumor cells in a nutrient-deprived microenvironment (Figure 7).
Although ROS accumulation might activate pro-proliferative signal pathway in both the Ds and Ts, metabolism inhibition resulting from autophagy inhibition still restrains the increase in tumor cell proliferation. It caused the reduction of tumor cell proliferation while normal cell proliferation was promoted by ROS-mediated signal pathway under material- and energy-sufficient conditions. This might be the reason that autophagy inhibition exerted opposite influences on cell proliferation during the Ds and Ts.
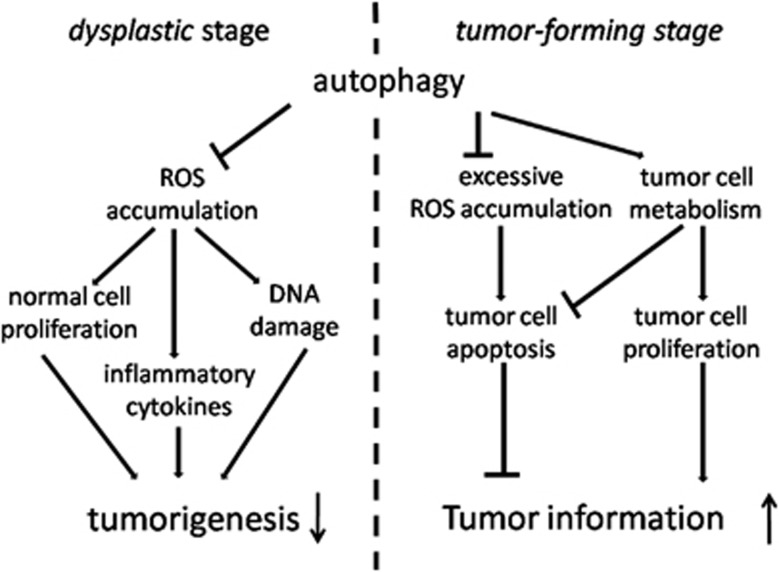
In brief, our study provided a direct evidence to support the model that autophagy had a tumor-suppressive role in the Ds and a tumor-promotive role in the Ts of hepatocarcinoma development (Figure 8). In the Ds, autophagy mainly helped normal cells to keep homeostasis and prevent mutation. However, in the Ts, autophagy mainly supported hepatocarcinoma cell survival and growth in harsh conditions.
Figure 8.
Autophagy had dual role in the process of hepatocarcinoma development. In the Ds and Ts of hepatocarcinoma development, autophagy exerted different effects. In the Ds, autophagy suppressed tumorigenesis by inhibiting ROS accumulation, which resulted in concurrent increases of cell proliferation, DNA damage and inflammatory cytokines. However, in the Ts, autophagy promoted tumor formation by supporting cell proliferation and resisting cell apoptosis in tumor. In this period, autophagy inhibited excessive ROS accumulation of tumor cells, which led to cell apoptosis, and maintained tumor cell metabolism, which had pro-proliferative and anti-apoptotic properties
From the other perspective, autophagy could protect normal cell homeostasis in the Ds and tumor cell tumorigenicity in the Ts. Autophagy is always a protecting mechanism during the process of hepatocarcinoma development. This model could offer a new insight into our understanding of how autophagy affects hepatocarcinoma development and will contribute to the appropriate application of anti-autophagy cancer therapy. Meanwhile, to further confirm the role of autophagy in tumorigenesis, the temporal and adjustable autophagy inhibition studies in animal models are necessary.
Materials and Methods
DEN and CQ rat models
Male SD rats (10- to 12-week old, weighing 220–250 g) were obtained from the Shanghai Experimental Center, Chinese Science Academy, Shanghai and were maintained at an animal facility under pathogen-free conditions. All animals received humane care according to the animal protocols approved by the Second Military Medical University Animal Care Committee.In order to induce hepatocarcinoma, 100 p.p.m. (95 mg/l) DEN (Sigma-Aldrich, St. Louis, MO, USA) was added to the drinking water of male rats for 13 weeks. The DEN water was then replaced by normal diluter water. For autophagy inhibition, rats received 50 mg/kg body weight CQ (Sigma-Aldrich), dissolved in physiological saline solution, by i.p. injection once every 3 days. The rats of DEN+CQ (Ds) group received CQ treatment in the Ds (0–9 weeks) of DEN-induced hepatocarcinoma development, and the rats of DEN+CQ (Ts) group received CQ treatment in the Ts (10–17 weeks). Some rats were killed at 14 and 17 weeks and others were kept to be observed for their survival times. Liver tumors were measured with electronic calipers and counted (diameters ≥1 mm). Tumor volumes were calculated by the following formula: volume=a × b2/2, where ‘a' was the diameter at the widest point of the tumor and ‘b' was the minimal diameter.
Liver sections were snap-frozen in liquid nitrogen for protein preservation, soaked in RNALater (Qiagen GmbH, Hilden, Germany) for RNA extraction, and preserved in 10% neutral-buffered formalin for histopathological analysis and immunohistochemistry assay. The blood was collected and serum was separated for biochemical analysis.
Immunohistochemistry and Tunel staining
The paraffin-embedded liver tissues were stained with hematoxylin and eosin (H&E) for analysis of morphologic changes. The primary immunohistochemical antibodies included: Ki67, 8-OHdG (both from Abcam, Cambridge, UK), actived-caspase 3 (Bioworlde Technology, St. Louis, MN, USA) and γ-H2AX (Cell Signaling Technology, Beverly, MA, USA). Tunel staining (Calbiochem, La Jolla, CA, USA) was used to assess the apoptosis level of paraffin-embedded fraction slides, according to the manufacturer's instructions.
Western blotting
The whole-cell lysates were subjected to SDS–PAGE. The blots were incubated with desired primary antibodies, which included anti-LC3 (Novus Biologicals, Littleton, CO, USA), anti-p62, anti-γ-H2AX, anti-Puma and anti-Bim (all from Cell Signaling Technology), anti-cyclin D1 (Bioworlde Technology), and then with anti-rabbit IgG peroxidase-conjugated secondary antibody (Bioworlde Technology) and chemiluminescent substrates. Hybridization with anti-GAPDH (Bioworlde Technology) was used to confirm equal protein loading.
Real-time quantitative polymerase chain reaction (qPCR)
Total RNAs were extracted from organs using Trizol Reagent (Invitrogen, Carlsbad, CA, USA), and were further treated with RNase-free DNase (Promega, Madison, WI, USA) to deplete residual DNA. Complementary DNA was prepared using oligo dT18-primers and MMLV reverse transcriptase (Promega). qPCR was performed using an Mx4000 system (Stratagene, La Jolla, CA, USA). The specific primers used to analyze gene expression were as follows: IL-1β, forward 5′-CTCTCCAGTCAGGCTTCCTTGT-3′, reverse 5′-CAGGTCATTCTCCTCACTGTCG-3′ TNFα, forward 5′-CCAGACCCTCACACTCAGATCA-3′, reverse 5′-TCCGCTTGGTGGTTTGCTA-3′ IL-6 forward 5′-TAGAGTCACAGAAGGAGTGGCTAAG-3′, reverse 5′-TCTGACCACAGTGAGGAATGTCCAC-3′. Fold change in gene expression was determined by normalizing to endogenous β-actin, which primer as follows: forward 5′-CTCCATCCTGGCCTCGCTGT-3′, reverse 5′-GCTGTCACCTTCACCGTTCC-3′.
Biochemical analysis
Serum ALT and AST levels were determined using a Fuji DRICHEM 55500 V (Fuji Medical System, Tokyo, Japan) according to the manufacturer's instructions. The levels of MDA, T-AOC, ATP (all from Nanjing Jiancheng Bioengineering Institute, Nanjing, China), citrate, isocitrate and acetyl-CoA (all from Biovision, Mountain View, CA, USA) were measured using the assay kits, according to the manufacturer's instructions. The T-AOC was a representative of enzyme and non-enzyme antioxidant in the body. These antioxidants reduced the ferric ion (Fe3+) to ferrous ion (Fe2+). The latter combined with phenanthroline and produced a stable chelate, which could be measured by spectrophotography at 520 nm.
ROS examination
To examine accumulation of superoxide anions, freshly prepared frozen liver sections were incubated with 2 μM MitoSOX Red mitochondrial superoxide indicator (Invitrogen) for 30 min at 37 °C. Then they were observed by fluorescence microscopy and quantified with Image J software (US National Institutes of Health, Bethesda, MD, USA).
Statistical analysis
Data are presented as mean±S.E.M. Differences were analyzed by the Student's t-test and one-way ANOVA. Tumor incidence (%) was analyzed by Fisher's exact test. Survival curves were analyzed by log-rank test. A P-value of <0.05 was considered statistically significant. Statistical analyses were performed with GraphPad Prism 5.0 software (Graphpad Software, San Diego, CA, USA).
Acknowledgments
This project was supported by Key Basic Research Project of China (Grant NO. 2011CB966200, 2010CB945600, 2012CBA01303, 2011CB965100); Key project of National Natural Science Foundation of China (Grant NO. 81030041); National Natural Science Foundation of China (Grant NO. 31171321, 81101622, 81201584); Special Funds for National key Sci-Tech Sepcial Project of China (Grant NO.2012ZX10002-016, 2012ZX10002011-011); Shanghai Science and Technology Committee (Grant NO. 10ZR1439600, 11ZR1449500, 12431900802, 12ZR1454200, 11nm0504700, 09QA1407200); Shanghai Municipal Health Bureau (Grant NO. XYQ2011044, 20114004) and Science Fund for Creative Research Groups, NSFC, China (Grant NO. 30921006).
Glossary
- CQ
chloroquine
- DEN
diethylnitrosamine
- ROS
reactive oxygen species
- SD
Sprague–Dawley
- i.p.
intraperitoneal injection
- Ds
dysplastic stage
- Ts
tumor-forming stage
- H&E
hematoxylin and eosin
- qPCR
quantitative polymerase chain reaction
- ALT
alanine aminotransferase
- AST
aspartate aminotransferase
- γ-H2AX
phospho-histone H2AX
- MDA
malondialdehyde
- T-AOC
total antioxidative capacity
- EM
electron microscope
- BHA
butylated hydroxyanisole
- TCA
tricarboxylic acid
The authors declare no conflict of interest.
Footnotes
Supplementary Information accompanies the paper on Cell Death and Disease website (http://www.nature.com/cddis)
Edited by A Finazzi-Agro′
Supplementary Material
References
- Jemal A, Bray F, Center MM, Ferlay J, Ward E, Forman D. Global cancer statistics. Cancer J Clin. 2010;61:69–90. doi: 10.3322/caac.20107. [DOI] [PubMed] [Google Scholar]
- Bosch FX, Ribes J, Diaz M, Cleries R. Primary liver cancer: worldwide incidence and trends. Gastroenterology. 2004;127 (5 Suppl 1:S5–S16. doi: 10.1053/j.gastro.2004.09.011. [DOI] [PubMed] [Google Scholar]
- Levine B, Klionsky DJ. Development by self-digestion: molecular mechanisms and biological functions of autophagy. Dev Cell. 2004;6:463–477. doi: 10.1016/s1534-5807(04)00099-1. [DOI] [PubMed] [Google Scholar]
- Mizushima N. Autophagy: process and function. Genes Dev. 2007;21:2861–2873. doi: 10.1101/gad.1599207. [DOI] [PubMed] [Google Scholar]
- White E, DiPaola RS. The double-edged sword of autophagy modulation in cancer. Clin Cancer Res. 2009;15:5308–5316. doi: 10.1158/1078-0432.CCR-07-5023. [DOI] [PMC free article] [PubMed] [Google Scholar]
- Yue Z, Jin S, Yang C, Levine AJ, Heintz N. Beclin 1, an autophagy gene essential for early embryonic development, is a haploinsufficient tumor suppressor. Proc Natl Acad Sci USA. 2003;100:15077–15082. doi: 10.1073/pnas.2436255100. [DOI] [PMC free article] [PubMed] [Google Scholar]
- Qu X, Yu J, Bhagat G, Furuya N, Hibshoosh H, Troxel A, et al. Promotion of tumorigenesis by heterozygous disruption of the beclin 1 autophagy gene. J Clin Invest. 2003;112:1809–1820. doi: 10.1172/JCI20039. [DOI] [PMC free article] [PubMed] [Google Scholar]
- Liang C, Feng P, Ku B, Dotan I, Canaani D, Oh BH, et al. Autophagic and tumour suppressor activity of a novel Beclin1-binding protein UVRAG. Nat Cell Biol. 2006;8:688–699. doi: 10.1038/ncb1426. [DOI] [PubMed] [Google Scholar]
- Takahashi Y, Coppola D, Matsushita N, Cualing HD, Sun M, Sato Y, et al. Bif-1 interacts with Beclin 1 through UVRAG and regulates autophagy and tumorigenesis. Nat Cell Biol. 2007;9:1142–1151. doi: 10.1038/ncb1634. [DOI] [PMC free article] [PubMed] [Google Scholar]
- Marino G, Salvador-Montoliu N, Fueyo A, Knecht E, Mizushima N, Lopez-Otin C. Tissue-specific autophagy alterations and increased tumorigenesis in mice deficient in Atg4C/autophagin-3. J Biol Chem. 2007;282:18573–18583. doi: 10.1074/jbc.M701194200. [DOI] [PubMed] [Google Scholar]
- Takamura A, Komatsu M, Hara T, Sakamoto A, Kishi C, Waguri S, et al. Autophagy-deficient mice develop multiple liver tumors. Genes Dev. 2011;25:795–800. doi: 10.1101/gad.2016211. [DOI] [PMC free article] [PubMed] [Google Scholar]
- Altman BJ, Jacobs SR, Mason EF, Michalek RD, MacIntyre AN, Coloff JL, et al. Autophagy is essential to suppress cell stress and to allow BCR-Abl-mediated leukemogenesis. Oncogene. 2011;30:1855–1867. doi: 10.1038/onc.2010.561. [DOI] [PMC free article] [PubMed] [Google Scholar]
- Guo JY, Chen HY, Mathew R, Fan J, Strohecker AM, Karsli-Uzunbas G, et al. Activated Ras requires autophagy to maintain oxidative metabolism and tumorigenesis. Genes Dev. 2011;25:460–470. doi: 10.1101/gad.2016311. [DOI] [PMC free article] [PubMed] [Google Scholar]
- Wei H, Wei S, Gan B, Peng X, Zou W, Guan JL. Suppression of autophagy by FIP200 deletion inhibits mammary tumorigenesis. Genes Dev. 2011;25:1510–1527. doi: 10.1101/gad.2051011. [DOI] [PMC free article] [PubMed] [Google Scholar]
- Rubinsztein DC, Gestwicki JE, Murphy LO, Klionsky DJ. Potential therapeutic applications of autophagy. Nat Rev Drug Discovery. 2007;6:304–312. doi: 10.1038/nrd2272. [DOI] [PubMed] [Google Scholar]
- Rajewsky MF, Dauber W, Frankenberg H. Liver carcinogenesis by diethylnitrosamine in the rat. Science (New York, NY) 1966;152:83–85. doi: 10.1126/science.152.3718.83. [DOI] [PubMed] [Google Scholar]
- Nagata H, Hatano E, Tada M, Murata M, Kitamura K, Asechi H, et al. Inhibition of c-Jun NH2-terminal kinase switches Smad3 signaling from oncogenesis to tumor- suppression in rat hepatocellular carcinoma. Hepatology (Baltimore, MD) 2009;49:1944–1953. doi: 10.1002/hep.22860. [DOI] [PubMed] [Google Scholar]
- Huang KW, Huang YC, Tai KF, Chen BH, Lee PH, Hwang LH. Dual therapeutic effects of interferon-alpha gene therapy in a rat hepatocellular carcinoma model with liver cirrhosis. Mol Ther. 2008;16:1681–1687. doi: 10.1038/mt.2008.160. [DOI] [PubMed] [Google Scholar]
- Meng X, Riordan NH. Cancer is a functional repair tissue. Med Hypotheses. 2006;66:486–490. doi: 10.1016/j.mehy.2005.09.041. [DOI] [PubMed] [Google Scholar]
- Wang Y, Kato N, Hoshida Y, Yoshida H, Taniguchi H, Goto T, et al. Interleukin-1beta gene polymorphisms associated with hepatocellular carcinoma in hepatitis C virus infection. Hepatology (Baltimore, MD) 2003;37:65–71. doi: 10.1053/jhep.2003.50017. [DOI] [PubMed] [Google Scholar]
- Lin WW, Karin M. A cytokine-mediated link between innate immunity, inflammation, and cancer. J Clin Invest. 2007;117:1175–1183. doi: 10.1172/JCI31537. [DOI] [PMC free article] [PubMed] [Google Scholar]
- Enzmann H, Kuhlem C, Loser E, Bannasch P. Damage to mitochondrial DNA induced by the hepatocarcinogen diethylnitrosamine in ovo. Mutation Res. 1995;329:113–120. doi: 10.1016/0027-5107(95)00021-a. [DOI] [PubMed] [Google Scholar]
- Adam-Vizi V, Chinopoulos C. Bioenergetics and the formation of mitochondrial reactive oxygen species. Trends Pharmacol Sci. 2006;27:639–645. doi: 10.1016/j.tips.2006.10.005. [DOI] [PubMed] [Google Scholar]
- Scherz-Shouval R, Elazar Z. Regulation of autophagy by ROS: physiology and pathology. Trends Biochem Sci. 2011;36:30–38. doi: 10.1016/j.tibs.2010.07.007. [DOI] [PubMed] [Google Scholar]
- Bechtel W, Bauer G. Modulation of intercellular ROS signaling of human tumor cells. Anticancer Res. 2009;29:4559–4570. [PubMed] [Google Scholar]
- Rabinowitz JD, White E. Autophagy and metabolism. Science (New York, NY) 2010;330:1344–1348. doi: 10.1126/science.1193497. [DOI] [PMC free article] [PubMed] [Google Scholar]
- Mathew R, White E. Autophagy in tumorigenesis and energy metabolism: friend by day, foe by night. Curr Opinion Genet Dev. 2011;21:113–119. doi: 10.1016/j.gde.2010.12.008. [DOI] [PMC free article] [PubMed] [Google Scholar]
- Cairns RA, Harris IS, Mak TW. Regulation of cancer cell metabolism. Nat Rev. 2011;11:85–95. doi: 10.1038/nrc2981. [DOI] [PubMed] [Google Scholar]
- Rosenfeldt MT, Ryan KM. The multiple roles of autophagy in cancer. Carcinogenesis. 2011;32:955–963. doi: 10.1093/carcin/bgr031. [DOI] [PMC free article] [PubMed] [Google Scholar]
- Hanahan D, Weinberg RA. Hallmarks of cancer: the next generation. Cell. 2011;144:646–674. doi: 10.1016/j.cell.2011.02.013. [DOI] [PubMed] [Google Scholar]
- Shimada M, Nakanishi M. DNA damage checkpoints and cancer. J Mol Histol. 2006;37:253–260. doi: 10.1007/s10735-006-9039-4. [DOI] [PubMed] [Google Scholar]
- Lu J, Chew EH, Holmgren A. Targeting thioredoxin reductase is a basis for cancer therapy by arsenic trioxide. Proc Natl Acad Sci USA. 2007;104:12288–12293. doi: 10.1073/pnas.0701549104. [DOI] [PMC free article] [PubMed] [Google Scholar]
- Grivennikov SI, Greten FR, Karin M. Immunity, inflammation, and cancer. Cell. 2010;140:883–899. doi: 10.1016/j.cell.2010.01.025. [DOI] [PMC free article] [PubMed] [Google Scholar]
- Zhou R, Yazdi AS, Menu P, Tschopp J. A role for mitochondria in NLRP3 inflammasome activation. Nature. 2011;469:221–225. doi: 10.1038/nature09663. [DOI] [PubMed] [Google Scholar]
- Bulua AC, Simon A, Maddipati R, Pelletier M, Park H, Kim KY, et al. Mitochondrial reactive oxygen species promote production of proinflammatory cytokines and are elevated in TNFR1-associated periodic syndrome (TRAPS) J Exp Med. 2011;208:519–533. doi: 10.1084/jem.20102049. [DOI] [PMC free article] [PubMed] [Google Scholar]
- Pelicano H, Carney D, Huang P. ROS stress in cancer cells and therapeutic implications. Drug Resist Updat. 2004;7:97–110. doi: 10.1016/j.drup.2004.01.004. [DOI] [PubMed] [Google Scholar]
- Hsu PP, Sabatini DM. Cancer cell metabolism: Warburg and beyond. Cell. 2008;134:703–707. doi: 10.1016/j.cell.2008.08.021. [DOI] [PubMed] [Google Scholar]
- Gibson SB. A matter of balance between life and death: targeting reactive oxygen species (ROS)-induced autophagy for cancer therapy. Autophagy. 2010;6:835–837. doi: 10.4161/auto.6.7.13335. [DOI] [PubMed] [Google Scholar]
- Bonnet S, Archer SL, Allalunis-Turner J, Haromy A, Beaulieu C, Thompson R, et al. A mitochondria-K+ channel axis is suppressed in cancer and its normalization promotes apoptosis and inhibits cancer growth. Cancer Cell. 2007;11:37–51. doi: 10.1016/j.ccr.2006.10.020. [DOI] [PubMed] [Google Scholar]
Associated Data
This section collects any data citations, data availability statements, or supplementary materials included in this article.


