

Abstract
Toxins and other health threats can cause health problems, whether they are present in the child’s own home, other neighborhood homes where the child spends time, or common areas such as playgrounds. We assess the impact of where a child lives on the burden of lead poisoning. Statewide lead screening data was obtained from the Rhode Island Department of Health. Block group level indicators of old housing and poverty were obtained from the US Census. Of the 204,746 study children, 35,416 (17.3%) had a blood lead level ≥10 μg/ dL. The proportion of study children who were lead poisoned in each block group ranged from 0.0 to 48.6%. The proportion of study children with an elevated blood lead level increased from 8% among children living in block groups in the lowest quintile of poverty to 31% for those in the highest quintile for poverty. Old housing also had an important impact on the risk of lead poisoning. The proportion of children with an elevated blood lead level increased from 7% among children living in block groups in the lowest quintile for pre-1950 housing to 27% for those in the highest quintile for pre-1950 housing. The adjusted odds ratio was 1.64 for the highest quintile of poverty and 1.77 for the highest quintile of pre-1950 housing. The findings of this large, statewide study demonstrate the powerful impact of where children live on the risk of lead poisoning. The findings have important implications for understanding the problem of lead poisoning and for planning primary prevention programs.
Keywords: Lead poisoning, Geographic information systems (GIS), Child health, Neighborhood
Introduction
Where children live can have important effects on their health, both positively and negatively. Environmental toxins and other health threats can cause or exacerbate health problems, whether they are present in the child’s own home, other neighborhood homes where the child spends time, or common areas such as playgrounds, walking paths, streets, and vacant lots. In the study presented here, we use spatial analysis to quantify the impact of where a child lives on the risk of lead poisoning and assess the risk of specific neighborhood characteristics including old housing and poverty.
The negative health consequences of lead poisoning for young children have been well documented [1–11]. Research has shown that a child’s developing nervous system is highly sensitive to lead [3–5, 7, 8, 10, 11]. Even low levels of lead poisoning are associated with irreversible, deleterious effects on a child’s development leading to learning and behavioral disorders, hearing impairment, decreased intelligence quotient (IQ), and diminished attention span. At high levels, lead poisoning can cause convulsions, coma, and even death [6, 11]. In addition to the individual harm associated with lead poisoning, society as a whole bears a great social and economic burden associated with lead poisoning [12].
We use spatial analysis to examine the geographic distribution of lead poisoning in Rhode Island, a state with a particularly high lead burden. The goals are to determine the impact of where a child lives on the likelihood of being lead poisoned. Further, through spatial analyses and multivariate statistical analyses we assess relevant neighborhood characteristics, specifically the concentration of old housing and of poverty, that may affect the risk of lead poisoning.
Methods
Study Population and Approach to Geocoding
The Rhode Island Lead Elimination Surveillance System (LESS) was used to identify all blood lead tests, either venous or capillary, performed between 1993 and 2005 on children up to 72 months of age who had a Rhode Island address at the time of the test. The study period, 1993–2005, was chosen as these were the years that full data were available in LESS and annual screening for blood lead was mandated. For children who had multiple blood lead tests that met this criteria, the test with the highest blood lead level was used for study purposes.
Addresses obtained from LESS were then geocoded using ArcView GIS v. 3.3 (Environmental Systems Research Institute) with 70% spelling sensitivity on the basis of the geo-referenced Topologically Integrated Geographic Encoding and Referencing (TIGER) system developed by the US Census Bureau. A manual review was then performed to attempt to goecode unmatched addresses. If the address still could not be geocoded, the child was excluded from the study sample. The geocoded addresses were then assigned to a corresponding census block group and information was obtained on the block group from the 2000 US Census. Children living in block groups with less than 20 study subjects were excluded from study analyses.
Data Sources and Study Variables
In Rhode Island all children under 6 years of age are mandated to have a blood lead test at least once annually [13]. Blood lead tests must be performed by the Department of Health’s laboratory or in a state approved lab. All results must be reported to the Rhode Island Department of Health and are included in the LESS. LESS includes data on blood lead values (blood lead level reported in μg/dL), test method (capillary or venous), age at test in months, gender, date of birth, date the blood was drawn, and address of the child corresponding to where the child was living at the time of each test. Consistent with state and national standards, children with a blood lead level ≥10 μg/dL at his/her highest blood lead test were defined as lead poisoned. While venous testing is the preferred method, we included both capillary and venous blood lead tests. While capillary screening can lead to falsely elevated levels because of skin contamination, research has shown that capillary testing is highly correlated with venous testing [14, 15]. Not all children who have a capillary screening are re-tested with a venous sample, and among those who are re-tested, it is not possible to know if an intervention occurred between the time of the capillary test and the venous test. By including both capillary and venous testing, we could be as inclusive as possible.
Sociodemographic characteristics of Rhode Island block groups were obtained from the 2000 US Bureau of the Census, Summary File 3 [16]. The block group is the smallest geographic census unit for which census socioeconomic data and housing characteristics are tabulated [17]. There are on average across the USA about 39 blocks per block group and on average across the USA a block group contains 1,000 people [18]. There are 820 census block groups in the State of Rhode Island.
The following neighborhood characteristics for each block group were calculated from the 2000 US Census: the percentage of population living below the federal poverty threshold and the percentage of housing units built pre-1950. Block groups were ranked based on each neighborhood characteristic and assigned to a quintile for each characteristic respectively. Although there are several ways to measure economic deprivation on a neighborhood level, research conducted in 2003 by Krieger et al. [17] showed that the single census variable “percentage of persons below poverty” performed as well as more complex, composite measures of economic deprivation when examining its relationship with lead poisoning [17]. The proportion of housing units built pre-1950 was used as an area-based sociodemographic marker because of its consistent positive association both on an individual and neighborhood level with childhood lead poisoning [17, 19]. Although manufacturing lead-based paint was banned to below trace amounts in 1978, lead-based paint produced after the 1940 s tended to have much lower concentrations of lead than those produced earlier [20].
Spatial Analysis
We conducted an exploratory spatial data analysis using ArcMAP 9.1 (Environmental Systems Research Institute) and GeoDa 9.5. We visually examined the geographic distribution for lead poisoning and each neighborhood characteristic by creating chloropleth maps which use color gradations to depict the block groups in each quintile of neighborhood characteristic. To assess whether lead poisoning rates were significantly clustered in the state versus occurring in a random spatial distribution, we used a univariate Moran’s I statistic, a global measure of spatial autocorrelation, as well as examining the spatial distribution of lead poisoning by creating a Local Indicators of Spatial Association (LISA) cluster map. Both the univariate Moran’s I statistics and the LISA cluster map were based on the original values of variables, rather than on quintile categories.
A univariate Moran’s I statistic calculates the degree to which a value at each unit (in this case, census block group) are associated with the values of its neighbors and calculates a global statistic for the study region (Rhode Island). This statistic is interpreted similar to a correlation coefficient with values ranging from −1 indicating negative spatial autocorrelation, block groups tend to have neighbors with very different characteristics, to 1 indicating positive spatial autocorrelation, block groups with high or low values tend to be clustered near one another.
In conditions where statistically significant spatial autocorrelation is identified for a study area, the logical next step is to determine what areas within the larger region are significantly contributing to that global statistic. LISA cluster maps can be used to identify sub-regions where there are positive or negative spatial clusters [21]. For the global measure (Moran’s I) a first order Queens contiguity weights matrix was used to define a local neighborhood around each geographic unit when calculating the Moran’s I statistic and the LISA cluster map. The contiguity weights matrix defines for each block group which other block groups will be used as its neighbors in the calculation of the Moran’s I statistic. The “queens” matrix includes all neighboring block groups that share a boundary or boundary vertex (corner) with each target block group, which are stored in a data file as a list of block groups in the dataset with their “neighbors.”
Data Analysis
Data were analyzed using Stata. We examined characteristics of the study population and determined the proportion of study children based on the criteria of having a blood lead level ≥10 μg/dL, for the study population as a whole, as well as by the gender of the child, the test method and the age of the child at the time of the test. We also examined the proportion of children poisoned in each block group, and compared the proportion of children lead poisoned by quintiles of block group census characteristics of poverty and pre-1950 housing. After determining the crude odds ratios for lead poisoning by quintile of population in poverty and quintile of housing built before 1950, we performed two multivariate analyses. In the first model in addition to the poverty and pre-1950 housing variables we included gender, test method and age at time of test and clustered by block group. The second model included all of those factors but added a term for the spatial effects of lead poisoning that was calculated from the spatial lag coefficient.
Results
Study Population
Of the 220,776 children tested during the entire study period, 15 children were excluded because their blood lead screening method was from cord blood (n = 12) or their age at test was less than 0 months (n = 3). There were 15,945 (7.2%) children who were excluded because their address could not be geocoded. For 9,701 (4.4%) of these children there were clear problems with the addresses: the address was missing or listed as unknown (n = 6,883); the address was missing key information (n = 529) such as the street name; or a post office box rather than a street address was listed (n = 2,289). After manual review, an additional 6,244 (2.8%) addresses were unable to be geo-coded to a valid street address for unknown reasons and were excluded from further analysis. Lastly, 70 children were excluded since they lived in one of the 12 block groups that were excluded because fewer than 20 children were screened in the block group.
A total of 204,746 (92.7%) children living in 808 census block groups were included in our analysis. The study population included 100,395 females (49.0%) and 104,351 (51.0%) males (see Table 1). The most common test method was a venous blood test (57.6%) with the remainder being capillary. The majority of tests were performed in the first two years of life (22.9% 12 months or younger; 50.6% 24 months or younger; 67.2% 36 months or younger; 80.0% 48 months or younger; 91.8% 60 months or younger).
Table 1.
Proportion of children lead poisoned
| Lead poisoned (blood lead level ≥10 μg/dL)
|
||
|---|---|---|
| No 169,330 (82.70%) |
Yes 35,416 (17.30%) |
|
| Sex | ||
| Female (n = 100,395) | 84,132 (83.8%) | 16,263 (16.2%) |
| Male (n = 104,351) | 85,198 (81.6%) | 19,153 (18.4%) |
| Test method | ||
| Capillary (n = 86,849) | 66,272 (76.3%) | 20,577 (23.7%) |
| Venous (n = 117,897) | 103,058 (87.4%) | 14,839 (12.6%) |
| Age at test | ||
| 0–12 months (n = 46,787) | 42,770 (91.4%) | 4,017 (8.6%) |
| >12–24 months (n = 56,843) | 47,224 (83.1%) | 9,619 (16.9%) |
| >24–36 months (n = 33,932) | 26,244 (77.3%) | 7,688 (22.7%) |
| >36–48 months (n = 26,290) | 20,399 (77.6%) | 5,891 (22.4%) |
| >48–60 months (n = 24,201) | 19, 274 (79.6%) | 4,927 (20.4%) |
| >60–72 months (n = 16,693) | 13,419 (80.4%) | 3,274 (19.6%) |
Lead Poisoning
Of the 204,746 study children, 35,416 (17.3%) had a blood lead level ≥10 μg/dL (Table 1). Lead poisoning was more common among males as compared to females (18.4% vs. 16.2% respectively; P <0.000). Capillary tests were more likely to be elevated as compared to venous tests (23.7% vs. 12.6% respectively; P <0.000). Lead poisoning also varied by the age of the child at the time of the test (P <0.000). For children tested up to 12 months of age, 8.6% were lead poisoned. This compared to 16.9% for those who were tested when they were greater than 12 months of age up to and including 24 months of age; 22.7% for those who were greater than 24 months of age up to and including 36 months of age; 22.4% for those who were greater than 36 months of age up to and including 48 months of age; 20.4% for those who were greater than 48 months of age up to and including 60 months of age; and 19.6% for those who were greater than 60 months of age up to and including 72 months of age.
Spatial Analysis of Lead Poisoning
There was substantial variation in the proportion of children who were lead poisoned in each block group, ranging from 0.0 to 48.6%. The mean proportion of children who were lead poisoned was 4.5% for the lowest quintile, 8.5% for block groups in the second quintile, 12.5% for block groups in the third quintile, 18.8% for block groups in the fourth quintile and 32.1% for block groups in the highest quintile.
As seen in Fig. 1, block groups with a high proportion of children lead poisoned are not evenly distributed throughout Rhode Island. Rather they are concentrated in specific geographic areas of the state. Block groups in the highest quintile, those shaded in the darkest color on the map, are particularly concentrated in five municipalities: Woonsocket, Central Falls, Pawtucket, Providence, and Newport. While less than 40% (295/808) of the study block groups are located in these five municipalities, 87.6% of the block groups in the highest quintile for lead poisoning (141/161) are located in these municipalities. Almost two-thirds (66.3%) of lead poisoned children in the study group resided in block groups in these five municipalities.
Fig. 1.

Quintiles of percent of population lead poisoned
We calculated a Moran’s I of .73 indicating that positive spatial autocorrelation of lead poisoning in Rhode Island. This global statistic tells us block groups with high rates of lead poisoning are likely near other block groups with high rates of lead poisoning. As indicated earlier, the Moran’s I does not indicate where those areas are and whether one or more clusters of such block groups exist. The geographic locations of these spatial clusters and spatial outliers are identified by the LISA cluster map (Fig. 2). Both Figs. 1 and 2 demonstrate that the significant global statistic (Moran’s I) is driven by a small group of block group clusters in the state. In particular, the four areas shaded in red on the map in Fig. 2 highlight the sub-regions of Rhode Island that have high levels of lead poisoning (clusters of block groups which all have high lead levels). Also of interest in Fig. 2 are the large blue areas that generally have low lead poisoning rates. Both of the red and blue areas contribute to the significant global statistic (Moran’s I) in that they represent clusters of block groups that have similar lead poisoning rates (high or low).
Fig. 2.

Local indicators of spatial association cluster map
Poverty and Pre-1950 Housing
As can be seen in the maps of census data for Rhode Island block groups (Figs. 3 and 4), there are similarities in the geographic patterns for poverty, pre-1950 housing and lead poisoning. Poverty and pre-1950 housing are not evenly distributed across block groups, but rather are heavily concentrated in certain block groups. The percentage of the population living below the federal poverty threshold in each block group ranged from 0.0 to 68.2%. The percentage of housing units built before 1950 in each block group ranged from 0.0 to 96.5%. As was the case with lead poisoning, there is also clustering of block groups by quintile of poverty and by quintile of pre-1950 housing.
Fig. 3.

Quintiles of percent of population living in poverty
Fig. 4.
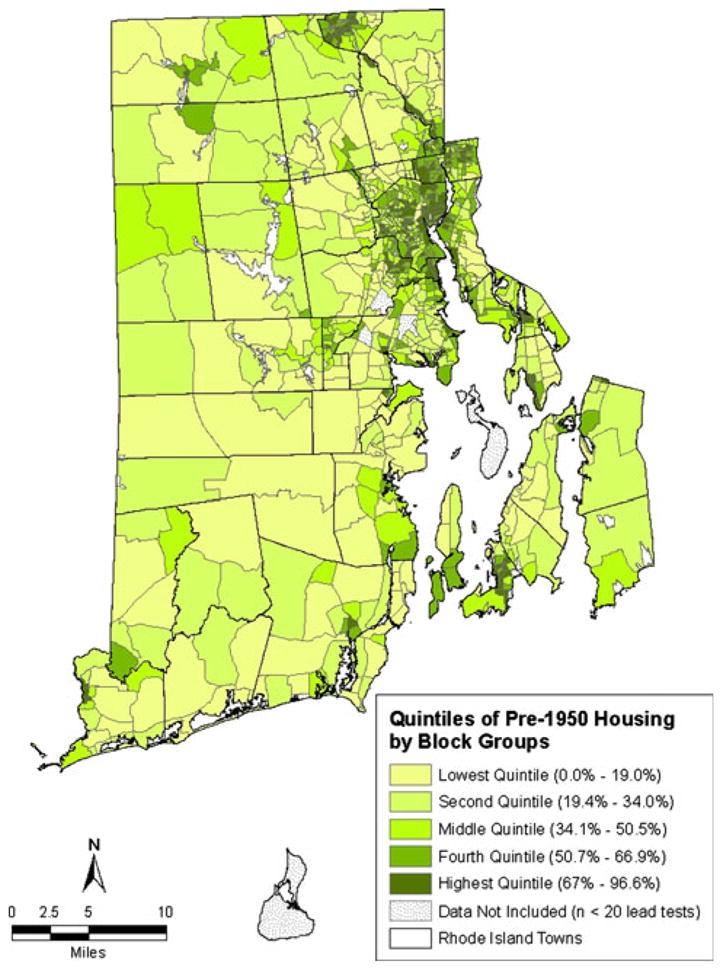
Quintiles of percent of housing units built pre-1950
Table 2 provides the percentage of study children who were lead poisoned broken down by the quintiles of poverty and pre-1950 housing for the block group in which they lived at the time of the blood lead test. For children living in the block groups in the lowest quintile for poverty, 8.3% were lead poisoned. This increased in a stepwise fashion to 9.9% for the second quintile of poverty, 13.6% for the third quintile of poverty, 23.5% for the fourth quintile of poverty and 31.4% for the highest quintile of poverty. For children living in the block groups in the lowest quintile for pre-1950 housing, 6.9% were lead poisoned. This increased in a stepwise fashion to 10.7% for the second quintile of pre-1950 housing, 19.6% for the third quintile of pre-1950 housing, 22.8% for the fourth quintile of pre-1950 housing and 26.5% for the highest quintile of pre-1950 housing.
Table 2.
Comparison of study children lead poisoning by quintiles of block group census characteristics
| Lead poisoned (blood lead level ≥10 μg/dL)?
|
||
|---|---|---|
| No 169,330 (82.7%) |
Yes 35,416 (17.3%) |
|
| Quintiles of population in poverty | ||
| Lowest quintile (n = 41,327) | 37,893 (91.7%) | 3,434 (8.3%) |
| Second quintile (n = 40,585) | 36,585 (90.1%) | 4,000 (9.9%) |
| Middle quintile (n = 41,070) | 35,505 (86.4%) | 5,565 (13.6%) |
| Fourth quintile (n = 41,205) | 31,514 (76.5%) | 9,691 (23.5%) |
| Highest quintile (n = 40,559) | 27,833 (68.6%) | 12,726 (31.4%) |
| Quintiles of pre-1950 housing | ||
| Lowest quintile (n = 41,002) | 38,185 (93.1%) | 2,817 (6.9%) |
| Second quintile (n = 40,924) | 36,529 (89.3%) | 4,395 (10.7%) |
| Middle quintile (n = 41,145) | 33,103 (80.5%) | 8,042 (19.5%) |
| Fourth quintile (n = 40,897) | 31,558 (77.2%) | 9,339 (22.8%) |
| Highest quintile (n = 40,778) | 29,955 (73.5%) | 10,823 (26.5%) |
Multivariate Analysis
Table 3 provides the crude odds ratios and adjusted odds ratios using both multivariate models. The crude odds ratios increased in a stepwise fashion for quintiles of both poverty and pre-1950 housing, with no overlap of confidence intervals, reaching 5.05 for the highest quintile of poverty and 4.90 for the highest quintile of pre-1950 housing. The patterns held in the multivariate models, though there was some overlap of confidence intervals (mainly for the second quintile of poverty), indicating that even adjusting for each other, as well as other potential confounders, both poverty and pre-1950 housing were independent risk factors for lead poisoning. While the odds ratios were somewhat attenuated, they continued to show the substantial impact of the block group quintile of poverty and quintile of pre-1950 housing. Even controlling for test method, age at test and gender and clustered by block group, the odds of being lead poisoned was 3.97 times greater for children living in block groups in the highest quintile of poverty and 2.89 for the highest quintile of pre-1950 housing. Adding the spatial effects of lead poisoning into the model decreased the odds ratio, indicating that the risk of where a child lives extends beyond the block group boundaries, indicating a broader clustering of risk. Even including this term in the model, poverty and pre-1950 housing remain important risk factors.
Table 3.
Poverty, pre-1950 housing and lead poisoning characteristics
| Crude odds ratio (95% CI) | Adjusted odds ratio (95% CI)a | Adjusted odds ratio (95% CI)b | |
|---|---|---|---|
| Quintiles of population in poverty | |||
| Lowest quintile | 1.00 | 1.00 | 1.00 |
| Second quintile | 1.21 (1.15–1.27) | 1.07 (0.97–1.19) | .99 (.90–1.08) |
| Middle quintile | 1.73 (1.65–1.81) | 1.36 (1.22–1.52) | 1.17 (1.06–1.28) |
| Fourth quintile | 3.39 (3.25–3.54) | 2.19 (1.91–2.50) | 1.42 (1.28–1.58) |
| Highest quintile | 5.05 (4.84–5.26) | 3.97 (3.40–4.63) | 1.64 (1.44–1.87) |
| Quintiles of housing built pre-1950 | |||
| Lowest quintile | 1.00 | 1.00 | 1.00 |
| Second quintile | 1.63 (1.55–1.71) | 1.27 (1.11–1.46) | 1.18 (1.07–1.30) |
| Middle quintile | 3.29 (3.15–3.45) | 2.06 (1.80–2.34) | 1.54 (1.39–1.70) |
| Fourth quintile | 4.01 (3.84–4.19) | 2.47 (2.16–2.82) | 1.70 (1.53–1.90) |
| Highest quintile | 4.90 (4.69–5.12) | 2.89 (2.55–3.28) | 1.77 (1.59–1.97) |
Spatial lag coefficient: .55 (.50 to .60)
Adjusting for test method, age at test, and gender and clustered by block group
Adjusting for test method, age at test, gender, and spatial effects of lead poisoning and clustered by block group
Discussion
The findings of this large, statewide study, which employed both spatial analysis techniques and multivariate analyses, demonstrate the powerful impact of where children live on the risk of lead poisoning, an important health issue with long-term sequelae. Both neighborhood characteristics studied here, block group level concentration of poverty and old housing, had a substantial impact on the risk of lead poisoning. The causative pathway for pre-1950 housing seems clear. Homes built before 1950 were painted with lead-containing paint that generally is still in the home and the child can be exposed to lead, whether it be in the home the child actually lives in or neighborhood homes in which the child spends time or in soil that has been contaminated from lead paint. Living in an area with substantial numbers of old homes results in increased exposure to lead and its devastating effects. Even adjusting for the risk of pre-1950 housing, poverty was an important risk factor. Presumably housing stock in the high poverty block groups is not only older, but also less well maintained leading to greater exposure to the lead paint in the older homes.
Poverty and old housing are clearly important factors that help explain the striking geographic clustering of lead poisoning in Rhode Island. This finding has important implications for lead poisoning and other environmental health problems. In planning primary prevention programs, in states like Rhode Island it is possible to use available data to clearly target neighborhoods at greatest need for remediation programs. As clearly demonstrated in the study data and visually represented in both Figs. 1 and 2, the burden of lead poisoning is not evenly distributed throughout the state, but rather is concentrated in specific areas. In this large, statewide study population, there are block groups that have had no cases of lead poisoning in the study sample in over a decade, while the proportion poisoned reached almost 50% for the most affected block groups. Block groups with the greatest burden of lead poisoning are clustered in specific geographic areas of the state. This represents striking health disparities based on where a child lives, but it also presents an opportunity. We know where the lead is and we know the effect it is having. This knowledge can be used to guide targeted primary prevention efforts. Such efforts are underway in Rhode Island and can be undertaken in other locations using similar data to guide their efforts.
Another important implication of the study is as a reminder of the powerful impact of environment hazards in explaining health disparities. Research has shown that low-income children suffer a great burden for a range of health problems. As demonstrated in this study, where low-income families live not only helps explain the reason for health disparities but can also guide efforts to address them. This GIS-based approach should be used for a range of health problems including asthma and injuries where a clear environmental component would be expected. Examining these other health issues presents challenges, as there generally are not statewide screening programs, such as Rhode Island has for lead poisoning, to clearly delineate the geographic pattern of disease. Also census data may not have variables where the causative pathway is as direct as old housing and lead paint. However, data from a range of sources including health departments, health care providers, insurers, the Census and other sources can and should be used for this purpose. In addition to the variables of poverty and old housing that we used in this study, a range of potential exposure variables would be appropriate for health problems such as asthma and injuries. These include air quality measures, traffic density, and presence/absence of sidewalks.
In summary, this statewide, block group level study provides strong evidence on the important impact of where a child lives on his/her health. To eliminate health problems such as childhood lead poisoning, primary prevention programs based in the areas where children live must be undertaken. GIS analysis is a powerful tool, not only to better understand the nature of health threats to children but also to help design interventions to address them.
Acknowledgments
This research was presented at the Pediatric Academic Societies Annual Meeting, Baltimore, MD, May 5, 2009. The authors thank the Rhode Island Department of Health, Rhode Island Attorney General Patrick Lynch and the Lead Rehabilitation Sub-Committee of the Attorney General’s Advisory Commission on Lead Paint. Brown University provided funding, including funds received from DuPont as part of an agreement between DuPont and Attorney General Lynch.
Contributor Information
Patrick M. Vivier, Email: Patrick_Vivier@Brown.edu, Department of Community Health, Brown University, Box G-S121, 121 South Main St, Providence, RI 02912, USA. Department of Pediatrics, Brown University, Providence, RI, USA
Marissa Hauptman, Department of Community Health, Brown University, Box G-S121, 121 South Main St, Providence, RI 02912, USA. New York University School of Medicine, New York, NY, USA.
Sherry H. Weitzen, Department of Community Health, Brown University, Box G-S121, 121 South Main St, Providence, RI 02912, USA
Scott Bell, Department of Geography, University of Saskatchewan, Saskatoon, SK, Canada.
Daniela N. Quilliam, Rhode Island Department of Health, Providence, RI, USA
John R. Logan, Department of Sociology, Brown University, Providence, RI, USA
References
- 1.American Academy of Pediatrics, Committee on Environmental Health. Screening for elevated blood lead levels. Pediatrics. 1998;101:1072–1078. [PubMed] [Google Scholar]
- 2.Baghurst PA, McMichael AJ, Wigg NR, Vimpani GV, Robertson EF, Roberts RJ, et al. Environmental exposure to lead and children’s intelligence at the age of seven years: The Port Pirie Cohort Study. New England Journal of Medicine. 1992;327(18):1279–1284. doi: 10.1056/NEJM199210293271805. [DOI] [PubMed] [Google Scholar]
- 3.Bellinger DC, Stiles KM, Needleman HL. Low-level lead exposure, intelligence and academic achievement: A long-term follow-up study. Pediatrics. 1992;90:855–861. [PubMed] [Google Scholar]
- 4.Canfield RL, Henderson CR, Jr, Cory-Slechta DA, Cox C, Jusko TA, Lanphear BP. Intellectual impairment in children with blood lead concentrations below 10 microg per deciliter. New England Journal of Medicine. 2003;348(16):1517–1526. doi: 10.1056/NEJMoa022848. [DOI] [PMC free article] [PubMed] [Google Scholar]
- 5.Gilbert SG, Weiss B. A rationale for lowering the blood lead action level from 10 to 2 microg/dL. Neurotoxicology. 2006;27(5):693–701. doi: 10.1016/j.neuro.2006.06.008. [DOI] [PMC free article] [PubMed] [Google Scholar]
- 6.Gunn V, Nechyba C. The Harriet Lane handbook. Philadelphia: Mosby; 2002. pp. 35–38. [Google Scholar]
- 7.Koller K, Brown T, Spurgeon A, Levy L. Recent developments in low-level lead exposure and intellectual impairment in children. Environmental Health Perspective. 2004;112(9):987–994. doi: 10.1289/ehp.6941. [DOI] [PMC free article] [PubMed] [Google Scholar]
- 8.Lanphear BP, Hornung R, Khoury J, Yolton K, Baghurst P, Bellinger D, et al. Low-level environmental lead exposure and children’s intellectual function: An international pooled analysis. Environmental Health Perspectives. 2005;113(7):894–899. doi: 10.1289/ehp.7688. [DOI] [PMC free article] [PubMed] [Google Scholar]
- 9.McMichael AJ, Baghurst PA, Wigg NR, Vimpani GV, Robertson EF, Roberts RJ. Port Pirie cohort study: Environmental exposure to lead and children’s abilities at the age of four years. New England Journal of Medicine. 1998;319(8):468–475. doi: 10.1056/NEJM198808253190803. [DOI] [PubMed] [Google Scholar]
- 10.Needleman HL, Gatsonis CA. Low-level lead exposure and the IQ of children: A meta-analysis of modern studies. JAMA. 1990;263(5):673–678. [PubMed] [Google Scholar]
- 11.Piomelli S. Lead poisoning. In: Behrman RE, Kliegman RM, Jenson HB, editors. Nelson textbook of pediatrics. 16. Philadelphia: W.B. Saunders Company; 2000. pp. 2156–2160. [Google Scholar]
- 12.Muennig P. The social cost of childhood lead exposure in the post-lead regulation era. Archives of Pediatric and Adolescent Medicine. 2009;163:844–849. doi: 10.1001/archpediatrics.2009.128. [DOI] [PubMed] [Google Scholar]
- 13.Rhode Island Department of Health. Rhode Island childhood lead poisoning prevention program. Childhood lead poisoning in Rhode Island: The numbers 2004 edition. Available at: www.health.ri.gov/lead/databook/2004_databook.pdf.
- 14.Schlenker TL, Fritz CJ, Mark D, Layde M, Linke G, Murphy M, et al. Screening for pediatric lead poisoning: Comparability of simultaneously drawn capillary and venous blood samples. JAMA. 1994;271(17):1346–1348. doi: 10.1001/jama.271.17.1346. [DOI] [PubMed] [Google Scholar]
- 15.Parsons PJ, Reilly AA, Esernio-Jenssen D. Screening children exposed to lead: An assessment of the capillary blood lead fingerstick test. Clinical Chemistry. 1997;43(2):302–311. [PubMed] [Google Scholar]
- 16.US Census Bureau. Summary file 3: 2000 census of population and housing. Rhode Island: 2002. [Google Scholar]
- 17.Krieger N, Chen JT, Waterman PD, Soobader MJ, Subramanian SV, Carson R. Choosing area based socioeconomic measures to monitor social inequalities in low birth weight and childhood lead poisoning: The Public Health Disparities Geocoding Project (US) Journal of Epidemiology and Community Health. 2003;57(3):186–199. doi: 10.1136/jech.57.3.186. [DOI] [PMC free article] [PubMed] [Google Scholar]
- 18.US Census Bureau. Technical documentation. 2002. Summary file 3: 2000 cnsus of population and housing. [Google Scholar]
- 19.Reissman DB, Staley F, Curtis GB, Kaufmann RB. Use of geographic information system technology to aid Health Department decision making about childhood lead poisoning prevention activities. Environmental Health Perspective. 2001;109(1):89–94. doi: 10.1289/ehp.0110989. [DOI] [PMC free article] [PubMed] [Google Scholar]
- 20.Centers for Disease Control and Prevention. Preventing lead poisoning in young children. Atlanta: Centers for Disease Control and Prevention; 1991. [Google Scholar]
- 21.Anselin L. Local indicators of spatial association—LISA. Geographical Analysis. 1995;27:93–115. [Google Scholar]