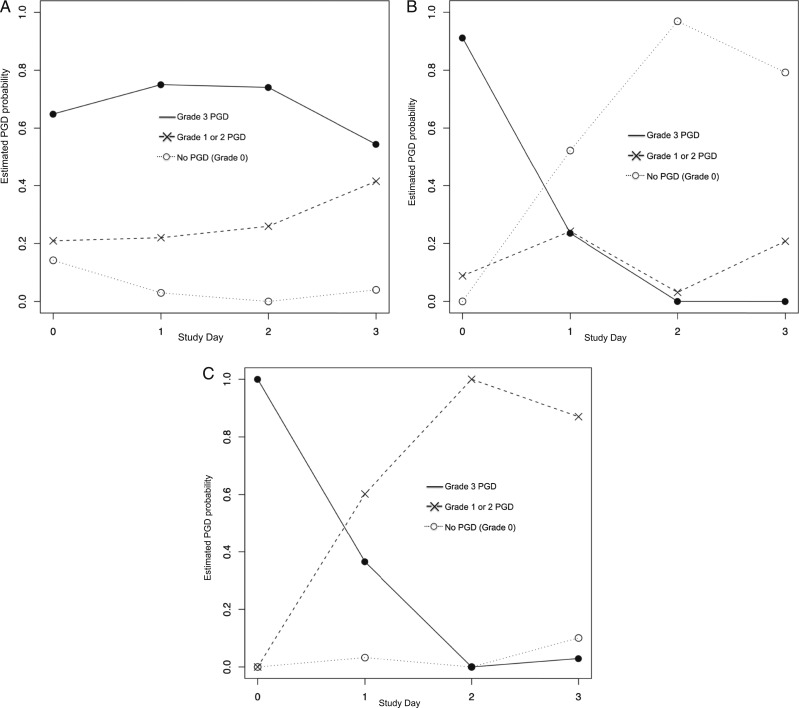
Figure 1.
Three-class model generated from latent class analysis. The y axis indicates the probability of International Society for Heart & Lung Transplantation PGD grade on a given day. The x axis represents the postoperative day. A given probability of PGD grade for each day is represented by symbols connected by corresponding lines (● = grade 3, X = grade 1 or 2, ○ = grade 0). The line with the highest probability generated from the model indicates that members of that class are most likely to have a particular grade on a particular day. A, Latent class 1 (55% of grade 3 PGD population): Grade 3 PGD present on day 0 and persisted to day 3. Grade 3 had the highest probability on all study days in this class. B, Latent class 2 (7% of grade 3 PGD population): Grade 3 PGD present on day 0 that resolved completely to grade 0 by day 3. On day 0, grade 3 had the highest probability, but the probability of grade 3 decreased by day 1, and on days 2 and 3, grade 0 had the highest probability. C, Latent class 3 (39% of grade 3 population): Grade 3 PGD present on day 0 that attenuated to lower grades 1 and 2, but did not completely resolve, by day 3. On day 0, grade 3 had the highest probability, but decreased by day 1, and on days 2 and 3, intermediate grades had the highest probability. PGD = primary graft dysfunction.

