

Abstract
Background
Adolescence is a key life period for the development of depression. Predicting the development of depression in adolescence through detecting specific early symptoms may aid in the development of timely screening and intervention programs.
Methods
We administered the Short Mood and Feelings Questionnaire (SMFQ) to 5,769 American and Australian students aged 10 to 15 years, at two time points, separated by 12 months. We attempted to predict high levels of depression symptoms at 12 months from symptoms at baseline, using statistical approaches based upon the quality, as well as the quantity, of depression symptoms present. These approaches included classification and regression trees (CART) and logistic regression.
Results
A classification tree employing four SMFQ items, such as feelings of self-hatred and of being unloved, performed almost as well as all 13 SMFQ items at predicting subsequent depression symptomatology.
Limitations
Depression was measured using a self-report instrument, rather than a criterion standard diagnostic interview.
Conclusion
Further validation on other populations of adolescents is required: however the results suggest that several symptoms of depression, especially feelings of self-hatred, and being unloved, are associated with increased levels of self-reported depression at 12 months. Although screening for depression can be problematic, symptoms such as the ones above should be considered for inclusion in screening tests for adolescents.
Keywords: depression, adolescents, screening, classification trees
1. Introduction
Experienced by up to 5% of the adolescent population at any one time (Sawyer et al., 2010), depression is associated with many adverse outcomes in adulthood, including lowered educational attainment (Kessler et al., 1995); increased risk of substance use and abuse (McKenzie et al., 2010c; O’Donnell et al., 2006; Patton et al., 2002), and increased risk of suicide (Costello et al., 2003). There has recently been a renewal of interest in the study of this disorder at the level of individual symptoms, particularly in the identification of depression in community settings (Lowe et al., 2010; Rhew et al., 2010). Although few overall studies of depressive symptoms of adolescents exist (Patton et al., 2000), several studies have attempted prediction of later episodes of depression from specific symptoms such as feelings of worthlessness (Pine et al., 1999; van Lang et al., 2007; Van Voorhees et al., 2008; Wilcox and Anthony, 2004). Predicting the development of psychiatric disorders in adolescence by detecting key early symptoms may aid in the screening and treatment of such disorders (McGorry et al., 2000; van Lang et al., 2007).
Unfortunately, few large prospective cohort studies in young people with the scope to examine the predictive value of specific depressive symptoms have been conducted (van Lang et al., 2007). Understanding the development of depressive symptoms in early adolescence requires repetition of symptom measures over critical periods. The findings around predicting depression several years into the future have so far been mixed. For example, prediction of depression at ages 14 and 21, employing symptoms reported at age five, had very limited accuracy (Najman et al., 2008). Symptoms reported in late adolescence, however, were associated with depression in young adulthood, assessed six (van Lang et al., 2007) or seven (Pine et al., 1999) years later. Similarly, symptoms of internalizing disorder, such as timidity, sadness and tiredness, exhibited at ages 13 and 15 were associated with psychiatric disorders, including depression, up to 40 years later (Colman et al., 2007).
Although early adolescence is important for the emergence of depression, there has been little research into using depressive symptoms present in this life-stage to predict subsequent depression over shorter time periods (Pine et al., 1999). One recent study found that feelings of sadness and moodiness were highly predictive of adolescent depression 12 months later (Van Voorhees et al., 2008). The present study is concerned with predicting high levels of depressive symptoms in early adolescence, utilising a large sample of Australian and American adolescents, over a 12 month period. We employ approaches based upon the quality or type, as well as the quantity, of depression symptoms present. The former approach makes use of classification and regression trees (CART) (Breiman et al., 1984; Gruenewald et al., 2008; Strobl et al., 2009), as well as logistic regression. Classification trees make few assumptions of the data, are generally readily interpretable by clinicians and researchers (Gruenewald et al., 2008), and can be used to identify salient combinations of symptoms.
Identification of symptom patterns that are predictive of high levels of adolescent depression may aid insight into the underlying aetiology of depression, as well as informing the development of more efficient epidemiological tests for adolescent depression. Such tests can aid in planning prevention and early intervention programs, in school and other settings (Rhew et al., 2010; van Lang et al., 2007).
We hypothesise that the presence of depressive symptoms at the first data collection will be predictive of high levels of symptoms 12 months later. Our examination of which specific combinations of symptoms are most predictive extends earlier research that concentrated on the total number of symptoms and / or on individual symptoms (Pine et al., 1999; Rhew et al., 2010; van Lang et al., 2007; Wilcox and Anthony, 2004). The purpose of our study is to identify such combinations of symptoms, and compare their predictive performance with that of an approach based upon the number of symptoms. Finally, we discuss how such approaches can be applied to screening for depression.
2. Methods
2.1. Recruitment and data collections
We employed a large sample of 5,769 students on whom information was collected as part of a binational study of youth development, in the US state of Washington (WA), and the Australian state of Victoria (VIC). In the first stage of a two-stage cluster sampling procedure, schools were randomly selected from a stratified sampling frame of all of the schools in WA (public, private and alternative) and VIC (Catholic, independent and government). In the second stage of sampling, single intact classes from each school, for the three selected grade levels described below, were chosen at random.
Students were initially aged 10 to 15 years in the first wave of data collection (2002), and were in one of three primary or secondary school grades; grade five (10 to 11 year olds, n = 1870 or 32.4%), grade seven (12 to 13 year olds, n = 1947 or 33.7%) and grade nine (14 to 15 year olds, n = 1952 or 33.8%). In Victoria, 165 classes in 152 schools (65% of eligible classes, n = 254) participated. In Washington, 155 classes in 153 schools (73% of eligible classes, n = 212) participated. The initial age of the students at baseline or wave one ranged from 9.7 to 17.2 years, with a mean age of 13.0 years (standard deviation or sd = 1.7 years) and a median of 13.0 years (interquartile range = 11.3 to 14.7 years). A subsequent wave of data collection took place 12 months later (2003).
There were approximately equal numbers of females (2941 or 51.0%, 95% CI = 49.0% to 53.0%) and males (2828 or 49.0%, 95% CI = 47.0% to 51.0%). Each state sought active parental consent for student participation, and the research protocols were approved by the relevant review boards and ethics committees. Further details of the study design are available (McMorris et al., 2007; Patton et al., 2008).
2.2. Assessment
Depressive symptoms were assessed using the Short Mood and Feelings Questionnaire (SMFQ) (Angold et al., 1995), a widely employed self-report measure of depressive symptoms in early childhood and adolescence. The SMFQ consists of 13 items such as “feeling miserable or unhappy” and “I was very restless”, referring to the past month. Responses are made on a three point scale (consisting of 0 “not true”, 1 “sometimes true” and 2 “true”), summed to give a score representing level of depressed mood (Angold et al., 2002; Messer et al., 1995). The mean SMFQ score at baseline for the analytic sample described below was 6.9 (sd = 5.5), and at 12 months 6.8 (sd = 6.0). Almost a quarter of the students met SMFQ caseness at baseline (22.0%, 95% CI = 20.6% to 23.4%).
The SMFQ correlates highly with other measures of depression (Kovacs, 1985; Wood et al., 1995) and has been employed in a wide variety of studies (e.g., (Katon et al., 2008; Patton et al., 2008; Rhew et al., 2010; Roeder et al., 2009; Rothon et al., 2009)). In keeping with previous research, we defined depression caseness at 12 months as having an SMFQ score of 11 or greater (Patton et al., 2008). Overall, 1215 (22.4%, 95% confidence interval or CI = 21.0% to 23.8%) of the 5434 students that were analysed exhibited 12 month SMFQ caseness. The latter was more prevalent in females (790 of 2796, or 28.2%, 95% CI = 26.2% to 30.4%) than in males (425 of 2638 or 16.1%, 95% CI = 14.7% to 17.7%).
If only a small number (four or less) of SMFQ items are missing, missing items are conventionally replaced with the mean of the remaining items (Angold et al., 1995). The present analyses were restricted to the 5434 (94.2%) students with no more than four SMFQ items missing at 12 months, but no missing items at baseline. The amount of missing data was very low, with ninety-seven (1.7%) of the 5769 students having more than four missing SMFQ items at 12 months, and 246 (4.3%) students having one or missing items at baseline.
2.3. Statistical analyses
We employed statistical methods based upon the number, as well as the type, of baseline depressive symptoms. Approaches based upon the number of symptoms consisted of the conventional SMFQ cut-off score of 11 or greater, and a cut-off determined empirically using Receiver Operating Characteristic (ROC) curve analysis (Kraemer, 1992). The latter technique was employed to find the SMFQ cut-off score balancing number of true positives against number of false positives.
Approaches based upon the quality or type of symptoms consisted of logistic regression, and CART. Logistic regression allows any intercorrelation between symptoms (McKenzie et al., 2010a), as well as the effects of potential confounders such as age, to be statistically controlled for. To facilitate interpretation, analysis of individual SMFQ items employed the binary recoding described below.
CART (Breiman et al., 1984) was used to look at combinations of SMFQ items in the form of a decision or classification tree. CART can be likened to both cluster analysis and regression (McKenzie et al., 2006). However, unlike cluster analysis and latent class analysis (Vermunt and Magidson, 2002), that do not usually directly involve outcome variables such as SMFQ caseness, CART seeks to find subgroups defined by combinations of items with similar values on the outcome variable. CART explicitly validates the generality of its tree models, using by default 10-fold cross-validation (Breiman et al., 1984). Datasets are randomly divided into 10 subsets, each subset in turn being used to test the performance of the tree created with the other nine subsets.
CART and other tree-building methods have been applied in a wide variety of epidemiological and other relevant studies (Allore et al., 2005; Batterham et al., 2009; Calvocoressi et al., 2005; Craig et al., 1997; Davis et al., 2008; McKenzie et al., 2010a; McKenzie et al., 2010b; McKenzie et al., 2006; McKenzie et al., 1993; Schmitz et al., 2003; Schoevers et al., 2006; Sullivan et al., 2003; Wiffen et al., 2010; Wolfe et al., 2006).
Measures of screening and diagnostic test performance (Kraemer, 1992) were calculated for each symptom separately, as well as for the screening rules obtained using cut-offs, logistic regression and CART. Performance measures consisted of sensitivity (probability of a positive test result among those meeting criteria, such as 12 month SMFQ caseness), specificity (probability of a negative test result amongst those not meeting criteria), positive predictive value (probability of meeting criteria for those with a positive test result), negative predictive value (probability of not meeting criteria for those with a negative test result), and area under the ROC curve. The latter is equal to the probability that a random individual meeting criteria has a higher value of the measurement (e.g. a positive test result) than a random individual not meeting criteria. An area under the curve of 0.50 denotes chance level performance (Kraemer, 1992).
The clustered nature of the school survey study design was handled within logistic regression using robust estimation of variance (White, 1982). Confidence intervals for areas under the ROC curve were obtained using the bootstrap technique (Efron and Tibshirani, 1993), which consists of repeatedly resampling from the dataset, in this case taking clustering by school into account. Ten thousand bootstrap samples were employed. CART is not able to control for possible clustering and so the final subgroups or “terminal nodes” obtained using CART were compared using logistic regression (McKenzie et al., 2006; Schmitz et al., 2003), allowing for clustering. The intraclass correlation coefficient (Muller and Buttner, 1994), a measure of correlation within clusters such as schools, for 12 month SMFQ caseness was 0.03. All confidence intervals presented in this paper take clustering into account.
We employed CART, version 6 (Salford Systems, San Diego, California) for the tree-building analyses, and Stata, version 11 (Stata Corporation, College Station, Texas) for all other statistical analyses, including the bootstrap. Following our earlier study (Patton et al., 2008) we analysed the combined sample, but included state (VIC or WA), as well as age and gender, as potential confounders.
3. Results
3.1. Analysis of individual items
A binary coding of “not true” and “sometimes true” versus “true” is often employed in research involving the SMFQ (Angold et al., 1995). Our initial CART analyses of baseline SMFQ items indicated, however, that the merging of “sometimes true” and “true” was more highly associated (had higher Gini coefficients, described below) with SMFQ caseness at 12 months, than was the merging of “not true” and “sometimes true”. The former coding was therefore employed in all analyses of individual items.
The percentage of students responding affirmatively (“sometimes true” or “true”), as well as measures of test performance for each SMFQ item, are given in Table 1. Items one “I felt miserable or unhappy” and three “I felt so tired I just sat around and did nothing”, were the most frequently reported items (73.6% and 60.2% respectively). No one item stands out in terms of overall screening and diagnostic performance. Item one exhibited the highest sensitivity (90.6%), followed by item seven, “I found it hard to think properly or concentrate” (79.8%). Item nine “I was a bad person” exhibited the highest specificity (83.5%), followed by item eight “I hated myself” (82.4%). Items eight and eleven “I thought nobody really loved me”, exhibited the highest positive predictive values (47.0% and 44.6% respectively), while items one and seven exhibited the highest negative predictive value (92.1% and 88.9% respectively).
Table 1.
Relationship of individual baseline SMFQ items (binary coding) to SMFQ caseness at 12 month follow-up
| SMFQ itema | Prevb | Sens | 95% CI | Spec | 95% CI | PPV | 95% CI | NPV | 95% CI |
|---|---|---|---|---|---|---|---|---|---|
| 1 Miserable or unhappy | 73.6 | 90.6 | 90.0-92.0 | 31.3 | 29.7-32.9 | 27.5 | 25.9-29.2 | 92.1 | 90.6-93.3 |
| 2 Didn’t enjoy anything | 29.5 | 48.3 | 45.4-51.2 | 75.9 | 74.4-77.4 | 36.6 | 34.2-39.0 | 83.4 | 82.2-84.9 |
| 3 Tired | 60.2 | 74.0 | 70.9-76.9 | 43.8 | 41.7-45.9 | 27.5 | 25.7-29.3 | 85.4 | 83.6-87.0 |
| 4 Restless (couldn’t sit still) | 59.3 | 74.5 | 71.8-77.0 | 45.1 | 43.4-46.8 | 28.1 | 26.3-30.0 | 83.6 | 84.3-87.5 |
| 5 No good | 30.8 | 59.2 | 56.3-62.0 | 77.4 | 76.1-78.7 | 43.0 | 40.5-45.6 | 86.8 | 85.6-88.0 |
| 6 Cried a lot | 24.9 | 45.9 | 43.2-48.6 | 81.2 | 79.9-82.4 | 41.3 | 38.5-44.1 | 83.9 | 82.6-85.1 |
| 7 Poor concentration | 59.9 | 79.8 | 77.4-82.1 | 45.9 | 43.9-47.9 | 29.8 | 28.0-31.7 | 88.9 | 87.3-90.1 |
| 8 Hated myself | 25.8 | 54.2 | 51.3-57.1 | 82.4 | 81.2-83.5 | 47.0 | 44.2-49.8 | 86.2 | 85.0-87.4 |
| 9 Bad person | 21.8 | 40.3 | 37.3-43.3 | 83.5 | 82.1-84.8 | 41.2 | 38.3-44.3 | 82.9 | 81.6-84.2 |
| 10 Lonely | 46.5 | 71.8 | 69.2-74.2 | 60.8 | 59.1-62.4 | 34.5 | 32.4-36.7 | 88.2 | 86.9-89.4 |
| 11 Unloved | 27.1 | 54.1 | 51.2-56.9 | 80.7 | 79.4-81.9 | 44.6 | 41.8-47.5 | 85.9 | 84.7-87.1 |
| 12 Never be any good | 41.4 | 66.9 | 64.2-69.6 | 66.0 | 64.3-67.6 | 36.2 | 33.9-38.5 | 87.4 | 86.0-88.6 |
| 13 Did everything wrong | 26.5 | 48.3 | 45.3-51.4 | 79.8 | 78.4-81.2 | 40.8 | 38.0-43.7 | 84.3 | 83.0-85.5 |
Each item coded as present if participant reported it as at least sometimes true
Prev = prevalence of response of “sometimes true” or “true”, CI = confidence interval, Sens = sensitivity, Spec = specificity, PPV = positive predictive value, NPV = negative predictive value (definitions provided in text)
3.2. Empirical cut-off
ROC analysis ascertained that the best threshold or cut-off on total baseline SMFQ score, in regard to predicting 12 month SMFQ caseness, was equal to a score of seven or greater. Although in practice cut-offs usually do not take gender or other factors into account, the same cut-off was obtained for both males and females, VIC and WA students, and both younger than, and equal to or older than, the median age (13.0). For the total group, a cut-off of seven exhibited a sensitivity of 76.5% (95% CI = 73.9% to 78.8%) and a specificity of 67.7% (95% CI = 66.0% to 69.3%). The total area under the ROC curve, expressed as a percentage, was 78.9% (95% CI = 77.2% to 80.2%).
3.3. Logistic regression
The results of the logistic regression analyses of all 13 SMFQ items entered simultaneously into the model are shown in Table 2. As the crude and adjusted (for age, gender and state) odds ratios were found to be very similar, only the latter are shown. A preliminary overall test, examining possible interactions between gender and each of the 13 SMFQ items simultaneously, was not statistically significant (Wald test (Hosmer and Lemeshow, 2000), adjusted for age and state, p = 0.87). Similarly, an overall test examining possible interactions between state (Victoria, Washington) and each of the 13 SMFQ items simultaneously, was not statistically significant (Wald test, adjusted for age and gender, p = 0.19). Finally, an overall test examining possible interactions between age of student and each of the 13 SMFQ items simultaneously, was not statistically significant (Wald test, adjusted for state and gender, p = 0.28).
Table 2.
Logistic regression predicting SMFQ caseness at 12 month follow-up from baseline SMFQ items (binary coding)
| SMFQ itema | adjusted ORb | P value | 95% CI |
|---|---|---|---|
| 1 Miserable or unhappy | 1.4 | p < 0.001 | 1.2-1.8 |
| 2 Didn’t enjoy anything | 1.2 | 0.03 | 1.01-1.4 |
| 3 Tired | 1.1 | 0.31 | 0.9-1.3 |
| 4 Restless (couldn’t sit still) | 1.4 | p < 0.001 | 1.1-1.6 |
| 5 No good | 1.4 | p < 0.001 | 1.2-1.7 |
| 6 Cried a lot | 1.3 | p < 0.001 | 1.1-1.6 |
| 7 Poor concentration | 1.4 | p < 0.001 | 1.1-1.6 |
| 8 Hated myself | 1.6 | p < 0.001 | 1.3-2.0 |
| 9 Bad person | 1.2 | 0.03 | 1.02-1.5 |
| 10 Lonely | 1.4 | p < 0.001 | 1.2-1.6 |
| 11 Unloved | 1.5 | p < 0.001 | 1.2-1.8 |
| 12 Never be any good | 1.5 | p < 0.001 | 1.2-1.7 |
| 13 Did everything wrong | 1.3 | 0.01 | 1.1-1.5 |
Each item coded as present if participant reported it as at least sometimes true
Logistic regressions were performed with all SMFQ items entered simultaneously, with the outcome being 12 month SMFQ caseness (score of 11 or higher), taking clustering by school into account. Odds ratios (OR) are adjusted for the possible confounders of gender, age at baseline and state (Washington, Victoria).
All associations between SMFQ items and SMFQ caseness at 12 months were moderate (odds ratios ranging from 1.1 to 1.6) and statistically significant, apart from that for item three “I felt so tired I just sat around and did nothing”. This item exhibited similar sensitivity, specificity, positive predictive value and negative predictive value to item seven “I found it hard to think properly or concentrate”.
3.4. Classification and Regression Trees (CART)
In addition to the 13 SMFQ items, gender, age at baseline, and state (WA, VIC) were available for selection by CART, although only the SMFQ items were actually selected by the procedure. The resulting tree is shown in Figure 1.
Figure 1.
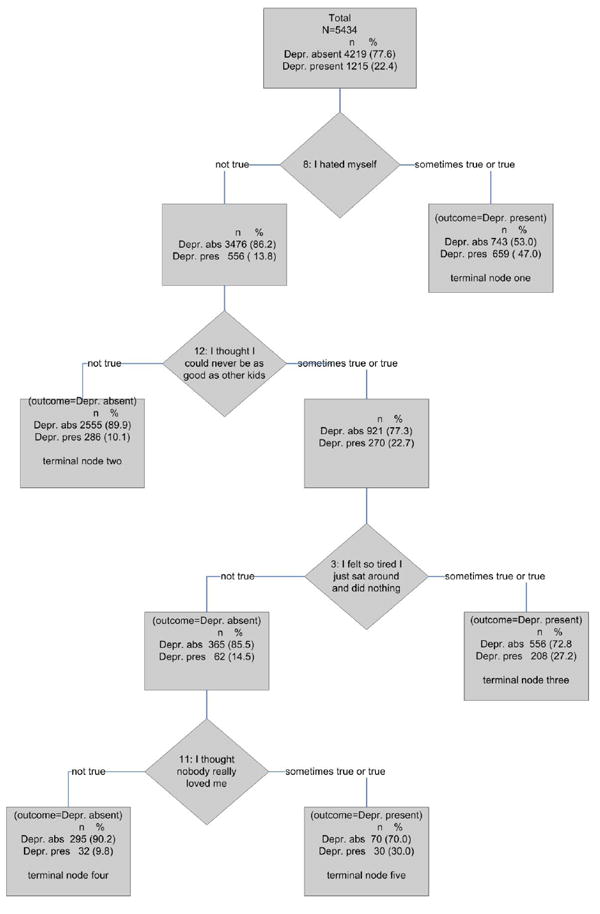
CART (Classification and Regression Tree) analysis predicting SMFQ caseness at 12 month follow-up
At each stage of the tree-growing, CART chooses that variable with the lowest Gini index, a measure of subgroup homogeneity or purity, on which to split the dataset (Breiman et al., 1984). Splitting is continued until each subgroup is either fully homogenous (only one outcome present), or becomes too small (e.g., five observations or less) for further splitting. The resulting tree is then pruned back, balancing ‘cost’ (cross-validated performance) against ‘complexity’ (number of non-terminal nodes) (Breiman et al., 1984).
The variable first selected by CART to split the dataset was SMFQ item eight “I hated myself”. The subgroup consisting of students responding “sometimes true” or “true” to item eight was not able to be split any further, as any increase in the number of nodes was not accompanied by a commensurate increase in performance. This node is therefore classed as a terminal node (terminal node one in Figure 1).
The subgroup comprising students that responded “not true” to item eight was subsequently split on SMFQ item twelve “I thought I could never be as good as other kids”. The subgroup of students responding “not true” to item twelve were not able to be split any further, and so form the second terminal node. Those students responding “sometimes true” or “true” to item twelve were split on item three “I felt so tired I just sat around and did nothing”. The subgroup of students responding "sometimes true" or "true" to item three was not able to be split any further and so forms terminal node three. The students responding “not true” to item three were split on item eleven “I thought nobody really loved me”. Neither of the resulting subgroups was able to be split any further, forming terminal nodes four and five.
To examine possible confounding, we compared the five terminal nodes or subgroups of the final tree using logistic regression, adjusting for the possible confounders of gender, age and state. These variables were available to, but not chosen by, CART. Very similar logistic regression results (not shown) were obtained with and without adjustment for possible confounders, and with and without adjustment for clustering by school.
The above results apply to the CART analysis of individual SMFQ items. When total baseline SMFQ score was entered into CART, the procedure selected the same cut-off value (seven or greater) as that selected using the ROC analysis described above, and did not subsequently choose any of the individual items.
3.5. Performance of screening rules
The screening and diagnostic performance of each rule is given in Table 3. The empirically determined baseline SMFQ total score cut-off, of seven or higher, showed higher sensitivity and negative predictive value, but lower specificity and positive predictive value, than the commonly employed cut-off of 11 or more. Logistic regression performed almost identically to the empirical cut-off. The CART tree, based upon only four items, exhibited approximately the same specificity as the above methods, but had lower sensitivity and area under the ROC curve. In the case of CART, the latter was based on only a limited number of points, corresponding to the percentage of 12 month cases observed at each of the five terminal nodes (Batterham et al., 2009).
Table 3.
Performance of screening instruments at predicting SMFQ caseness at 12 month follow-up
| Rule | Sensa | 95% CI | Spec | 95% CI | PPV | 95% CI | NPV | 95% CI | ROC curve area | 95% CI |
|---|---|---|---|---|---|---|---|---|---|---|
| Conventional cut-off: SMFQ total score = > 11 | 53.1 | 49.3-55.0 | 86.7 | 85.6-87.8 | 52.2 | 50.0-56.2 | 86.3 | 85.2-87.4 | N/A | N/A |
| Empirical cut-off: = > 7 | 76.5 | 73.9-78.8 | 67.7 | 66.0-69.3 | 40.5 | 38.3-42.8 | 90.9 | 89.8-91.9 | 78.8 | 77.2-80.2 |
| Logistic regression (13 item) | 76.4 | 73.8-78.8 | 67.4 | 65.7-69.0 | 40.3 | 38.1-42.5 | 90.8 | 89.7-91.8 | 78.6 | 77.1-80.1 |
| CART decision tree | 73.8 | 71.1-76.4 | 67.6 | 66.0-69.1 | 39.6 | 37.3-41.9 | 90.0 | 88.8-91.0 | 73.0 | 71.5-78.6 |
CI = confidence interval, Sens = sensitivity, Spec = specificity, PPV = positive predictive value, NPV = negative predictive value (definitions provided in text)
4. Discussion
Our study contributes new information about the utility of early adolescent symptoms in predicting subsequent high levels of depression symptoms. A relatively low level of depression (cut-off of seven or higher on the total SMFQ score, and a subset of four items) can provide efficient prediction of later elevated levels of adolescent depression. The quality or type of symptoms is also important. For example, low self-worth was more predictive of high levels of depression symptomatology at 12 months than either of the items associated with the two core features of DSM/ICD depression, depressed mood (“I felt miserable or unhappy” and anhedonia (“I didn’t enjoy anything at all”).
The CART analyses found that the symptom “I hated myself” was most predictive of high depressive symptoms 12 months later. Two other predictive combinations of items were also identified. The first predictive combination consisted of the presence of feelings of never being as good as others, and of being unloved, but the absence of feelings of hating oneself and feelings of tiredness. The other predictive combination consisted of the presence of feelings of never being as good as others, and of feelings of tiredness, but the absence of feelings of self-hatred. These predictions were maintained even when any effects of gender, state and age were controlled for using logistic regression.
An overall baseline SMFQ score of seven or higher exhibited better performance, in terms of higher sensitivity and specificity, but lower positive predictive value, than the conventionally employed cut-off of 11 or higher. The latter threshold was not originally developed for use in prediction, however. SMFQ caseness at 12 months is itself based upon a simple cut-off (11+), which may favour rules built on the simple summation of items. The logistic regression model provided useful information on the importance of each SMFQ item, in the form of odds ratios, and performed as well as the empirical cut-off, in regard to all of the measures reported in Table 3. The CART tree did not perform quite as well as the empirical cut-off or logistic regression, although the present study is not intended as a formal comparison of the techniques. Tree-building methods have been shown to perform better, (Allore et al., 2005; Batterham et al., 2009), worse (Austin et al., 2010; Wolfe et al., 2006), or about the same as, regression (Lim et al., 2000), with no single computational or statistical method having been shown to be consistently better across different datasets (Alpaydin, 2010).
Logistic regression readily allows direct adjustment for possible confounders such as gender, as well as clustered data, the latter being difficult to handle using current tree-building methods. On the other hand, procedures such as CART incorporate built-in cross-validation techniques, and readily cast light on combinations of items highly associated with 12 month SMFQ caseness. The CART tree shown in Figure 1 represents a brief screening instrument, based on only four items, whereas the cut-offs and logistic regression were based on all 13 SMFQ items. Similarly, although the logistic regression model indicated that the association between feelings of tiredness and 12 month SMFQ caseness was not statistically significant, CART found that tiredness combined with feelings of never being as good as others was associated with 12 month caseness.
Although variable selection methods (Hosmer and Lemeshow, 2000) could be used to develop brief screening tests based upon logistic regression, a potential advantage of brief tests generated by CART is the branching nature of decision trees. Each participant may not necessarily be required to answer each question. In the present application for example, respondents answering in the affirmative to ‘I hated myself’, would not need to answer any further questions. In contrast, a logistic regression equation based upon four symptoms would require information on all four symptoms. As the two techniques have their own advantages and disadvantages, it is suggested that CART be employed in conjunction with logistic regression.
In regard to content, most brief depression screening instruments (Lowe et al., 2010), including those for use with adolescents (Rhew et al., 2010), tend to concentrate on depressed mood and anhedonia, the two core symptoms of ICD / DSM depression. Such symptoms have been found to have high predictive value, as does feelings of worthlessness (Wilcox and Anthony, 2004), included in a small number of brief depression screening tests (Cully et al., 2005; McKenzie et al., 2010a). Our CART and logistic regression results also show the importance of looking at other symptoms of depression, such as feelings of being unloved, which may not be part of formal diagnostic criteria.
Further research is required in order to gain greater theoretical understanding of feelings of being unloved and never being as good as others. For example, a study of adolescents found that two items measuring self-worth also loaded highly on a factor representing demoralization (Weber, 2000). Demoralization is typified by feelings of helplessness, hopelessness, and worthlessness (Clarke et al., 2000; Frank and Frank, 1973). Although not directly measured by the SMFQ, worthlessness has been found to be predictive of subsequent depression in adolescents (Wilcox and Anthony, 2004), and adults (Murphy et al., 2002).
An important implication of our findings is that high levels of depression symptoms can be determined from specific symptoms reported 12 months previously. Brief screening rules, such as the one generated using CART, may be usefully employed in schools or other settings, although caution must be exercised. In particular, emotions commonly but transiently experienced by adolescents as a result of stressors such as relationship problems, could otherwise be labeled as depression. This may result in undue distress and social stigma (Horwitz and Wakefield, 2009). Although problematic, early identification of depression and other disorders would ideally facilitate intervention and treatment.
For example, it has recently been suggested that clinical staging models, widely employed in clinical medicine, could usefully be applied to depression (Hetrick et al., 2008), as well as other psychiatric disorders (McGorry et al., 2006). Identification of disorders at an early stage allows the use of simpler and more benign targeted interventions, leading to a better prognosis. For such screening to be effective it must be accompanied by ready access to diagnostic and treatment options (Sanci et al., 2010), as recently recommended by the US Preventive Services Task Force (US Preventive Services Task Force, 2009).
In regard to scoring of screening instruments, CART can output trees in a form that is able to be compiled on most computers, including handheld devices, in a similar manner to the Chicago Adolescent Depression Risk Assessment (CADRA) (Van Voorhees et al., 2008). It is likewise a simple matter to codify logistic regression equations, to facilitate computer-based screening. Computer-based screening has been found to work at least as well as ‘pen and paper’ tests (Patton et al., 1999), while a recent study found that young persons may be more comfortable in disclosing sensitive information to a computer than to a person (Stevens et al., 2008). Provided that various problems with administration can be overcome, direct data entry and scoring in places such as waiting rooms may facilitate screening for depression.
The use of automated screening tests obviously requires the use of computers or other devices, which may not always be readily available. Simple cut-off scores often perform well in practice, but provide little information as to which specific items are important (McKenzie et al., 2004). It is generally straightforward for clinicians, parents, teachers and health professionals to look out for the presence of small numbers of key symptoms, or combinations of symptoms that may be identified using methods such as CART (McKenzie et al., 2010a). Such symptom identification could supplement the use of more formal screening procedures.
The strengths of our study are the large sample size, very low number of missing observations, the exploration of gender as well as country-context interaction, and the use of statistical techniques examining the quality of symptoms, as well as the quantity of symptoms. A limitation of the study is that there was no criterion standard diagnostic interview for depression, such as the Composite International Diagnostic Interview (CIDI) (Robins et al., 1988). If such an instrument had been used, the various screening rules could have been tested against a diagnostic standard. In addition, the optimum cut-off for determining 12 month caseness on the SMFQ, as well as caseness at baseline, could have been empirically determined using ROC analysis. Furthermore, use of a diagnostic standard would have enabled more accurate estimation of the prevalence of depression, self-report screening instruments generally over-estimating caseness {Kraemer, 1992 #928}. Based upon the conventional cut-off of an SMFQ score of 11 or higher, almost a quarter of the students exceeded this cut-off at baseline, and at 12 months. Further research into determining SMFQ cut-offs, with the use of a diagnostic standard, would appear to be required.
Another limitation is that we are only predicting depression over two waves of data. Although depressive symptoms that emerge in adolescence are associated with depression in adulthood (Colman et al., 2007; Pine et al., 1999; van Lang et al., 2007; Van Voorhees et al., 2008; Wilcox and Anthony, 2004), there is evidence that adolescent depression may be highly episodic in nature (Holsen et al., 2000; Mazza et al., 2010). Moreover, the stability of specific depressive symptoms, as well as the overall number of symptoms, would appear to be low across 12 month and longer periods (Lewinsohn et al., 2003). Examination of the persistence or otherwise of depressive symptomatology would require more than one follow-up.
In conclusion, although further validation on other populations, accompanied by the use of a diagnostic standard, is required, our results suggest that several symptoms of depression, especially feelings of self-hatred, and being unloved, are associated with increased levels of self-reported early adolescent depression at 12 months. Such symptoms should be considered for inclusion in screening tests for adolescent depression that focus on the type of symptoms present.
Footnotes
Publisher's Disclaimer: This is a PDF file of an unedited manuscript that has been accepted for publication. As a service to our customers we are providing this early version of the manuscript. The manuscript will undergo copyediting, typesetting, and review of the resulting proof before it is published in its final citable form. Please note that during the production process errors may be discovered which could affect the content, and all legal disclaimers that apply to the journal pertain.
Role of funding source
Data collection for this research was supported through a grant from the National Institute on Drug Abuse (DA-012140-05), National Institutes of Health, United States Department of Health and Human Services (RF Catalano, Principal Investigator). Data analysis was supported by grants from the Australian Research Council and Australian Health Management. DP McKenzie is supported through a Postdoctoral Public Health Fellowship from the National Health and Medical Research Council of Australia (NH&MRC), and a grant from Australian Health Management. JW Toumbourou is supported through a Victorian Health Promotion Foundation Fellowship. RF Catalano and BJ McMorris are supported through a grant from the National Institute on Alcohol Abuse and Alcoholism (R01-AA017188). GC Patton is supported through an NH&MRC Senior Principal Research Fellowship. None of the funding bodies had any further role in the collection, analysis and interpretation of data, in the writing of the report; and in the decision to submit the paper for publication. The content of this paper is solely the responsibility of the authors and does not necessarily represent the official views of the funding agencies.
References
- Allore H, Tinetti ME, Araujo KLB, Hardy S, Peduzzi P. A case study found that a regression tree outperformed multiple linear regression in predicting the relationship between impairments and Social and Predictive Activities scores. Journal of Clinical Epidemiology. 2005;58:154–161. doi: 10.1016/j.jclinepi.2004.09.001. [DOI] [PubMed] [Google Scholar]
- Alpaydin E. Introduction to machine learning. 2. MIT Press; Cambridge, Massachusetts: 2010. [Google Scholar]
- Angold A, Costello EJ, Messer SC, Pickles A, Winder F, Silver D. Development of a short questionnaire for use in epidemiological studies of depression in children and adolescents. International Journal of Methods in Psychiatric Research. 1995;5:237–249. [Google Scholar]
- Angold A, Erkanli A, Silberg J, Eaves L, Costello EJ. Depression scale scores in 8-17-year-olds: effects of age and gender. Journal of Child Psychology and Psychiatry. 2002;43:1052–1063. doi: 10.1111/1469-7610.00232. [DOI] [PubMed] [Google Scholar]
- Austin PC, Tu JV, Lee DS. Logistic regression had superior performance compared with regression trees for predicting in-hospital mortality in patients hospitalized with heart failure. Journal of Clinical Epidemiology. 2010;63:1145–1155. doi: 10.1016/j.jclinepi.2009.12.004. [DOI] [PubMed] [Google Scholar]
- Batterham PJ, Christensen H, Mackinnon AJ. Modifiable risk factors predicting major depression disorder at four year follow-up: a decision-tree approach. BMC Psychiatry. 2009;9:75. doi: 10.1186/1471-244X-9-75. [DOI] [PMC free article] [PubMed] [Google Scholar]
- Breiman L, Friedman J, Olshen RA, Stone CJ. Classification and regression trees. Wadsworth; Belmont, California: 1984. [Google Scholar]
- Calvocoressi L, Stolar M, Kasl SV, Claus EB, Jones BA. Applying recursive partitioning to a prospective study of factors associated with adherence to mammography screening guidelines. American Journal of Epidemiology. 2005;162:1215–1224. doi: 10.1093/aje/kwi337. [DOI] [PubMed] [Google Scholar]
- Clarke DM, Mackinnon AJ, Smith GC, McKenzie DP, Herrman HE. Dimensions of psychopathology in the medically ill: a latent trait approach. Psychosomatics. 2000;41:418–425. doi: 10.1176/appi.psy.41.5.418. [DOI] [PubMed] [Google Scholar]
- Colman I, Wadsworth MEJ, Croudace TJ, Jones PB. Forty-year psychiatric outcomes following assessment for internalizing disorder in adolescence. American Journal of Psychiatry. 2007;164:126–133. doi: 10.1176/ajp.2007.164.1.126. [DOI] [PubMed] [Google Scholar]
- Costello EJ, Mustillo S, Erkanli A, Keeler G, Angold A. Prevalences and development of psychiatric disorders in childhood and adolescence. Archives of General Psychiatry. 2003;60:837–844. doi: 10.1001/archpsyc.60.8.837. [DOI] [PubMed] [Google Scholar]
- Craig TJ, Siegel C, Hopper K, Lin S, Sartorius N. Outcome in schizophrenia and related disorders compared between developing and developed countries: a recursive partitioning reanalysis of the WHO DOSMD data. British Journal of Psychiatry. 1997;170:229–233. doi: 10.1192/bjp.170.3.229. [DOI] [PubMed] [Google Scholar]
- Cully JA, Graham DP, Kramer JR. A 2-item screen for depression in rehabilitation inpatients. Archives of Physical Medical Rehabilitation. 2005;86:469–472. doi: 10.1016/j.apmr.2004.04.042. [DOI] [PubMed] [Google Scholar]
- Davis SR, Shah SM, McKenzie DP, Kulkarni J, Davison SL, Bell RJ. Relationship between dehydropiandrosterone sulphate levels and cognitive function in women. Journal of Clinical Endocrinology and Metabolism. 2008;93:801–808. doi: 10.1210/jc.2007-2128. [DOI] [PubMed] [Google Scholar]
- Efron B, Tibshirani RJ. An introduction to the bootstrap. Chapman and Hall; New York: 1993. [Google Scholar]
- Frank JD, Frank JB. Persuasion and healing: a comparative study of psychotherapy. John Hopkins University Press; Baltimore, Maryland: 1973. [Google Scholar]
- Gruenewald TL, Mroczek DK, Ryff CD, Singer BH. Diverse pathways to positive and negative affect in adulthood and later life: an integrative approach using recursive partitioning. Developmental Psychology. 2008;44:330–343. doi: 10.1037/0012-1649.44.2.330. [DOI] [PubMed] [Google Scholar]
- Hetrick SE, Parker AG, Hickie IB, Purcell R, Yung AR, McGorry PD. Early identification and intervention in depressive disorders: towards a clinical staging model. Psychotherapy and Psychosomatics. 2008;77:263–270. doi: 10.1159/000140085. [DOI] [PubMed] [Google Scholar]
- Holsen I, Kraft P, Vitterso J. Stability in depressed mood in adolescence: results from a 6-year longitudinal study. Journal of Youth and Adolescence. 2000;29:61–78. [Google Scholar]
- Horwitz AV, Wakefield JC. Should screening for depression among children and adolescents be demedicalized? Journal of the American Academy of Child and Adolescent Psychiatry. 2009;48:683–687. doi: 10.1097/CHI.0b013e3181a5e3ad. [DOI] [PubMed] [Google Scholar]
- Hosmer DW, Lemeshow S. Applied logistic regression. Wiley; New York: 2000. [Google Scholar]
- Katon W, Russo J, Richardson L, McCauley E, Lozano P. Anxiety and depression screening for youth in a primary care population. Ambulatory Pediatrics. 2008;8:182–188. doi: 10.1016/j.ambp.2008.01.003. [DOI] [PMC free article] [PubMed] [Google Scholar]
- Kessler RC, Foster CL, Saunders WB, Stang PE. Social consequences of psychiatric disorders, I: Educational Attainment. American Journal of Psychiatry. 1995;152:1026–1032. doi: 10.1176/ajp.152.7.1026. [DOI] [PubMed] [Google Scholar]
- Kovacs M. The Children’s Depression Inventory (CDI) Psychopharmacology Bulletin. 1985;21:995–998. [PubMed] [Google Scholar]
- Kraemer HC. Evaluating medical tests: objective and quantitative guidelines. Sage; Newbury Park, California: 1992. [Google Scholar]
- Lewinsohn PM, Pettit JW, Joiner TE, Jr, Seeley JR. The symptomatic expression of major depressive disorder in adolescents and young adults. Journal of Abnormal Psychology. 2003;112:244–252. doi: 10.1037/0021-843x.112.2.244. [DOI] [PubMed] [Google Scholar]
- Lim T-S, Loh W-Y, Shih Y-S. A comparison of prediction accuracy, complexity, and training time of thirty-three old and new classification algorithms. Machine Learning. 2000;40:203–228. [Google Scholar]
- Lowe B, Wahl I, Rose M, Spitzer C, Glaesmer H, Wingenfeld K, Schneider A, Brahler E. A 4-item measure of depression and anxiety: validation and standardization of the Patient Health Questionnaire-4 (PHQ-4) in the general population. Journal of Affective Disorders. 2010;122:86–95. doi: 10.1016/j.jad.2009.06.019. [DOI] [PubMed] [Google Scholar]
- Mazza JJ, Fleming CB, Abbott RD, Haggerty KP, Catalano RF. Identifying trajectories of adolescents’ depressive phenomena: an examination of early risk factors. Journal of Youth and Adolescence. 2010;39:579–593. doi: 10.1007/s10964-009-9406-z. [DOI] [PMC free article] [PubMed] [Google Scholar]
- McGorry PD, Hickie IB, Yung AR, Pantelis C, Jackson HJ. Clinical staging of psychiatric disorders: a heuristic framework for choosing earlier, safer and more effective interventions. Australian and New Zealand Journal of Psychiatry. 2006;40:616–622. doi: 10.1080/j.1440-1614.2006.01860.x. [DOI] [PubMed] [Google Scholar]
- McGorry PD, McKenzie D, Jackson HJ, Waddell F, Curry C. Can we improve the diagnostic efficiency and predictive power of prodromal symptoms for schizophrenia? Schizophrenia Research. 2000;42:91–100. doi: 10.1016/s0920-9964(99)00125-5. [DOI] [PubMed] [Google Scholar]
- McKenzie DP, Clarke DM, Forbes AB, Sim MR. Pessimism, worthlessness, anhedonia and thoughts of death identify DSM-IV major depression in hospitalized medically ill. Psychosomatics. 2010a;51:302–311. doi: 10.1176/appi.psy.51.4.302. [DOI] [PubMed] [Google Scholar]
- McKenzie DP, Creamer M, Kelsall HL, Forbes AB, Ikin JF, Sim MR, McFarlane AC. Temporal relationships between Gulf War deployment and subsequent psychological disorders. Social Psychiatry and Psychiatric Epidemiology. 2010b;45:843–852. doi: 10.1007/s00127-009-0134-1. [DOI] [PubMed] [Google Scholar]
- McKenzie DP, Ikin JF, McFarlane AC, Creamer M, Forbes AB, Kelsall HL, Glass DC, Ittak P, Sim MR. Psychological health of Australian veterans of the 1991 Gulf War: an assessment using the SF-12, GHQ-12 and PCL-S. Psychological Medicine. 2004;34:1419–1430. doi: 10.1017/s0033291704002818. [DOI] [PubMed] [Google Scholar]
- McKenzie DP, McFarlane AC, Creamer M, Ikin J, Forbes AB, Kelsall HL, Clarke DM, Glass DC, Ittak P, Sim MR. Hazardous or harmful alcohol use in Royal Australian Navy veterans of the 1991 Gulf War: identification of high risk subgroups. Addictive Behaviors. 2006;31:1683–1694. doi: 10.1016/j.addbeh.2005.12.027. [DOI] [PubMed] [Google Scholar]
- McKenzie DP, McGorry PD, Wallace CS, Low LH, Copolov DL, Singh BS. Constructing a minimal diagnostic decision tree. Methods of Information in Medicine. 1993;32:161–166. [PubMed] [Google Scholar]
- McKenzie M, Olsson CA, Jorm AF, Romaniuk H, Patton GC. Association of adolescent symptoms of depression and anxiety with daily smoking and nicotine dependence in young adulthood: findings from a 10-year longitudinal study. Addiction. 2010;105:1652–1659. doi: 10.1111/j.1360-0443.2010.03002.x. [DOI] [PubMed] [Google Scholar]
- McMorris BJ, Hemphill SA, Toumbourou JW, Catalano RF, Patton GC. Prevalence of substance use and delinquent behavior in adolescents from Victoria, Australia and Washington State, United States. Health Education and Behavior. 2007;34:634–650. doi: 10.1177/1090198106286272. [DOI] [PubMed] [Google Scholar]
- Messer SC, Angold A, Costello EJ, Loeber R, Van Kammen W, Southamer-Loeber M. Development of a short questionnaire for use in epidemiological studines of depression in children and adolescents: factor composition and structure across development. International Journal of Methods in Psychiatric Research. 1995;5:251–262. [Google Scholar]
- Muller R, Buttner P. A critical discussion of intraclass correlation coefficients. Statistics in Medicine. 1994;13:2465–2476. doi: 10.1002/sim.4780132310. [DOI] [PubMed] [Google Scholar]
- Murphy JM, Nierenberg AA, Monson RR, Laird NM, Sobol AM, Leighton AH. Self-disparagement as feature and forerunner of depression: findings from the Stirling County Study. Comprehensive Psychiatry. 2002;43:13–21. doi: 10.1053/comp.2002.29842. [DOI] [PubMed] [Google Scholar]
- Najman JM, Heron MA, Hayatbakhsh MR, Dingle K, Jamrozik K, Bor W, O’Callaghan MJ, Williams GM. Screening in early childhood for risk of later mental health problems: a longitudinal study. Journal of Psychiatric Research. 2008;42:694–700. doi: 10.1016/j.jpsychires.2007.08.002. [DOI] [PubMed] [Google Scholar]
- O’Donnell K, Wardle J, Dantzer C, Steptoe A. Alcohol consumption and symptoms of depression in young adults from 20 countries. Journal of Studies of Alcohol. 2006;67:837–840. doi: 10.15288/jsa.2006.67.837. [DOI] [PubMed] [Google Scholar]
- Patton GC, Coffey C, Carlin JB, Degenhardt L, Lynskey M, Hall W. Cannabis use and mental health in young people: cohort study. British Medical Journal. 2002;325:1195–1198. doi: 10.1136/bmj.325.7374.1195. [DOI] [PMC free article] [PubMed] [Google Scholar]
- Patton GC, Coffey C, Posterino M, Carlin JB, Wolfe R. Adolescent depressive disorder: a population-based study of ICD-10 symptoms. Australian and New Zealand Journal of Psychiatry. 2000;34:741–747. doi: 10.1080/j.1440-1614.2000.00825.x. [DOI] [PubMed] [Google Scholar]
- Patton GC, Coffey C, Posterino M, Carlin JB, Wolfe R, Bowes G. A computerised screening instrument for adolescent depression: population-based validation and application to a two-phase case-control study. Social Psychiatry and Psychiatric Epidemiology. 1999;34:166–172. doi: 10.1007/s001270050129. [DOI] [PubMed] [Google Scholar]
- Patton GC, Olsson C, Bond L, Toumbourou JW, Carlin JB, Hemphill SA, Catalano RF. Predicting female depression across puberty: a two-nation longitudinal study. Journal of the American Academy of Child and Adolescent Psychiatry. 2008;47:1424–1432. doi: 10.1097/CHI.0b013e3181886ebe. [DOI] [PMC free article] [PubMed] [Google Scholar]
- Pine DS, Cohen E, Cohen P, Brook J. Adolescent depressive symptoms as predictors of adult depression: moodiness or mood disorder? American Journal of Psychiatry. 1999;156:133–135. doi: 10.1176/ajp.156.1.133. [DOI] [PubMed] [Google Scholar]
- Rhew IC, Simpson K, Tracy M, Lymp J, McCauley E, Tsuang D, Stoep AV. Criterion validity of the Short Mood and Feelings Questionnaire and one- and two-item depression screens in young adolescents. Child and Adolescent Psychiatry and Mental Health. 2010;4:8. doi: 10.1186/1753-2000-4-8. [DOI] [PMC free article] [PubMed] [Google Scholar]
- Robins LN, Wing J, Wittchen HU, Helzer JE, Babor TF, Burke J, Farmer A, Janlenski A, Pickens R, Regier DA, Sartorius N, Towle MS. The Composite International Diagnostic Interview : an epidemiological instrument suitable for use in conjunction with different diagnostic systems and in different cultures. Archives of General Psychiatry. 1988;45:1069–1077. doi: 10.1001/archpsyc.1988.01800360017003. [DOI] [PubMed] [Google Scholar]
- Roeder R, Roeder K, Asano E, Chugani HT. Depression and mental health help-seeking behaviors in a predominantly African American population of children and adolescents with epilepsy. Epilepsia. 2009;50:1943–1952. doi: 10.1111/j.1528-1167.2009.02046.x. [DOI] [PubMed] [Google Scholar]
- Rothon C, Head J, Clark C, Klineberg E, Cattell V, Stansfeld S. The impact of psychological distress on the educational achievement of adolescents at the end of compulsory education. Social Psychiatry and Psychiatric Epidemiology. 2009;44:421–427. doi: 10.1007/s00127-008-0452-8. [DOI] [PMC free article] [PubMed] [Google Scholar]
- Sanci L, Lewis D, Patton G. Detecting emotional disorder in young people in primary care. Current Opinion in Psychiatry. 2010;23:318–323. doi: 10.1097/yco.0b013e32833aac38. [DOI] [PubMed] [Google Scholar]
- Sawyer MG, Pfeiffer S, Spence SH, Bond L, Graetz B, Kay D, Patton G, Sheffield J. School-based prevention of depression: a randomised controlled study of the Beyondblue schools research initiative. Journal of Child Psychology and Psychiatry. 2010;51:199–209. doi: 10.1111/j.1469-7610.2009.02136.x. [DOI] [PubMed] [Google Scholar]
- Schmitz N, Kugler J, Rollnik J. On the relationship between neuroticism, self-esteem, and depression: results from the National Comorbidity survey. Comprehensive Psychiatry. 2003;44:169–176. doi: 10.1016/S0010-440X(03)00008-7. [DOI] [PubMed] [Google Scholar]
- Schoevers RA, Smit F, Deeg DJ, Cuijpers P, Dekker J, van Tilburg W, Beekman AT. Prevention of late-life depression in primary care: do we know where to begin? American Journal of Psychiatry. 2006;163:1611–1621. doi: 10.1176/ajp.2006.163.9.1611. [DOI] [PubMed] [Google Scholar]
- Stevens J, Kelleher KJ, Gardner W, Chisolm D, McGeehan J, Pajer K, Buchanan L. Trial of computerized screening for adolescent behavioral concerns. Pediatrics. 2008;121:1099–1105. doi: 10.1542/peds.2007-1878. [DOI] [PubMed] [Google Scholar]
- Strobl C, Malley J, Tutz G. An introduction to recursive partitioning: rationale, application, and characteristics of classification and regression trees, bagging, and random forests. Psychological Methods. 2009;14:323–348. doi: 10.1037/a0016973. [DOI] [PMC free article] [PubMed] [Google Scholar]
- Sullivan PF, Kovalenko P, York TP, Prescott CA, Kendler KS. Fatigue in a community sample of twins. Psychological Medicine. 2003;33:197–201. doi: 10.1017/s0033291702007031. [DOI] [PubMed] [Google Scholar]
- US Preventive Services Task Force. Screening and treatment for major depressive disorder in children and adolescents. Pediatrics. 2009;123:1223–1228. doi: 10.1542/peds.2008-2381. [DOI] [PubMed] [Google Scholar]
- van Lang ND, Ferdinand RF, Verhulst FC. Predictors of future depression in early and late adolescence. Journal of Affective Disorders. 2007;97:137–144. doi: 10.1016/j.jad.2006.06.007. [DOI] [PubMed] [Google Scholar]
- Van Voorhees BW, Paunesku D, Gollan J, Kuwabara S, Reinecke M, Basu A. Predicting future risk of depressive episode in adolescents: the Chicago Adolescent Depression Risk Assessment (CADRA) Annals of Family Medicine. 2008;6:503–511. doi: 10.1370/afm.887. [DOI] [PMC free article] [PubMed] [Google Scholar]
- Vermunt JK, Magidson J. Latent class cluster analysis. In: Hagenaars JA, McCutcheon AL, editors. Applied latent class analysis. Cambridge University Press; Cambridge UK: 2002. pp. 89–106. [Google Scholar]
- Weber S. Factor structure of the Reynolds Adolescent Depression Scale in a sample of school-based adolescents. Journal of Nursing Measurement. 2000;8:23–40. [PubMed] [Google Scholar]
- White H. Maximum likelihood estimation of misspecified models. Econometrica. 1982;50:1–25. [Google Scholar]
- Wiffen BD, Rabinowitz J, Fleischhacker WW, David AS. Insight: demographic differences and associations with one-year outcome in schizophrenia and schizoaffective disorder. Clinical Schizophrenia and Related Psychoses. 2010;4:169–175. doi: 10.3371/CSRP.4.3.3. [DOI] [PubMed] [Google Scholar]
- Wilcox HC, Anthony JC. Child and adolescent clinical features as forerunners of adult-onset major depressive disorder: retrospective evidence from an epidemiological sample. Journal of Affective Disorders. 2004;82:9–20. doi: 10.1016/j.jad.2003.10.007. [DOI] [PubMed] [Google Scholar]
- Wolfe R, McKenzie DP, Black J, Simpson P, Gabbe BJ, Cameron PA. Models developed by three techniques did not achieve acceptable prediction of binary trauma outcomes. Journal of Clinical Epidemiology. 2006;59:26–35. doi: 10.1016/j.jclinepi.2005.05.007. [DOI] [PubMed] [Google Scholar]
- Wood A, Kroll L, Moore A, Harrington R. Properties of the Mood and Feelings questionnaire in adolescent psychiatric outpatients: a research note. Journal of Child Psychology and Psychiatry. 1995;36:327–334. doi: 10.1111/j.1469-7610.1995.tb01828.x. [DOI] [PubMed] [Google Scholar]