Abstract
X-Ray mammography is the standard for breast cancer screening. The development of alternative imaging modalities is desirable because Mammograms expose patients to ionizing radiation. Electrical Impedance Tomography (EIT) may be used to determine tissue conductivity, a property which is an indicator of cancer presence. EIT is also a low-cost imaging solution and does not involve ionizing radiation.
In breast EIT, impedance measurements are made using electrodes placed on the surface of the patient’s breast. The complex conductivity of the volume of the breast is estimated by a reconstruction algorithm. EIT reconstruction is a severely ill-posed inverse problem. As a result, noisy instrumentation and incorrect modelling of the electrodes and domain shape produce significant image artefacts. In this paper, we propose a method that has the potential to reduce these errors by accurately modelling the patient breast shape. A 3D hand-held optical scanner is used to acquire the breast geometry and electrode positions. We develop methods for processing the data from the scanner and producing volume meshes accurately matching the breast surface and electrode locations, which can be used for image reconstruction. We demonstrate this method for a plaster breast phantom and a human subject. Using this approach will allow patient-specific finite element meshes to be generated which has the potential to improve the clinical value of EIT for breast cancer diagnosis.
Keywords: Electrical Impedance Tomography, Breast Imaging, Mesh Generation, Breast Cancer Screening
1. Introduction
Electrical characterization of freshly excised tissue has demonstrated that there is significant contrast between conductivity of healthy and cancerous tissue (Jossinet 1996, Jossinet 1998). Contrast has also been demonstrated in-vivo using Electrical Impedance Tomography (Halter et al 2009, Poplack et al 2007).
Electrical Impedance Tomography (EIT) is an imaging technique that estimates the conductivity of a medium from electrical measurements. The interface to the patient consists of a set of electrodes applied to the skin surface. Current is applied through some electrodes and voltages are measured on other electrodes. By choosing different exciting and sensing electrode sets, several measurements can be taken, forming an EIT dataset. Estimation of the conductivity of the medium is formulated as a model fitting problem. Typically, a finite element (FE) mesh is created to represent the boundary shape of the domain and the electrodes. Laplace’s equation with boundary conditions specified by the Complete Electrode Model can be used to solve for the boundary measurements, given a distribution of conductivity (Lionheart et al 2004, Somersalo et al 1992).
The inverse problem involves fitting the model to the measured data. In most reconstruction algorithms, shape is fixed, and conductivity is the unknown. It is well-established that an incorrect domain shape will result in estimated conductivities that are inconsistent with the data (Lionheart 1998). EIT is a very ill-posed problem, therefore using an inaccurate model leads to pronounced image artefacts (Adler et al 1996, Barber and Brown 1988, Jain et al 1997, Kolehmainen et al 1997).
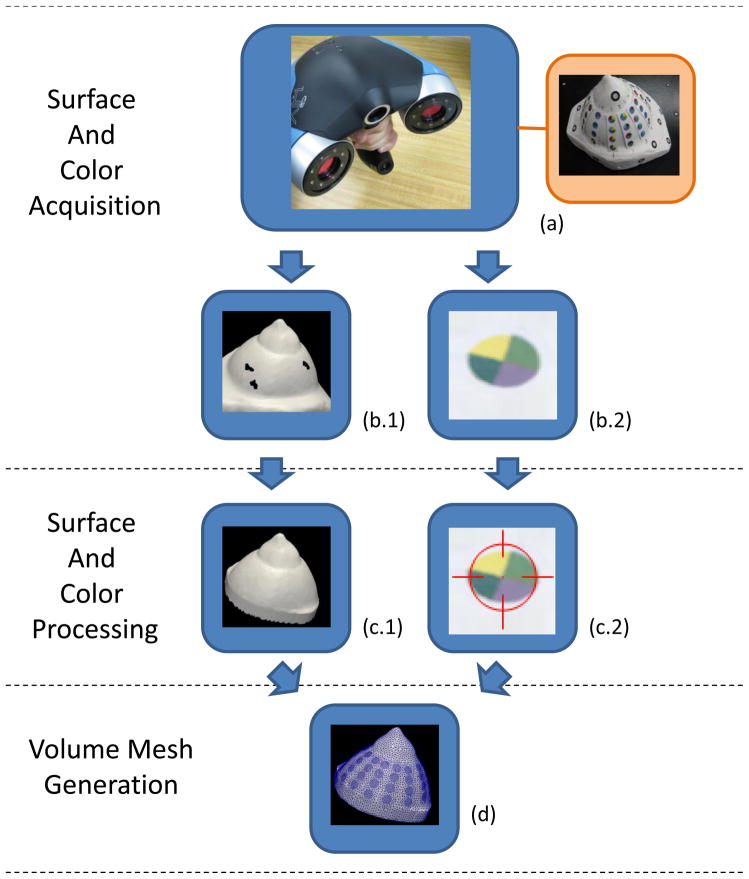
In the present paper we demonstrate a method for creating accurate FEM models by optically capturing breast shape and electrode positions and constructing volumetric meshes for use in reconstruction. In the following sections we demonstrate this method on a plaster breast phantom and in-vivo (Figure 1).
Figure 1.
The optical shape capture and meshing pipeline are shown in a flow chart. The hand-held Creaform VIUscan acquires the surface and color as a user navigates it in a “sweeping” motion over the target (a). The target shown is a plaster breast phantom used for testing. The outputs of the scanner are a surface mesh (b.1) and its color texture in a bitmap image (b.2). The surface mesh is processed by a surface fixing algorithm to fill holes (c.1). The color texture is processed by an electrode detection algorithm which locates and identifies electrodes in the image (c.2). The closed surface and electrode data are processed by a volume meshing algorithm to obtain the final mesh (d). The output mesh resembles the shape of the breast and has the electrode contours embedded.
2. Background
In EIT, shape data is not readily available, and a number of approaches for creating models with partial information have been developed. One approach is to use another imaging modality, such as MRI, to capture the shape. However, combining MRI would be impractical and would add considerably to the cost of EIT (Baker and Wheeler 1998, Brown and Barber 1995). A second approach is to create a template mesh based on average shape and size and warp it to fit a limited set of positional data points. Infrared transceivers are a possible means of acquiring this data by optically measuring the surface at a few points. None of the existing techniques for estimating the shape in EIT are sufficiently accurate or practical, so image quality has suffered (Frerichs 2000, Holder 1992, Kao et al 2007, Poplack et al 2007).
Difference imaging can be used to reduce the effects of shape errors (Borsic et al 2001, Jain et al 1997), however time differencing is not possible for cancer imaging. Instead, absolute images are reconstructed which are more sensitive to errors of shape. It is therefore important to have models which are as accurate as possible to produce clinically relevant absolute images.
EIT instrumentation systems are designed to satisfy strict error budgets to improve image quality as much as possible. The current system at Dartmouth has instrumentation error within 0.3%, which is common for state-of-the-art systems (Halter et al 2008). Analytical findings suggest reconstruction results are strongly sensitive to shape errors and less sensitive to measurement errors (Barber and Brown 1988). In typical applications, having an anatomically correct model is as important as precise instrumentation.
For breast cancer detection purposes, two groups have been active in EIT research for several years: Dartmouth College and Rensselaer Polytechnic Institute. The Rensselaer group is acquiring EIT data in the mammography geometry (Choi et al 2007). The breast is compressed by radio-lucent mammography plates that contain thin surface-mounted electrodes. EIT data and X-Ray images are acquired in this well known geometry, which is modelled as a box. This approach simplifies EIT reconstruction, but requires that EIT is used in conjunction with mammography. For EIT to become a cancer imaging alternative, it must be independent of traditional modalities.
The Dartmouth group’s breast EIT system uses positional information from the electrodes to determine the boundary shape. An exam table has been designed with a cylindrical opening in which electrodes are embedded (Figure 2(a)). During an exam, the patient lies prone with one breast pendant through this opening. Electrodes are mounted on rods which are brought into contact with the breast by stepper motors. Electrodes are arranged circularly in 4 parallel planes at different heights. The 16 electrodes on each plane are actuated together and are closed to make contact to the breast. The contact points are saved during the acquisition and FE meshes are constructed by combining cylinders, conic sections, and sphere sections to best fit the contact points. Figure 2(b) shows a typical mesh that is generated with this process. This approach produces models that match the limited shape information well, but are not an accurate representation of the breast.
Figure 2.
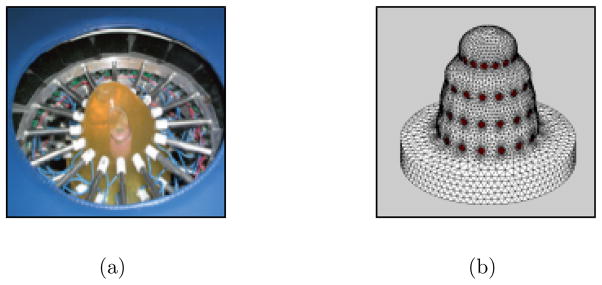
The current EIT system makes measurements on the surface of a breast by Ag/AgCl electrodes which are mounted on the ends of motorized rods (a). The electrodes are arranged in 4 parallel planes which are closed to make contact. The contact points are used in generation of finite element meshes. Meshes are created by fitting conic sections, cylindrical sections, and hemispheres to the contact points (b).
In EIT exams, the electrode rods tend to make contact with the breast in a way that causes slight indentations. Andrew Tizzard et al of Middlesex University developed an elastic deformation algorithm to warp existing meshes to account for these indentations (2010). The described meshing approaches are limited because they only collect a few position measurements of the breast surface. More accurate models can be attained with a complete surface capture.
3. Surface and Color Acquisition
The breast shape can acquired optically and saved in the form of a surface mesh (Figure 1(b.1)). We perform optical shape capture with a hand-held 3D scanner called the VIUscan (Creaform Inc. Quebec, Canada). It is capable of acquiring the surface of complex shapes with positional accuracies up to 50 μm. Figure 1(a) shows the scanner which is based on two cameras for stereo-vision and a laser. Reflective markers are placed in the scene and allow the scanner to track its own position in space (Figure 3(a)). The complete surface of an object may not be visible from a single viewpoint, therefore the device captures images continuously while the operator guides the device around the target. This allows the acquisition of a stream of data which is automatically stitched together to form the 3D surface. The operator may view a rendering of the acquired surface in real-time for feedback. The duration of a scanning session is approximately 5 minutes.
Figure 3.

The steps of the surface fixing algorithm are illustrated for the plaster breast phantom (a). The surface acquired by the scanner is shown in a computer rendering (b). The algorithm first cleans up the jagged edges of the mesh by clipping with a plane (c). Then all holes are filled to allow volume mesh generation (d).
In our proposed exam procedure, a patient will lie prone on a specially designed examination table with an opening for the breast to be imaged. Exams performed in this position are less susceptible to breathing artefacts because the patient anterior is fixed with respect to the chest restricting breathing movement to the back and spine. This allows the breast to remain virtually still during respiration. Minimization of movement allows the scanning device to accurately and efficiently acquire the shape.
The scanning device requires an unobstructed view of the breast, and the current EIT system’s electrode interface would impede the view. The EIT system proposed in this manuscript, which is in progress, will interface to a set of color coded electrodes, printed in strips of flexible Kapton circuit. The strips will be arranged radially on the breast with one end near the nipple and the other end near the base of the breast (Figure 3(a)). The breast surface including electrode strips can be scanned. After capturing the shape, EIT data may be collected.
4. Surface and Color Processing
4.1. Surface Fixing
After the breast scan is complete, processing of the surface mesh is required to remove holes before volume meshing. We developed algorithms using Visualization Toolkit (VTK) filters to perform the the surface fixing operations described in the following (Figure 1 (c.1)). The scanned surface will have an opening corresponding to the base of the breast and this boundary will be a have a jagged arrangement of elements (Figure 3(b)). The jagged elements are removed by performing a clean cut with a plane (Figure 3(c)). We add elements to fill this opening. The surface may also contain a few small holes as a result of incomplete scanning which are filled (Figure 3(d)). A VTK filter, based on the PhD work of Hugues Hoppe, provides the functionality of hole filling. (Hoppe et al 1992). It also allows us to select an appropriate mesh density.
4.2. Electrode Detection
In addition to the surface geometry, the scanner is capable of acquiring the surface colour Figure 1(b.2). Therefore we have the opportunity to colour code the electrodes and use the colour scheme to locate and identify them. Each electrode is assigned a unique colour pattern which allows it to be distinguished from other electrodes. We created an algorithm for detecting electrodes in the scanned colour surface which uses image processing techniques (Figure 1 (c.2)). Locating the electrodes allows their contours to be embedded into the surface of the volume mesh. Identifying the electrodes establishes the correspondence of electrode positions and channels of the EIT data acquisition unit.
4.2.1. Location
We developed a number of colour coding schemes for electrodes. In our application, as many as 64 electrodes may be used, so 64 unique colours, one per electrode were tested. However, colour variations in printing and scanning cause errors in identifying electrodes. To overcome this problem, we decided to use 8 well-separated \base” colours. The marker for each electrode is divided into 4 sections and each section receives 1 of the 8 base colours. This allows us to codify up to 64 electrodes by their unique colour combination. The colour separation is much greater with 8 base colours and this allows robust electrode identification. The coloured electrodes are shown on the breast phantom in Figure 3(a).
In order to recognize electrodes in the scene, we apply digital image processing (DIP) techniques. Many DIP functions are available for 2D image processing. Therefore, we transform the colour information, which is associated with the 3D surface, into a 2D image by spherical projection. This process is illustrated in Figure 4(a–b).
Figure 4.
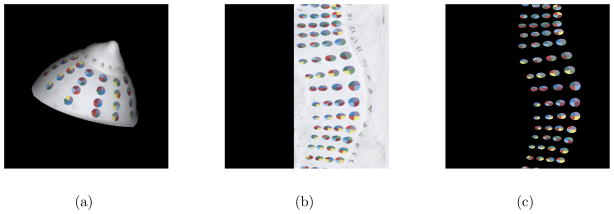
The steps of the electrode detection algorithm are illustrated for the breast phantom. Spherical projection transforms the 3D colour data from the surface mesh to a 2D image (a–b). Image processing techniques are used to identify the electrodes which allows masking of the breast surface (c). Each electrode is then identified by its 4 base colours.
The DIP techniques known as colour segmentation and watershed are applied to the image to locate electrodes. Once electrode regions are located, the colour of the breast surface may be masked from the image revealing only the regions of the electrodes (Figure 4(c)). Each region’s centroid is determined first in the image and we use the appropriate mapping to find the corresponding locations on the 3D surface of the mesh.
4.2.2. Identification
Each electrode is identified by its 4 base colours using color segmentation. The ID number of each electrode and its position in space are saved.
5. Volume Mesh Generation
In section 3 we described a procedure for optically capturing the shape and electrodes, and in section 4 we demonstrated methods for obtaining a closed surface and detecting electrodes. A volume meshing algorithm has been implemented to construct a mesh which resembles the shape of the surface and has the contours of the electrodes embedded (Figure 1(d)). The algorithm generates and optimizes a mesh by the criteria described in the following.
The accuracy of the solution depends on the size of the elements relative to the domain size. Smaller elements result in more accurate solutions (Cutler et al 2004). However, decreasing element size also increases computation time, so a compromise must be made. The field variables have fast spatial variations near the electrodes, therefore we increase element density in these regions.
The quality of mesh elements, determined by their shape, also influences the solution’s accuracy. Elements which are equilateral have optimal quality, therefore the algorithm is designed to create elements which are as close as possible to equilateral (Freitag and Knupp 2002).
To represent electrodes in a mesh, nodes may be inserted along the circular electrode boundaries. This produces meshes in which elements precisely follow the contour of electrodes. Unfortunately, embedding nodes tends to lower the overall quality of the mesh. For example, Figure 5(a) shows a mesh which we are interested in inserting an electrode. The embedding process introduces some new nodes which have close proximity to existing nodes; leading to thin, poor quality elements (Figure 5(b)).
Figure 5.

A mesh is shown in which the contour of an electrode is to be embedded (a). One approach is to insert nodes and triangulate the node set (b). This approach results in poor quality elements in the regions of electrodes. A second approach is a force-based remeshing which produces better quality meshes (c).
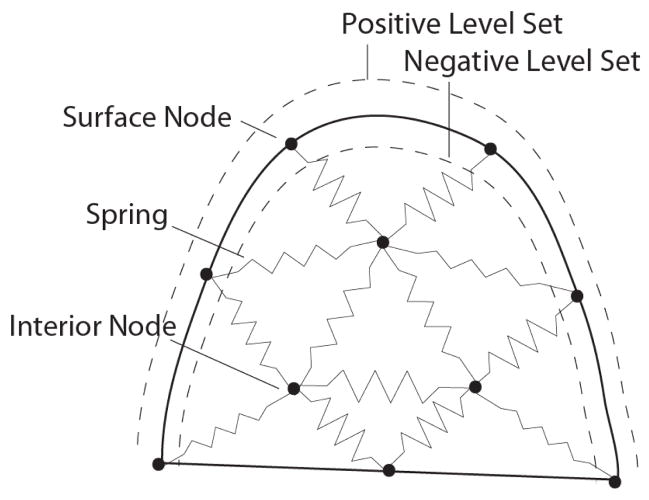
A method for optimizing the node positions simulates spring forces between nodes to redistribute them (Persson and Strang 2004). In this algorithm the mesh is considered a network with springs in place of mesh edges (Figure 6). Nodes which are relatively close together will repel as the springs compress. An illustration of this concept for a simple 2D mesh is shown in Figure 7. At equilibrium nodes are equispaced and result in good quality meshes which is the motivation for adapting the open-source software Distmesh for our application (Persson and Strang 2004). Figure 5(c) shows the results of our implementation for embedding one electrode. The contour of the electrode is well represented by mesh edges and the quality of the mesh is high inside and outside the region of the electrode.
Figure 6.
The spring based meshing approach is illustrated fro a 2D breast shape. Spring forces act on nodes to displace them uniformly throughout the domain. The solid outline represents the surface of the breast. In the described meshing algorithm, a level set function contains information about the distance of nodes to the surface. The level set distance is negative inside the breast and positive outside. This information is used to restrict the nodes to the interior of the mesh.
Figure 7.
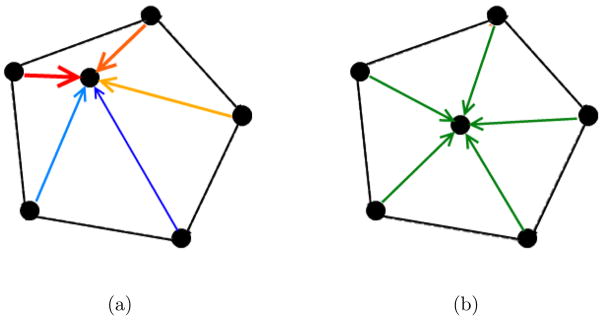
A simple mesh is shown to illustrate nodal displacements in the volume meshing algorithm. The force a node experiences is the sum of the forces due to the connected edges (a). At equilibrium edges are nearly equal in size (b).
Distmesh has the ability to create meshes for simple geometric primitives such as spheres and cubes. We extended the functionality to work with arbitrary shapes, such as a breast and to represent electrode contours. Meshing complex shapes requires the formation of a level set function used to represent the surface, which is described later in this section. Distmesh is implemented in MATLAB and has long run times for well-defined meshes (Solomon et al 2010). Our algorithm, was implemented in C++ to decrease run times for dense meshes (50,000+ nodes).
In our algorithm the nodes of the closed surface mesh become the surface nodes of the volume mesh. To initialize the volume meshing algorithm, nodes are also added in the interior volume of the surface in a manner that provides roughly even spacing between neighbouring nodes. A volume mesh is formed from this node set by Delaunay triangulation. The nodes of this mesh are then displaced to optimize the quality. Edges of the mesh are used to compute forces, and nodes are displaced accordingly. Force computation, node displacement, and retriangulation steps are performed in a loop until the mesh reaches equilibrium.
During each iteration, after node displacements are performed, nodes must be restricted to the interior of the mesh surface. This preserves the boundary shape of the volume mesh. To restrict nodes to the boundary we use the level set function (Hoppe et al 1992).
The level set function accepts a point location and returns its signed scalar Euclidean distance to the mesh surface. This distance is positive outside and negative inside the volume. This allows detection of nodes that may move outside the boundary by the sign of their distance (Figure 6). Nodes which are detected outside the surface of the mesh are returned to the surface before retriangulation.
Nodes are brought back to the surface by moving them along the normal to the surface. The level set function evaluates to 0 on the mesh surface, so the distance a node must travel to reach the surface is calculated by a root-finding technique. We selected the bisection method because of its simplicity.
5.1. Volume Meshing Algorithm
Initialization. Nodes of the breast surface mesh are accepted as an input. Nodes are added randomly in the interior volume of the surface with a density consistent with the nodes of the surface.
-
Generate Mesh Edges and Compute Forces. The current set of nodes is triangulated by the Delaunay criterion to produce the volume mesh. The force applied by an edge onto an attached node (Fe) is calculated by the following conditional statement:
(1) i is the algorithm iteration. e is the edge number. Le is the edge length. L0i is the average edge length of the volume mesh. âe is a unit vector along the direction of the edge. k is a positive force constant.
Equation 1 operates such that if an edge attached to a node is less than the average edge length of the mesh (i.e. compressed spring), a force is generated repelling those nodes (Figure 7).
- The total force a node experiences (Fn) is the vector sum of the forces of all attached edges.
(2) n is the node number. e is the edge number.
-
Displace Nodes. All non-fixed nodes (excludes nodes of the electrode boundaries) have their positions updated by the following displacement equation:
(3) i is the algorithm iteration. pi;n is the current node location. pi+1;n is the displaced node location. Δp is a positive displacement constant.
Detect Exterior Nodes. Nodes which may be displaced outside the volume are detected by evaluation of the level set function. The sign of the evaluation is positive for nodes outside the volume.
Project Exterior Nodes to the Surface. The normal to the surface is calculated for each outside node. Nodes are placed back on the surface by moving along the normal. The zero level of the level set function (specifying the surface) determines how far nodes are moved. The zero level is detected by root-finding with the bisection method.
Evaluate Changes in Mesh Quality. Steps ii-v are iterated until equilibrium is achieved. As the algorithm progresses, edge lengths converge to the average edge length of the volume mesh. When all edges of all nodes are sufficiently equal in length the loop is complete.
Return Mesh Components. The algorithm returns the node list, P, an (N,3) matrix of nodal coordinates; and the tetrahedron list, T, an (M,4) matrix of node indices.
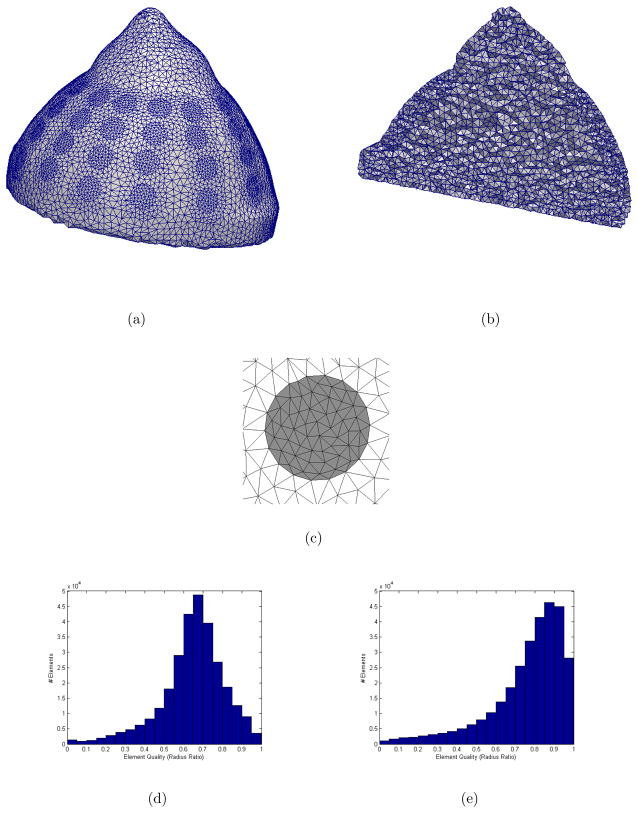
The volume mesh generated from the breast phantom with this algorithm is shown in Figure 8. The shape of the breast phantom is well represented by this mesh. The representation is a significant improvement compared to meshes previously generated by combining geometric shapes.
Figure 8.
Multiple views are shown for the volume mesh of the breast phantom created by the volume meshing algorithm (302840 elements, 51712 nodes). The surface and interior have high qualtiy elements (a–b). A close up view of one electrode shows its quality, well-represented contour and localized refinement (c). Element qualities (radius ratio) of the mesh (image not shown) after its first triangulation are provided in a histogram (d). Element qualities of the mesh after the algorithm has converged are provided in a histogram (e). A quality rating of 1.0 indicates an equilateral tetrahedron. The algorithm improved the average element quality from 0.65 to 0.76.
The algorithm describes a method which generates elements of relatively equal size on the surface. In practice it is desirable to have finer elements in the regions of the electrodes. Therefore, we reduce the repulsion forces of these elements. The result of meshing a single electrode with this adaptation is shown in Figure 8(c).
Elements of the mesh are of good quality, especially in the regions of the electrodes. Average quality of elements is evaluated using the commonly used element quality metric, radius ratio, which is defined as the ratio of insphere to circumsphere (Dompierre et al 2005). The mean radius ratio is 0.76. A comparison of element qualities between the first triangulation and final iteration of the volume meshing algorithm is given by the histograms in Figure 8(d–e).
Mesh density was increased in the regions of electrodes. The ratio of element size in the electrodes to the remainder of the mesh is approximately 1:3.
6. Results
The described methods were tested on a volunteer subject. Informed consent to participate and IRB approval were obtained.
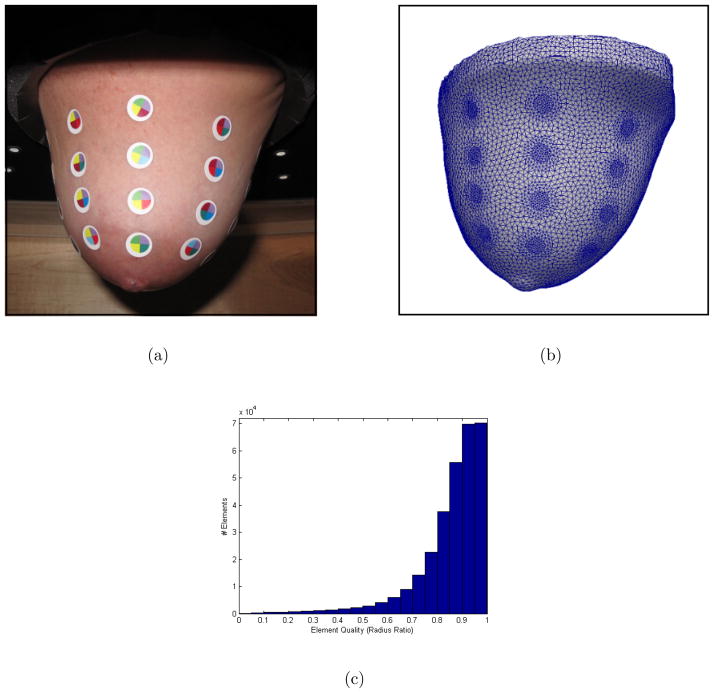
As described in the optical shape capture procedure, the volunteer lay on the exam table and her breast was pendant through the table’s opening. The colour patterns we designed were printed on the backs of circular adhesive markers. A nurse applied these markers to simulate locations of electrodes. A picture shows the breast with the applied markers (Figure 9(a)).
Figure 9.
A photograph shows the breast of a human volunteer pendent with electrode markers applied (a). The mesh generated with the proposed methods is an accurate representation of geometry and electrode positions (b). The element qualities (radius ratio) are shown in a histogram (c). Average element quality is 0.85.
The patient anatomy was optically captured using the VIUscan device. The scanning session took approximately 5 minutes. The 30 electrode markers captured by the scanner were correctly identified by the detection algorithm.
The chain of processing steps we developed were applied to generate a volume mesh with the captured geometry and electrode positions. The resulting mesh is shown in Figure 9(b). The shape of the mesh appears to be an accurate representation of the breast shape. Refinement is shown in the regions of electrodes which improves the accuracy of reconstructions while minimizing the required reconstruction time. This mesh has high quality elements on the surface and in the interior. A histogram of radius ratio shows the distribution of element quality (Figure 9(c)). The average radius ratio of tetrahedral elements is 0.85.
7. Conclusions
In most clinical applications of EIT the lack of shape information and correct localization of electrodes is a significant source of model errors. In the specific application of EIT to breast imaging, the variability of the breast size and shape across patients makes generation of an \average breast” a challenging task and warping a template mesh to fit each patient anatomy is impractical. In our current clinical research program we acquire limited shape information, and therefore can produce meshes that are far from an accurate representation of the breast.
In the present manuscript we propose a method for completely capturing the surface of the breast by optical methods. As our hardware for EIT data collection is in progress, it is our future work to show reconstructed images. The methods and algorithms we developed are shown to work on a plaster breast phantom, used for testing purposes, and on a human volunteer. High quality meshes, that are refined in the regions of the electrodes, were successfully produced from this experimental data. The volume meshes we produce are an accurate representation of the breast anatomy and on the surface have embedded the contours of the electrodes, in the correct locations. This allows accurate solving of the forward problem. We regard this development as significant progress for breast imaging with EIT, as it can minimize one of the largest sources of error, shape. It has the potential to reduce artefacts and provide significant advancements in image quality.
Acknowledgments
This work has been partially supported by National Institutes of Health grant P01-CA80139 awarded by the National Cancer Institute.
References
- Adler A, Guardo R, Berthiaume Y. Impedance imaging of lung ventilation: Do we need to account for chest expansion? IEEE Trans Biomed Eng. 1996;43:414–420. doi: 10.1109/10.486261. [DOI] [PubMed] [Google Scholar]
- Baker LC, Wheeler SK. Managed Care and Technology Diffusion: the case of MRI. Health Affairs. 1998;17:195–207. doi: 10.1377/hlthaff.17.5.195. [DOI] [PubMed] [Google Scholar]
- Barber DC, Brown BH. Errors in reconstruction of resistivity images using a linear reconstruction technique. Clin Phys Physiol Meas. 1988;9:101–104. doi: 10.1088/0143-0815/9/4a/017. [DOI] [PubMed] [Google Scholar]
- Borsic A, McLeod C, Lionheart W, Kerrouche N. Realistic 2D human thorax modelling for EIT. Physiol Meas. 2001;22:77–83. doi: 10.1088/0967-3334/22/1/310. [DOI] [PubMed] [Google Scholar]
- Brown BH, Barber DC. Low-cost functional imaging-Electrical Impedance Tomography. Engineering in Medicine and Biology Society, 1995 and 14th Conference of the Biomedical Engineering Society of India. An International Meeting, Proceedings of the First Regional Conference., IEEE; 1/7-1/8; 1995. pp. 15–18. [Google Scholar]
- Choi MH, Kao TJ, Isaacson D, Saulnier GJ, Newell JC. A reconstruction algorithm for breast cancer imaging with electrical impedance tomography in mammography geometry. IEEE Transactions on Biomedical Engineering. 2007;54:700–710. doi: 10.1109/TBME.2006.890139. [DOI] [PMC free article] [PubMed] [Google Scholar]
- Cutler B, Dorsey J, Mcmillan L. Simplification and improvement of tetrahedral models for simulation. In Proceedings of the 2004 Eurographics/ACM SIGGRAPH symposium on Geometry Processing; 2004. pp. 93–102. [Google Scholar]
- Dompierre J, Vallet M, Labbe P, Guibault F. An analysis of simplex shape measures for anisotropic meshes. Computer Methods in Applied Mechanics and Engineering. 2005;194:4895–4914. [Google Scholar]
- Freitag L, Knupp P. Tetrahedral mesh improvement via optimization of the element condition number. Intl J Numer Meth Engr. 2002;53:1377–1391. [Google Scholar]
- Frerichs I. Electrical impedance tomography (EIT) in applications related to lung and ventilation: a review of experimental and clinical activities. Physiological measurement. 2000;21:R1. doi: 10.1088/0967-3334/21/2/201. [DOI] [PubMed] [Google Scholar]
- Halter RJ, Hartov A, Paulsen KD. A Broadband High-Frequency Electrical Impedance Tomography System for Breast Imaging. Biomedical Engineering, IEEE Transactions on. 2008;55:650–659. doi: 10.1109/TBME.2007.903516. [DOI] [PubMed] [Google Scholar]
- Halter RJ, et al. The correlation of in vivo and ex vivo tissue dielectric properties to validate electromagnetic breast imaging: initial clinical experience. Physiol Meas. 2009;30:121136. doi: 10.1088/0967-3334/30/6/S08. [DOI] [PMC free article] [PubMed] [Google Scholar]
- Holder DS. Electrical impedance tomography of brain function. Brain Topography. 1992;5:8793. doi: 10.1007/BF01129035. [DOI] [PubMed] [Google Scholar]
- Hoppe H, Derose T, Duchamp T, Mcdonald J, Stuetzle W. Surface reconstruction from unorganized points. Computer Graphics. 1992;26:71–78. [Google Scholar]
- Jain H, Isaacson D, Edic PM, Newell JC. Electrical impedance tomography of complex conductivity distributions with noncircular boundary. IEEE Trans Biomed Eng. 1997 doi: 10.1109/10.641332. [DOI] [PubMed] [Google Scholar]
- Jossinet J. Variability of impedivity in normal and pathological breast tissue 1996. Med Biol Eng Comput. 1996;34:346–350. doi: 10.1007/BF02520002. [DOI] [PubMed] [Google Scholar]
- Jossinet J. The impedivity of freshly excised human breast tissue. Physiol Meas. 1998;19:61–75. doi: 10.1088/0967-3334/19/1/006. [DOI] [PubMed] [Google Scholar]
- Kao TJ, Saulnier GJ, Xia H, Tamma C, Newell JC, Isaacson D. A compensated radiolucent electrode array for combined EIT and mammography. Physiol Meas. 2007;28:S291–S299. doi: 10.1088/0967-3334/28/7/S22. [DOI] [PMC free article] [PubMed] [Google Scholar]
- Kolehmainen V, Vauhkonen M, Karjalainen PA, Kaipio JP. Assessment of errors in static electrical impedance tomography with adjacent and trigonometric current patterns. Physiological Meas. 1997;18:289–303. doi: 10.1088/0967-3334/18/4/003. [DOI] [PubMed] [Google Scholar]
- Lionheart WRB. Boundary Shape and Electrical Impedance Tomography. Inverse Problems. 1998;14:139–147. [Google Scholar]
- Lionheart WRB, Polydorides N, Borsic A. D S Holder Techniques in Electrical Impedance Tomography. 2004. Image reconstruction in electrical impedance tomography. [Google Scholar]
- Persson P-O, Strang G. A simple mesh generator in Matlab. SIAM Rev. 2004:46. http://persson.berkeley.edu/distmesh/
- Poplack SP, Tosteson TD, Wells WA, Pogue BW, Meaney PM, Hartov A, Kogel CA, Soho SK, Gibson JJ, Paulsen KD. Electromagnetic Breast Imaging: Results of a Pilot Study in Women with Abnormal Mammograms. Radiology. 2007;243:350–359. doi: 10.1148/radiol.2432060286. [DOI] [PubMed] [Google Scholar]
- Solomon F, Adler A, Chan A. Using Distmesh as a Mesh Generating Tool for EIT. Journal of Phys Conf Series. 2010:224. [Google Scholar]
- Somersalo E, Cheney M, Isaacson D. Existence and Uniqueness for Electrode Models for Electric Current Computed Tomography. SIAM Journal on Applied Mathematics. 1992;52:1023–1040. [Google Scholar]
- Tizzard A, Borsic A, Halter R, Bayford R. Generation and performance of patient-specific forward models for breast imaging with EIT. Physiol Meas. 2010:224. [Google Scholar]


