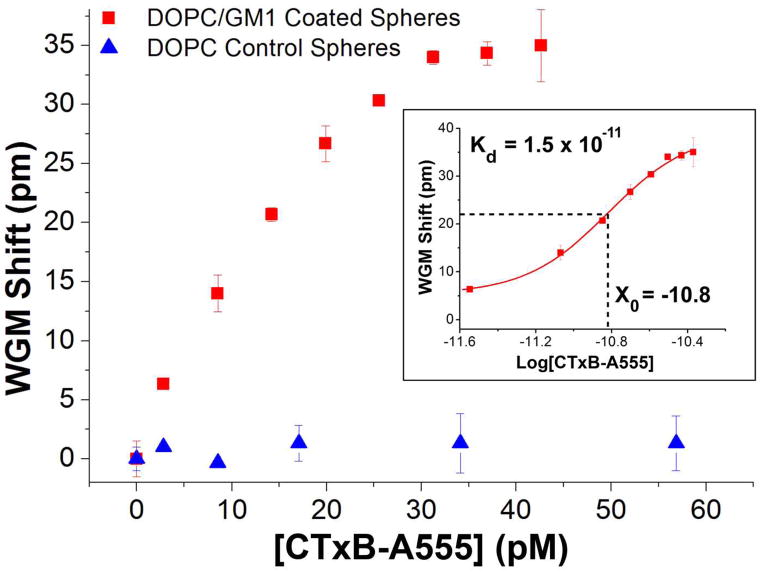
Figure 8.
CTxB-A555 binding curves measured by tracking shifts in the WGM resonance with CTxB-A555 concentration. For resonators coated with DOPC bilayers incorporating GM1 (red squares) the binding curve shows a saturation response with a detection limit of 3.3 pM. This is compared with control studies using spheres coated with pure DOPC bilayers (blue triangles), which show negligible shifts with CTxB-A555 addition. The inset shows a log plot of the data from which a Kd of 1.5 × 10⁻¹¹ is calculated, which is consistent with literature values.

