

Abstract
The aim of this study was to determine the correlation of ultrasonographic estimates of testicular volume with true testicular volume and to compare the accuracy and precision of the three most commonly utilized formulas. A total of 15 patients underwent high-resolution ultrasonography (US) analysis for testicular volume before orchiectomy. Testicular volume was calculated using three common formulas: (1) length (L) × width (W) × height (H) × 0.52; (2) the empirical formula of Lambert: L × W × H × 0.71; and (3) L × W2 × 0.52. The actual volume of each removed testis was estimated directly by a water displacement method. Thus, four volume measurements were obtained for each of the 30 testes. The obtained data were analyzed by paired t-test and linear regression analysis. All three US formula measurements significantly underestimated the true testicular volume. The largest mean biases were observed with US formula 1, which underestimated the true volume by 3.3 mL (31%). US formula 2 had a smaller mean difference from the true volume, with an underestimation of only 0.6 mL (6%). Regression analysis showed that formulas 1 and 2 had better R2 values than formula 3. However, all three US formulas displayed a strong linear relationship with the true volume (R2= 0.872−0.977; P < 0.001). Among the commonly used US formulas, the empirical formula of Lambert (L × W × H × 0.71) provided better accuracy than the other two formulas evaluated, and better precision than formula 3. Therefore, the formula of Lambert is the optimal choice in clinical practice.
Keywords: testicular volume, testis, ultrasonography
Introduction
As the seminiferous tubules comprise approximately 90% of the testicular mass, testicular volume is largely a reflection of spermatogenesis 1, 2. Clinical studies in infertile men have also shown that testicular volume strongly correlates with semen profile 3. Therefore, accurate measurements of testicular volume are critical in the evaluation of testicular growth and function in adolescents or adults. Currently, several measurement techniques or tools are used for the clinical assessment of testicular volume, including the orchidometer, rulers, calipers, and ultrasonography (US).
Although the most accurate method for measuring testicular volume is still debated, US is generally recognized as the most reliable means of measuring in situ testicular volume 4, 5. US is usually used as a standard for the comparison of different measurement techniques. However, some authors 6 have found large variability in US estimates based on the examiner and the formula used. Recently, an experimental study using a canine model determined that the most accurate formula for US estimates was length (L) × width (W) × height (H) × 0.71 7. In this study, we sought to correlate various US estimates of testicular volume with true testicular volume in adult humans and to compare the accuracy and precision of the three most commonly quoted formulas in the literature.
Materials and methods
Patients and ultrasonographic measurement of testes
This study included a consecutive series of 15 patients ranging in age from 52 to 82 years who were advised to undergo bilateral orchiectomy for advanced prostate cancer. All patients underwent high-resolution US for testicular volume before orchiectomy. The testes were scanned using an US imaging machine (Acuson, 128XP machine, Mountain View, CA, USA) and L7 probe with a frequency of 7 MHz by the same physician (MLH). To avoid distortion of testicular shape, the scanning was performed carefully by using light pressure, with the patients lying in the supine position. Gray-scale images of the testes were obtained in transverse and longitudinal planes. When the largest length and height in the longitudinal plane and adequate width in the transverse plane were obtained, measurements were taken using electronic calipers (Figure 1) and recorded for volume calculation and statistical analysis.
Figure 1.

Testicular volume assessed by ultrasonography. (A): The largest length (L) and height (H) in the longitudinal plane were measured using electronic calipers. (B): Adequate width (W) in the transverse plane was also obtained using calipers.
Calculation formulas and true volume measurement
Testicular volume was calculated using three common formulas: (1) the formula for an ellipsoid (formula 1): L × W × H × 0.52, (2) the empirical formula of Lambert (formula 2) 8: L × W × H × 0.71, and (3) the formula for a prolate spheroid (formula 3): L × W2 × 0.52.
After we estimated the preoperative testicular volume by US, bilateral orchiectomy was performed immediately for therapeutic purposes (surgical castration for advanced prostate adenocarcinoma). The removed testis was well trimmed to avoid inclusion of unnecessary soft tissues or epididymis and placed into a water-containing measuring cylinder. The actual volume of each removed testis was then estimated directly by water displacement 9. Therefore, four volume measurements were obtained for each of the 30 testes: three values from US calculations and one true volume value.
Statistical analysis
Paired t-tests were used to determine whether the US volumes differed significantly from the true volumes. The relationship between each formula measurement and the true testicular volume was evaluated using linear regression analysis with the US measurement as the dependent variable and the true volume as the independent variable. The estimated slope parameter was tested against the theoretical value of 1, and the intercept was tested against a value of 0 using a one-sample Student's t-test. A two-tailed P value < 0.05 was considered statistically significant. The R values obtained for each of the three formula measurements were compared for statistically significant differences using Fisher's z-transformation. All statistical analyses were performed using a computer software package (SPSS 11.5; SPSS Inc., Chicago, IL, USA).
Results
The actual testicular volume of 30 testes from 15 men varied between 3.5 and 16.5 mL, with a mean volume of 10.6 mL. All three US formula measurements significantly underestimated the true testicular volume. As shown in Table 1, the largest mean biases were observed with US formula 1 (L × W × H × 0.52), which underestimated the true volume by 3.3 mL (31%). US formula 2 had the smallest mean difference from the true volume, with an underestimation of only 0.6 mL (6%).
Table 1. Comparison of testicular measurement values using US measurements with true testicular volume.
| Measurement methoda | Difference from true volume (mL)b | P-valuec | Percentage differenceb | Slope (SE) (β) | P-valued | Intercept | R2 | Fisher's z-transformation value | P-valuee |
|---|---|---|---|---|---|---|---|---|---|
| Formula 1 | −3.3 ± 1.1 | < 0.001 | −31.4 ± 4.8 | 0.65 (0.24) | 0.160 | −0.389 | 0.976 | 2.6467 | |
| Formula 2 | −0.6 ± 0.6 | < 0.001 | −6.3 ± 6.5 | 0.92 (0.33) | 0.798 | −0.501 | 0.977 | 2.6467 | NS |
| Formula 3 | −1.8 ± 1.3 | < 0.001 | −17.2 ± 10.0 | 0.78 (0.62) | 0.723 | 0.124 | 0.872 | 1.6584 | < 0.05 |
Abbreviation: NS, not significant.
Formula 1 = length (L) × width (W) × height (H) × 0.52, Formula 2 = L × W × H × 0.71, Formula 3 = L × W2 × 0.52.
Data are the mean difference ± SD.
Based on results of paired-samples' t-test.
Based on results of one-sample t-test for determining whether the slope was significantly different from 1.
Based on results of the statistical test for significance of 'Fisher's z-transformation' (converts Pearson's R's to the normally distributed variable z).
Plots illustrating the relationship between the US formula measurements and the true testicular volume are shown in Figure 2. Regression analysis indicated that formulas 1 and 2 had better R2 values than formula 3. However, all three US formulas showed a strong linear relationship with the true volume (R2 = 0.872–0.977; P < 0.001). None of the slopes for the three formulas were significantly smaller than 1, although formula 1 had the lowest slope (0.65), indicating that the differences relative to the true testicular volume were consistent over the range of volumes measured.
Figure 2.
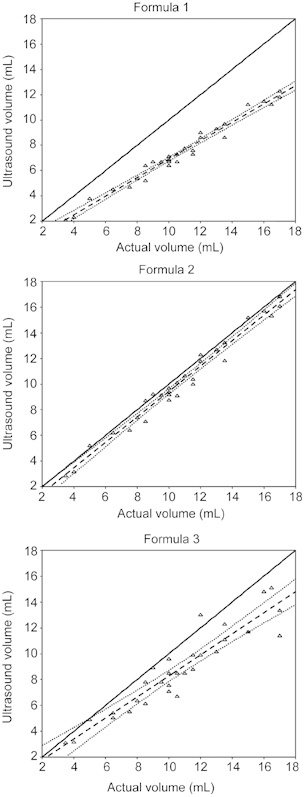
The linear relationship between actual testicular volumes and volumes determined by different formulae. The straight, dashed lines represent the theoretical linear relationship obtained from regression parameters. The curved, dashed lines represent the 95% confidence intervals. Formula 1 = length (L) × width (W) × height (H) × 0.52, Formula 2 = L × W × H × 0.71, and Formula 3 = L × W2 × 0.52. Although all three formulae tended to underestimate the testicular volume, formula 2 resulted in values that differed the least from the actual volume.
Discussion
The accurate and consistent determination of testicular size is important for assessing pubertal development and male reproductive function. Currently, testicular volume can be assessed clinically by a variety of orchidometers, calipers and rulers or by US measurements of testis length, width and height, followed by multiplication by a constant. Although the orchidometer method is convenient for clinical use, experimental and clinical observations have shown that this method may not always be precise and consistent 10. In fact, this method tends to overestimate the true volume, which might be caused by the inclusion of the epididymis or subcutaneous tissues 7, 10, 11.
The theoretical advantage of US over orchidometers or testis models for testicular volume assessment lies in its ability to enable one to distinguish the testis from the adjacent soft tissues. US was proposed to be reliable for measuring testicular size in many studies, which postulated that US would provide more accurate volumes than volumes obtained with an orchidometer 11, 12, 13. Thus, many recent studies 4, 5 have used US measurements of testicular size as the standard, to which other clinical measurements were compared. Therefore, it is important to know the exact accuracy of US for testicular volume assessment. However, to our knowledge, only a few of these investigations have directly addressed the issue of the accuracy and precision of US 7, 12, 14.
On examination of 14 testes from patients at autopsy, Behre et al. 13 reported a strong correlation (R = 0.992) between actual testicular volume (by water displacement) and the volume determined by US. In an attempt to evaluate the accuracy and precision of ultrasonographic measurements of testicular volume, Paltiel et al. 7 compared the different ultrasonographic measurements (formulas) of testicular volume with the actual testicular volume in a canine model, revealing that US volume measurements showed low variability and correlated well with true testicular volume. In this study, a strong correlation between testicular volumes assessed by US and actual testicular volumes was found (R2= 0.87–0.98); regression analysis detected an intercept that was not statistically different from 0 and a slope that was not statistically different from 1, indicating that US measurements could be reliable and accurate for determining testicular size.
Various formulas have been used in the US assessment of testicular volume: the formula for an ellipsoid (L × W × H × 0.52), the formula for a prolate spheroid (L × W2 × 0.52), and the empirical formula of Lambert 8 (L × W × H × 0.71). However, few studies have made direct comparisons of their accuracy and precision. In a canine model, Paltiel et al. 7 found that the formula in which testicular volume is calculated by L × W × H × 0.71 has the smallest mean bias relative to actual volume over the entire volume range. Recently, Sakamoto et al. 14 also found that the same formula (L × W × H × 0.71) was the most accurate for calculating the testicular volume, with an average 0.8-cm3 overestimation (7.42%) of the true volume in a human model. In our study using human testes, all three commonly used formulas tended to underestimate the testicular volume, but the empirical formula of Lambert 8 (L × W × H × 0.71) was the most accurate, with only a 6% underestimation. From the regression model, all three US formulas showed strong linear relationships with true volume, but formula 3 had a statistically significantly lower R2 value than formulas 1 and 2. As formulas 1 and 2 are proportional, there were no statistically significant differences between their R2 values. Taken together, these results suggest that a three-dimensional measurement (L × W × H) optimizes the precision of US measurements of testicular volume.
In conclusion, US is a relatively accurate and precise method for determining testicular volume. Among the commonly used US formulas, the empirical formula of Lambert 8 (L × W × H × 0.71) provided not only the most accurate value of the three formulas assessed, but also better precision than formula 3. Therefore, for more accurate, precise testicular volume determination in clinical practice, the empirical formula of Lambert should be the first choice.
Acknowledgments
We are grateful to Ms Shu-Fang Huang, a statistical specialist at our institute, for her valuable assistance in statistical analysis and review of the statistical section.
References
- Takihara H, Cosentino MJ, Sakatoku J, Cockett AT. Significance of testicular size measurement in andrology: II. Correlation of testicular size with testicular function. J Urol. 1987;137:416–9. doi: 10.1016/s0022-5347(17)44053-5. [DOI] [PubMed] [Google Scholar]
- Lenz S, Giwercman A, Elsborg A, Cohr KH, Jelnes JE, et al. Ultrasonic testicular texture and size in 444 men from the general population: correlation to semen quality. Eur Urol. 1993;24:231–8. doi: 10.1159/000474300. [DOI] [PubMed] [Google Scholar]
- Arai T, Kitahara S, Horiuchi S, Sumi S, Yoshida K. Relationship of testicular volume to semen profiles and serum hormone concentrations in infertile Japanese males. Int J Fertil Women's Med. 1998;43:40–7. [PubMed] [Google Scholar]
- Sakamoto H, Ogawa Y, Yoshida H. Relationship between testicular volume and testicular function: comparison of the Prader orchidometric and ultrasonographic measurements in patients with infertility. Asian J Androl. 2008;10:319–24. doi: 10.1111/j.1745-7262.2008.00340.x. [DOI] [PubMed] [Google Scholar]
- Diamond DA, Paltiel HJ, DiCanzio J, Zurakowski D, Bauer SB. Comparative assessment of pediatric testicular volume: orchidometer versus ultrasound. J Urol. 2000;164:1111–4. doi: 10.1097/00005392-200009020-00048. [DOI] [PubMed] [Google Scholar]
- Kass EJ, Reitelman C. Adolescent varicocele. Urol Clin North Am. 1995;22:151–9. [PubMed] [Google Scholar]
- Paltiel HJ, Diamond DA, DiCanzio J, Zurakowski D, Borer JG, et al. Testicular volume: comparison of orchidometer and US measurements in dogs. Radiology. 2002;222:114–9. doi: 10.1148/radiol.2221001385. [DOI] [PubMed] [Google Scholar]
- Lambert B. The frequency of mumps and of mumps orchitis. Acta Genet Stat Med. 1951;2 Suppl. 1:1–166. [PubMed] [Google Scholar]
- Rivkees SA, Hall DA, Boepple PA, Crawford JD. Accuracy and reproducibility of clinical measures of testicular volume. J Pediatr. 1987;110:914–7. doi: 10.1016/s0022-3476(87)80412-2. [DOI] [PubMed] [Google Scholar]
- Tatsunami S, Matsumiya K, Tsujimura A, Itoh N, Sasao T, et al. Inter/intra investigator variation in orchidometric measurements of testicular volume by ten investigators from five institutions. Asian J Androl. 2006;8:373–8. doi: 10.1111/j.1745-7262.2006.00143.x. [DOI] [PubMed] [Google Scholar]
- Fuse H, Takahara M, Ishii H, Sumiya H, Shimazaki J. Measurement of testicular by ultrasonograpy. Int J Androl. 1990;13:267–72. doi: 10.1111/j.1365-2605.1990.tb01031.x. [DOI] [PubMed] [Google Scholar]
- Costabile RA, Skoog S, Radowich M. Testicular volume assessment in the adolescent with a varicocele. J Urol. 1992;147:1348–50. doi: 10.1016/s0022-5347(17)37561-4. [DOI] [PubMed] [Google Scholar]
- Behre HM, Nashan D, Nieschlag E. Objective measurement of testicular volume by ultrasonography: evaluation of the technique and comparison with orchidometer estimates. Int J Androl. 1989;12:395–403. doi: 10.1111/j.1365-2605.1989.tb01328.x. [DOI] [PubMed] [Google Scholar]
- Sakamoto H, Saito K, Ochta M, Inoue K, Ogawa Y, et al. Testicular volume measurement: comparison of ultrasonography, orchidometry, and water displacement. Urology. 2007;69:152–7. doi: 10.1016/j.urology.2006.09.012. [DOI] [PubMed] [Google Scholar]