Abstract
In this review, we summarize our recently developed mathematical models that predict the effects of intermittent androgen suppression therapy on prostate cancer (PCa). Although hormone therapy for PCa shows remarkable results at the beginning of treatment, cancer cells frequently acquire the ability to grow without androgens during long-term therapy, resulting in an eventual relapse. To circumvent hormone resistance, intermittent androgen suppression was investigated as an alternative treatment option. However, at the present time, it is not possible to select an optimal schedule of on- and off-treatment cycles for any given patient. In addition, clinical trials have revealed that intermittent androgen suppression is effective for some patients but not for others. To resolve these two problems, we have developed mathematical models for PCa under intermittent androgen suppression. The mathematical models not only explain the mechanisms of intermittent androgen suppression but also provide an optimal treatment schedule for the on- and off-treatment periods.
Keywords: diagnosis, intermittent androgen suppression, mathematical models, personalized treatment schedule, prognosis, prostate cancer
Introduction
Prostate cancer (PCa) is one of the major causes of cancer deaths in Western countries, particularly among elderly people. In Eastern countries, including Japan, the death rate from PCa is rapidly increasing, probably owing to such factors as aging and changing dietary habits. Therefore, it is an urgent issue to develop better preventative measures and therapies for PCa.
The prostate was discovered to be closely related to the testes through observations of the effects of castration of animals and humans. In fact, the genesis, differentiation, and normal functions of the prostate are regulated by male hormones (androgens) that are synthesized and secreted mainly from the testes and partly from the adrenal glands. Because PCa cells at an early stage also have a dependence on androgens, androgen ablation results in the degeneration of prostatic tumours. This phenomenon was first identified in animal studies by Huggins and Hodges1 in the 1940s and subsequently confirmed in the human prostate. Since then, the major treatment for advanced PCa has been endocrine therapy.2 Furthermore, the condition of PCa can be sensitively monitored by a serum biomarker called prostate-specific antigen (PSA).
Hormone therapy with androgen deprivation usually induces apoptosis of the androgen-dependent (AD) cancer cells and the temporal regression of a prostate tumour. However, if androgen deprivation is overly prolonged, the AD cancer cells change to androgen-independent (AI) cancer cells, which are resistant to hormonal therapy. This change eventually leads to recurrence (or relapse). The relapse of PCa, which is common for many patients, has been a major issue associated with conventional continuous androgen suppression (CAS). Formerly, CAS was irreversible because castration was performed by the surgical removal of the testes. Currently, medical castration is the treatment of choice, and it is possible to suspend androgen suppression by simply stopping the administration of the drugs. It is this form of hormone therapy that we used to formulate our mathematical models.
Androgen deprivation is a fundamental therapy for inhibiting the increase of AD cells in a tumour. Building on this concept, intermittent androgen suppression (IAS) was proposed affording the possibility of limiting the duration of androgen-poor conditions and avoiding emergence of AI cells.3, 4, 5 When the PSA level increases and reaches an upper threshold value  , androgen is withdrawn by the administration of agents used for medical castration. When the PSA level decreases and reaches a lower threshold value
  , androgen suppression is suspended. The upper and lower threshold values have been determined by medical doctors based on a guideline. IAS aims to maintain low PSA levels by repeating cycles of on-treatment and off-treatment periods, as shown in Figure 1.
Figure 1.
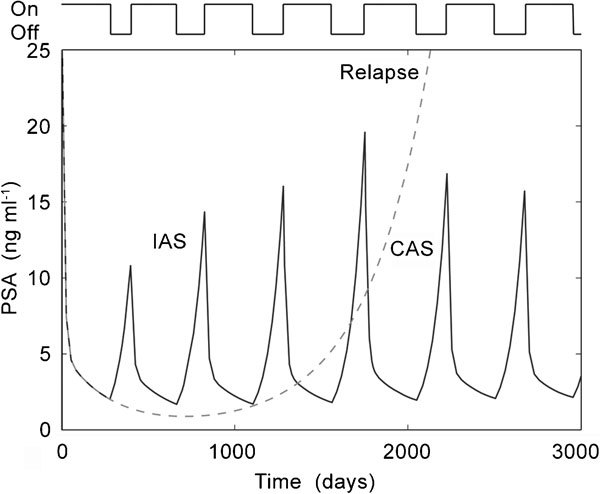
Schematic illustration showing variations in the serum PSA levels under CAS (the dashed line) and IAS (the solid line). CAS, continuous androgen suppression; IAS, intermittent androgen suppression; PSA, prostate-specific antigen.
Bruchovsky et al.4, 5 first demonstrated the efficiency of IAS in animal experiments. After this pioneering work, the clinical efficacy of IAS for human patients has been studied by many research groups.6 The advantages of IAS over CAS include not only possible therapeutic effects, but also the reduction of side effects during off-treatment periods. However, it is still controversial how to optimally schedule the on- and off-treatment periods. In addition, clinical trials have revealed that IAS is effective for some patients but not for others. Because the characteristics of the progression of prostate cancer depend on individual patients, it would be desirable to personally tailor IAS therapy based on PSA levels. For this purpose, we have investigated the conditions for relapse under IAS by modelling prostate tumour growth. Once a mathematical model is defined, an optimal schedule for IAS therapy can be theoretically obtained.
Mathematical models for IAS
The initial mathematical model of PCa under IAS
Jackson7, 8 presented a mathematical model of prostate tumour growth under CAS. The model reproduces three typical phases in the time course of the PSA level under CAS: the exponential growth before castration, the exponential decay immediately after the castration and the eventual recurrence. Assuming that a prostate tumour is composed of cells with AD and AI phenotypes, as in the previous study, we constructed the initial mathematical model of prostate tumour growth under IAS9 as follows (see Figure 2 for the schematic diagram):
Figure 2.
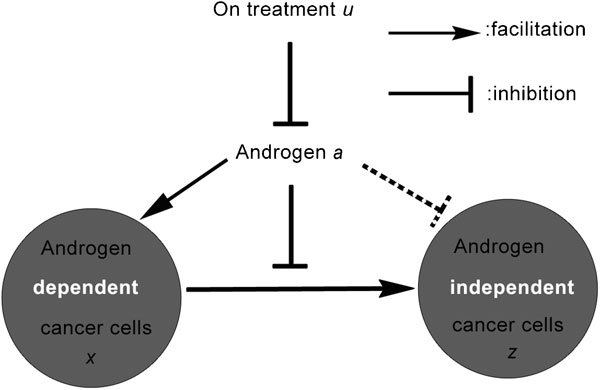
Schematic diagram for the initial model of prostate cancer under intermittent androgen suppression. In this diagram, arrows show facilitation or transition and bars show inhibition. The dashed bar means that this effect depends on Cases (1), (2) and (3), which are discussed in the main text.
where x, z, a and a0 represent the population of AD cells, the population of AI cells, the androgen concentration and the normal androgen level, respectively. The PSA level v (ng ml−1) is defined as  , where
  for simplicity. The on- and off-treatment periods of hormone therapy are represented by
  and
and  , respectively. The treatment is suspended (
 is changed from 1 to 0) when
  and
and  , and it is restarted (
 is changed from 0 to 1) when
  and
and  . These conditions for switching between on- and off-treatments are assumed to be checked every 28 days, according to the usual IAS therapy. The growth of AD cells and that of AI cells are governed by the respective net growth rates
  and
and  and the mutation rate
  from the AD to AI phenotype; these are represented as follows:
where  ,
,  ,
,  and
and  are the parameters. In particular,
  shows the maximum mutation rate. The rates depend on the androgen level
  . Because AD cells proliferate in a normal androgen environment, while androgen deprivation induces apoptosis of AD cells, the growth rate
  of AD cells is positive under normal androgen conditions and negative under an androgen-poor condition. When androgen deprivation is prolonged, the progression to an AI state is observed. Therefore, the growth rate
  is positive in an androgen-poor condition. However, the growth rate of AI cells in a normal androgen condition is not fully known. Therefore, we assume that
  is a linear function of the androgen level
  by introducing the slope parameter
  . The change from AD to AI cells seems to occur when androgens are withdrawn. That is to say, the mutation rate
  increases as the androgen level decreases.
First let us consider the following three typical cases for the slope parameter b.
Case (1): AI cells grow at the constant rate independent of the androgen level (
 ).
).Case (2): AI cells do not grow when the androgen level is normal (
 ).
).Case (3): AI cells decrease when the androgen level is normal (
 ).
).
Figure 3 shows the time courses of the PSA levels generated by the initial model. In Case (1), IAS is not able to delay the time to relapse because the AI cells grow at any androgen level. In Case (2), IAS can prolong the time to relapse by setting the lower threshold at an appropriately small value. However, if it is set too small, the PSA level will not reach the threshold, and suspension of treatment will not occur. In Case (3), IAS successfully results in repetitive cycles of on- and off-treatment periods with PSA variations in a feasible range. In this case, the relapse that occurs under CAS can be prevented by IAS.
Figure 3.
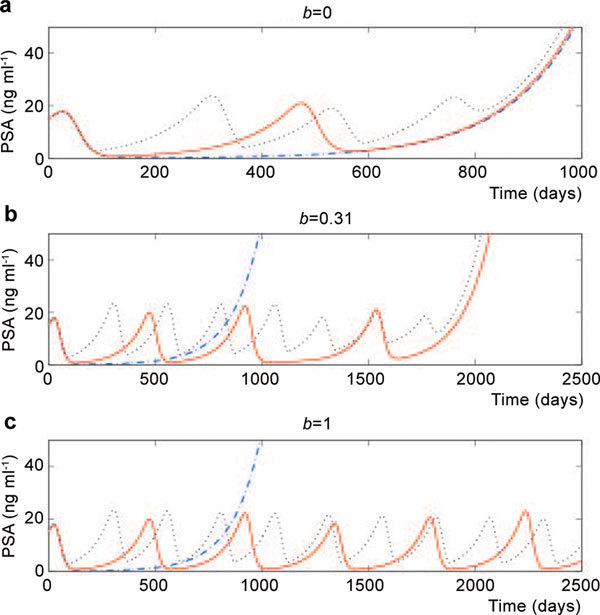
Time courses of the PSA level produced by the initial model of prostate cancer under intermittent androgen suppression. The upper threshold value is set at r1=15 for all time series. The lower threshold r0 is set at 0 (the blue dot-dashed line, corresponding to CAS), 1 (the red solid line) and 10 (the black dotted line) (ng ml−1) in each panel. (a) Case (1) with b=0; (b) Case (2) with b=0.31; (c) Case (3) with b=1. CAS, continuous androgen suppression; PSA, prostate-specific antigen.
Mathematically, relapse and relapse prevention correspond to a divergent and a non-divergent solution, respectively. When the cycles of on- and off-treatment periods are repeated exactly, the corresponding non-divergent solution is a periodic solution called a limit cycle. We have developed a numerical method to locate a bifurcation point of the limit cycle in hybrid dynamical systems, as in the initial model, and specified the boundary between the parameter regions for the two qualitatively different solutions.10
We have also clarified that the mechanism of the transition is related to a grazing bifurcation, which is unique to hybrid systems.11 As shown in Figure 4 of Ref. 10, it is important to appropriately set the upper and lower threshold PSA values to avoid relapse, although the effect of the slope parameter  plays a decisive role in this initial model as well.
Figure 4.
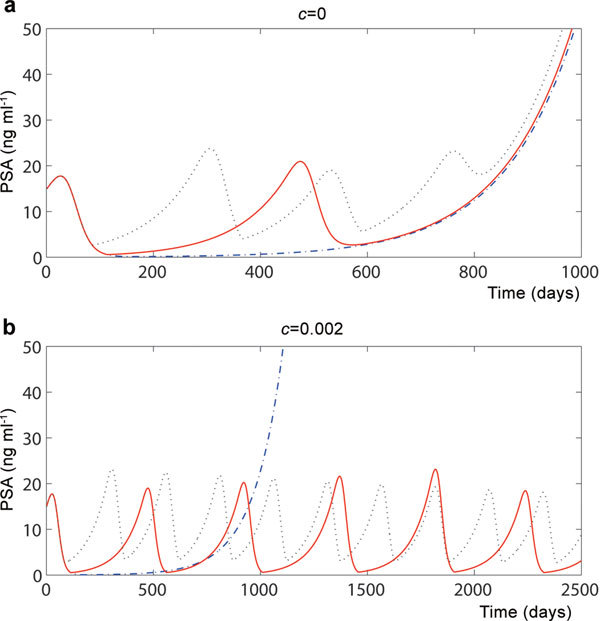
Time courses of the PSA levels produced by the competition model. The upper threshold value is set at r1=15 for all the time series. The lower threshold value r0 is set at 0 (the blue dot-dashed line), 1 (the red solid line) and 10 (the black dotted line) (ng ml−1) in each panel. (a) C=0 (without competition); (b) C=0.002. We set b=0. PSA, prostate-specific antigen.
The partial differential equations model
The initial model of IAS, as shown in Equations (1)–(6), can be extended to a partial differential equations model that takes into consideration the spatial distribution of tumour cells in prostate cancer,12 where a tumour is modelled as a radially symmetric sphere densely packed with AD and AI cells. The model equations can be written as follows:
Here, the tumour volume is represented as an incompressive fluid with velocity V, and Dx and Dz are the random motility coefficients of the AD and AI cells, respectively. The other notations are the same as in the initial model. We found that the partial differential equations model reproduces similar results in Cases (1), (2) and (3) of the initial model.12 The partial differential equations model (7)–(9) can be further extended to other models, including the competition effect explained in the next section.13, 14
The model including competition between AD cells and AI cells
It is controversial whether or not the growth rate of AI cells can be negative in the presence of normal androgen levels, as in Case (3); however, there are experimental results with LNCaP cell sublines that support this assumption.15 Furthermore, our analysis of actual PSA data from patients undergoing IAS treatment, explained in the section on ‘The piecewise linear model', has shown that the net growth rate of mutated AI cells during the off-treatment periods is negative in the majority of patients.16 However, there is the possibility that AI cells decrease in the presence of normal androgen levels owing to competition between AD and AI cells, even if the net growth rate of AI cells is positive. This is because AD cells have a tendency to proliferate more in an androgen-rich environment.
The extended model with the competition effect is described as follows17:
where C represents the strength of the competition. This competition term can induce a decrease of AI cells during off-treatment periods.
The results of simulations for this competition model are presented in Figure 4. When the competition term is effective, it can stop the divergence of the solution and hence relapse. Generally speaking, the bifurcation diagram shows a qualitative change for the solution structure for the model depending on certain parameters. The bifurcation diagrams for this model are shown in Figure 5a and 5b. The model suggests that when C is larger, intermittent androgen suppression tends to be more effective.
Figure 5.
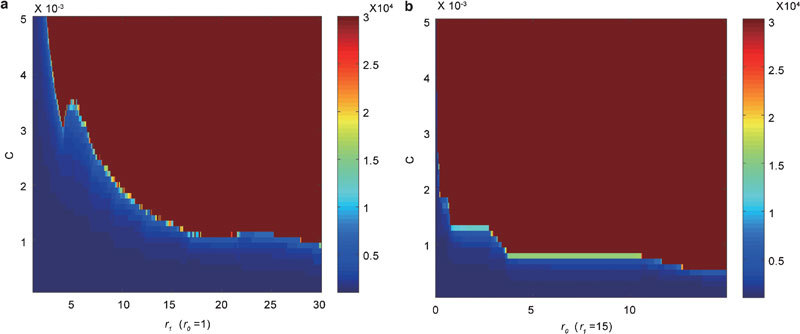
Bifurcation diagrams showing the boundary between the regions of relapse and relapse prevention in the competition model with b=0. The model was run until either the cancer cells exceed the bounded region (defined by  and
and  ) or the length of simulations reached 30 000 days. During the simulation, we checked every 28 days for whether we needed to switch between on- and off-treatment periods. The colour shows how many days the cancer cells are within the bounded region. (a) The lower threshold value is set at r0=1, and the upper threshold value r1 is varied between 1 and 30. (b) The upper threshold value is set at r1=15, and the lower threshold value r0 is varied between 0 and 15.
The stochastic model
The three deterministic models introduced above are useful for reproducing the typical tumour growth under IAS and for understanding the parameter conditions for relapse prevention. However, we need to check the robustness of the model against intrinsic noise in biological cells and the observational noise associated with monitoring the PSA level. Thus, we presented a stochastic model to examine the effect of noise, as follows18:
where  and
and  represent the dynamical noise. We also assume that the PSA level is described as
  , where
  is the observational noise. The stochastic noise
  is white Gaussian noise with
  and
and  , where
  and
and  represent the noise intensity and time average
  .18 The schedule of IAS is set according to the clinical trials19, 20 to reproduce a realistic situation. The treatment is suspended when a decreasing PSA level falls below the lower threshold r0=4 ng ml−1 at 36 weeks after each start of an on-treatment period; the treatment is restarted when an increasing PSA level reaches the upper threshold r1=10 ng ml−1.
Figure 6 shows the time courses of the PSA level over 20 simulations. We set the noise intensities at  and
and  . The number of cycles before relapse can be varied only with the stochastic noise. Before relapse, the trajectory of the model nearly grazes the switching section that corresponds to the lower threshold in the state space. If the trajectory reaches this section, it goes to the next cycle. Otherwise, it diverges to infinity along the z axis, implying relapse. Therefore, the solution is very sensitive to the small noise when it is close to the section, which leads to the variation of the number of cycles.
Figure 6.
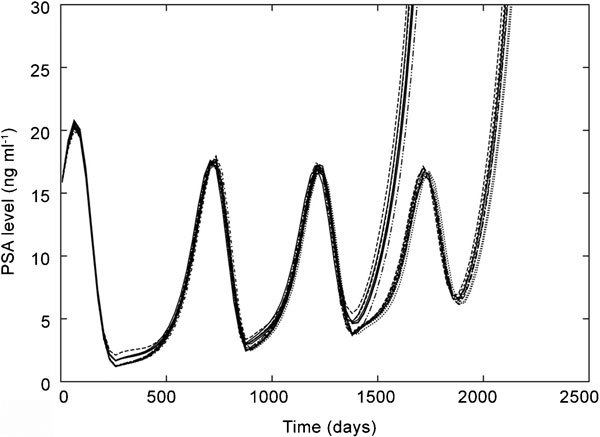
Time courses of the PSA level over 20 simulations, generated by the stochastic model. Stochastic noise is responsible for the variation in the time to a relapse. PSA, prostate-specific antigen.
We analysed the transient behaviour of PSA variations. We focused on the length of off-treatment periods and the PSA-nadir level. The PSA-nadir level is the local minimum of the PSA level, which is typically observed at the time of restarting an off-treatment period. The length of the off-treatment period is shortened, and the PSA-nadir level is increased gradually as the cycle proceeds (Figure 6). This gradual increase of the PSA-nadir level implies the progression to an AI state.
Numerical experiments suggest that the length of an off-treatment period negatively correlates with the PSA-nadir level immediately before each start of the off-treatment period (Figure 7). This property has been reported also in statistical analyses of PSA variations observed in clinical trials.19, 20 Hence, both the diversity and statistical nature of the true PSA variations can be explained well by the stochastic model.
Figure 7.
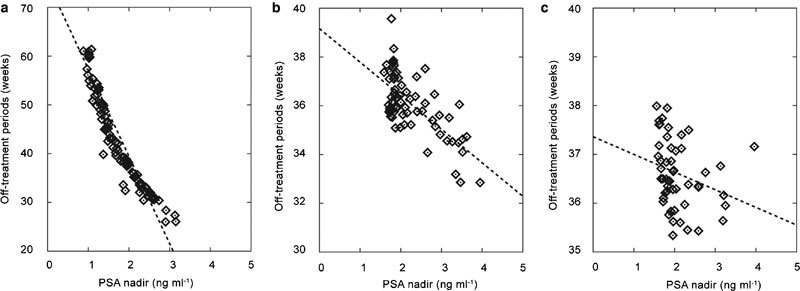
The correlation between the PSA-nadir level and the length of the following off-treatment period. (a) The first cycle; (b) the second cycle; (c) the third cycle. PSA, prostate-specific antigen.
The piecewise linear model
The characteristics of prostate cancer can be different for different patients. Therefore, we have developed methodology to construct a personalized mathematical model of prostate cancer for each individual patient from monitoring of the PSA time courses. The methodology can be used for diagnostic and prognostic purposes and lead to outcome predictions for the patient.16 An accurate mathematical model for fitting actual data and making predictions may require a large number of parameters to reproduce the important characteristics of the true PSA time series. However, the number of estimated parameters should be minimal to avoid overfitting and too much complexity.
Thus, we have further modified the former models for the following reasons. Because the equation for androgen dynamics in the former models is not very influential for the essential shape of the PSA time courses, it was able to be eliminated from the models without much influence (see also Ref. 16). Moreover, the previous models are not able to reproduce the biphasic decrease of PSA levels during the on-treatment periods, which is a typical property in most clinical data. To make the biphasic decrease possible, a new state equation was added by assuming another type of cells.
For a prostate tumour consisting of three types of cell populations, we constructed a piecewise linear model as follows (see Figure 8 for the schematic diagram).16, 18
Figure 8.
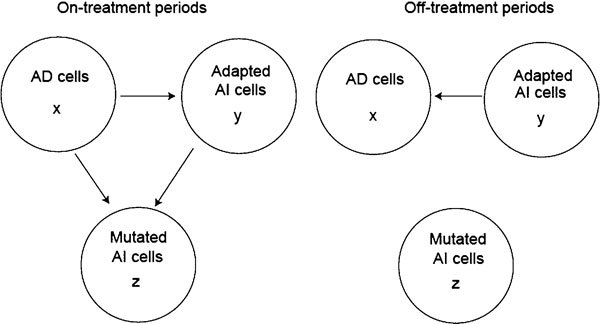
Schematic diagrams for the piecewise linear model. AD, androgen-dependent; AI, androgen-independent.
On-treatment periods:
Off-treatment periods:
where x, y and z represent the populations of the AD cells, AI cells with reversible adaptation that can return to AD cells during the off-treatment periods and mutated AI cells that cannot be changed to AD cells, respectively. It is reasonable to introduce the AI cells with reversible changes based on recent studies on the signalling pathways. The parameter  represents how much of the population j contributes to the net growth of the population i during the on-treatment periods. Similarly, the parameter
  represents how much of the population j contributes to the net growth of the population i during the off-treatment periods. The PSA level is given by
  , where
  for simplicity.
Using selected clinical PSA data, we fit the model parameters. Although the part of the dataset that contained relapsing disease was unavailable, we can reproduce relapse during the prediction by adding additional constraints.16 Figure 9 shows successful data fitting of the initial 2.5 cycles. Using the estimated parameter values, we can predict the future PSA levels to some extent. The predictions by the model for CAS and IAS are also shown. The time-series predictions suggest that for this patient, IAS can slightly prolong the time to relapse compared with CAS (for other examples, see Refs. 16 and 18).
Figure 9.
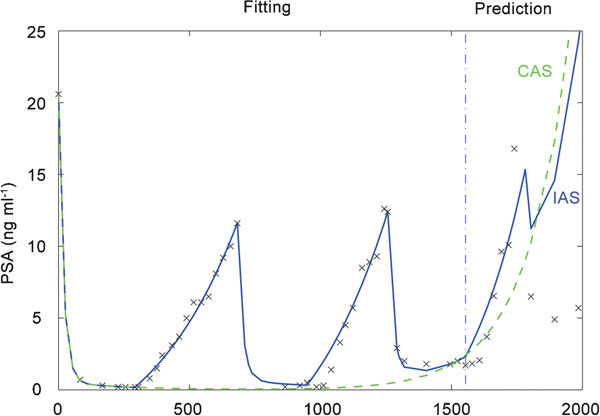
Fitting and prediction of the clinical PSA data by the piecewise linear model. The solid and dashed lines correspond to the model behaviours for IAS and CAS, respectively. The crosses show the actual observations of PSA. The datasets used in our paper were taken from the clinical trial of Refs. 19 and 20. This clinical trial was approved by the Health Protection Branch of the Ministry of Health of Canada and by the Clinical Research Ethics Review Boards of the participating centres. For this clinical trial, all patients provided written informed consent in accordance with their institutional guidelines. CAS, continuous androgen suppression; IAS, intermittent androgen suppression; PSA, prostate-specific antigen.
Based on these data analysis and predictions, we have classified the patients into three types, as follows (see also Figure 10):
Type (i): The patients for whom IAS can prevent relapse. The condition is given by
 .
.Type (ii): The patients for whom IAS can delay relapse. The conditions are given by
 , or
, or  or
or  .
.Type (iii): The other patients for whom CAS is better than IAS.16
Figure 10.
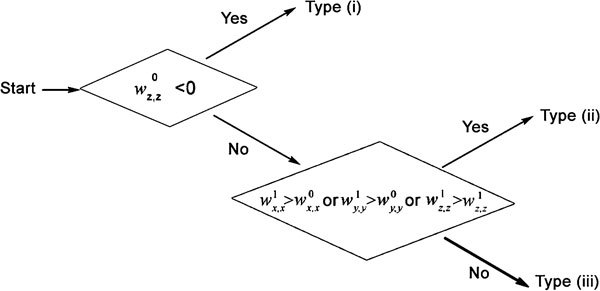
Flow chart for classifying the patients of prostate cancer to three types based on the estimated parameters for the piecewise linear model.
We have classified clinical data from 90 patients, according to the above conditions.18 Most patients (18 of 19) who experienced relapse were classified as Type (ii) or Type (iii). The majority (52 of 71) without relapse were classified as Type (i). (See Table 2 of Ref. 18 for details.) The significance level of the correlation between clinical decisions made by the patient's doctors and the classification by the piecewise linear model was  ; we used the program ‘Fisher's exact test' at http://aoki2.si.gunma-u.ac.jp/exact/exact.html for calculating this P value. Therefore, the result of the classification by the piecewise linear model is nearly consistent with the judgments made by medical teams on the basis of the patients' responses.16, 18
Controlling PCa with mathematical models
Once an accurate mathematical model for prostate cancer is defined and its parameters are estimated for each patient, one can control the growth of prostate cancer by designing an optimal and personalized treatment schedule for the on- and off-treatment periods.21, 22 In this section, we demonstrate how to design an optimal treatment schedule, based on the method in Ref. 22.
Here we focus on the piecewise linear model defined in the section on ‘The piecewise linear model'. In Ref. 22, we proposed an optimal design principle for intermittent androgen suppression. For the optimal design of a treatment schedule, we minimized the growth rate of prostate cancer by optimally setting the ratio of the on- and off-treatment periods. Mathematically this minimisation can be achieved by minimizing the largest eigenvalue for the matrix  that appears as the following analytic form of the solution22:
 |
where Ef,g represents the matrix component of the integration of the solution between times f and g. Thus, E0,t depends on the schedule of the on- and off-treatments. We can obtain this form of the solution because the model is piecewise linear.
The optimisation itself is combinatorial optimisation and requires considerable computation. To circumvent this computation burden, we assume that the treatment schedule is periodic and decompose Equation (22) in the following way:
 |
where T is the period and n is the maximum integer such that nT does not exceed t. Then, assuming the durations of the on- and off-treatment days in one period T to be t1 and t0=T−t1, respectively, E0,T can be written as
 |
 |
where  depends on
  and t1, and
  depends on
  and t0. The eigenvalues of
  are given by
 |
We evaluated the maximum of the eigenvalues numerically and obtained  and
and  to satisfy
  and
and  and to minimize the maximum.22
Here we show an example of an optimal treatment schedule for a Type (ii) patient (Figure 11). For this patient, we estimated the set of parameters from the first two cycles of IAS and designed an optimal periodic treatment schedule. The optimal periodic treatment schedule is better than the conventional intermittent androgen suppression because in the conventional method, the switching from an on-treatment period to an off-treatment period did not occur after the third off-treatment period in this case. While in the optimal periodic schedule, the growth rate of PSA was lower than that in the conventional method in the long run.
Figure 11.
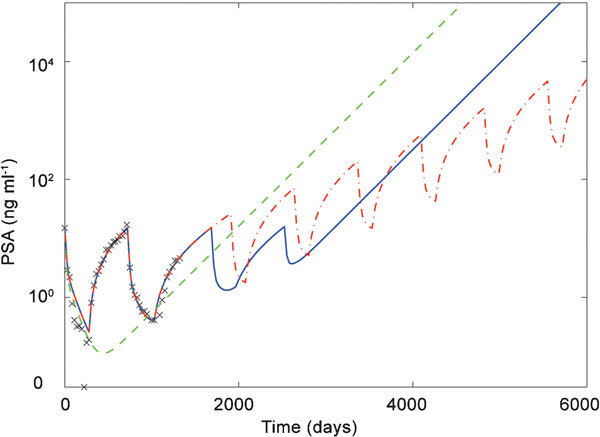
Conventional intermittent androgen suppression (the blue solid line) vs. an optimal periodic schedule for intermittent androgen suppression (the red dot-dashed line). We fitted the piecewise linear model using the observations of the PSA level for the first two cycles shown by the crosses. Then, the optimal periodic schedule was applied. The green dashed line shows the case of continuous androgen suppression. PSA, prostate-specific antigen.
Discussion
We have reviewed five mathematical models of prostate tumour growth under IAS.
The three deterministic models initially mentioned in this paper have been constructed to closely reproduce relapse, delayed relapse and relapse prevention. Because the parameter regions for relapse and relapse prevention correspond to qualitatively different solutions, the boundary between the two regions has been specified by using a numerical bifurcation analysis technique for hybrid dynamical systems; this type of numerical bifurcation analysis describes a qualitative change of the solution structure when the values of certain parameters change.
The stochastic hybrid system in the section on ‘The stochastic model' has been introduced to investigate the effect of stochastic noise. The model inherits the basic property of the deterministic model. However, the system is very sensitive to noise near the switching section where the switching from an on-treatment period to an off-treatment period occurs. Therefore, the number of cycles until the relapse can change as a result of small noise variations. This variability is a characteristic unique to switched dynamic systems, which is not observed in globally smooth dynamical systems.
The piecewise linear model in the section on ‘The piecewise linear model' has been introduced to fit and reproduce authentic serum PSA concentrations, as obtained from clinical trials. By estimating the parameter values in the system for each patient, the system can represent the characteristics of PSA variations, which vary from patient to patient. The piecewise linear model is able to classify patients in a manner that is highly consistent with clinical decision making. Despite its simplicity in terms of the number of parameters and the model equations, the piecewise linear model is the best model among those considered in this review paper, including the partial differential equations models, which quantitatively describes the dynamics of the clinically observed PSA time series with a biphasic decline in the PSA level during the on-treatment periods.
We also illustrated how to optimize treatment schedules by minimizing the maximal eigenvalue. At this time, we do not have clinical evidence for the validity of the optimisation, and thus, the method requires evaluation in future clinical trials.
Currently, we plan to implement the time-series analysis technique to assist medical doctors in clinical practice. The system uses monitored PSA levels as inputs, outputs the results of the model that fits the clinical data and predicts possible PSA variations under both CAS and IAS. For more precise diagnosis and prognosis, it is necessary to improve the model structure by incorporating factors related to molecular biology and clinical medicine. It is also important to reduce the necessary length of the PSA time-series data to obtain a good-fitting model without losing the accuracy of the prediction. In addition, we need to develop a statistical method to evaluate the reliability of the model for each individual patient so that a medical doctor can decide if they should follow the suggestions made by the mathematical models. To be more convenient, the control and optimisation theory could be helpful to determine the best treatment schedule.21, 22
Thus, mathematical models of prostate cancer can not only elucidate the mechanisms underlying intermittent androgen suppression for prostate cancer, but also provide more detailed diagnoses and optimal treatment schedules.
Moreover, it should be possible to generalize the personalized IAS therapy based on mathematical modelling, as explained in this review.
Figure 12a shows a schematic diagram of this IAS treatment, which is composed of the observation of PSA time-series data for a patient, the construction of a personalized mathematical model for the patient from the PSA data, the optimisation of the hormone therapy scheduling with the mathematical model, and finally, the actual treatment by a medical doctor. This methodology can be generally applied to other diseases if both reliable biomarkers and treatment options are available, such as PSA and hormone therapy for prostate cancer. Figure 12b shows a generalized scheme of this methodology for the personalized treatment of any disease. We expect that this kind of personalized chronotherapy based on mathematical modelling can create new possibilities for sophisticated therapy.
Figure 12.
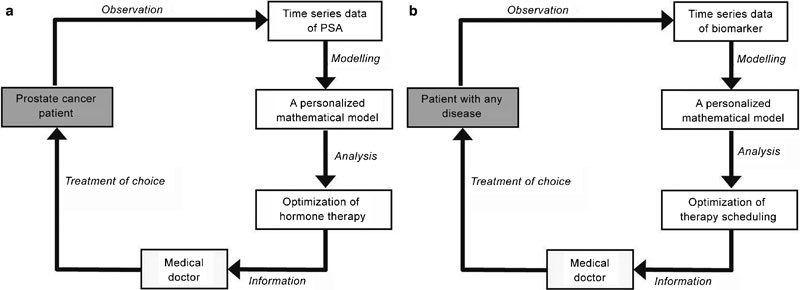
(a) A schematic diagram of personalized IAS therapy based on mathematical modelling. (b) A generalized schematic diagram of personalized therapy based on mathematical modelling. IAS, intermittent androgen suppression; PSA, prostate-specific antigen.
Author contributions
NB and KA designed the study. NB provided the clinical trial datasets. YH and GT conducted simulations using the mathematical models. YH performed the statistical analysis. All authors drafted the manuscript and read and approved the final manuscript.
Acknowledgments
This work was supported by the Aihara Innovative Mathematical Modelling Project, the Japan Society for the Promotion of Science (JSPS) through the Funding Program for World-Leading Innovative R&D on Science and Technology (FIRST Program), initiated by the Council for Science and Technology Policy (CSTP).
None of the authors has any competing financial interests related to this paper.
References
- Huggins C, Hodges CV. Studies on prostate cancer: I. The effect of castration, of estrogen and of androgen injection on serum phosphatases in metastatic carcinoma of the prostate. Cancer Res. 1941;1:293–7. [Google Scholar]
- Akakura K.Intermittent Endocrine Therapy for Prostate Cancer Tokyo; Medical View; 2005. Japanese. [Google Scholar]
- Noble RL. Hormonal control of growth and progression in tumors of Nb rats and a theory of action. Cancer Res. 1977;37:82–94. [PubMed] [Google Scholar]
- Bruchovsky N, Rennie PS, Coldman AJ, Goldenberg SL, To M, et al. Effects of androgen withdrawal on the stem cell composition of the Shionogi carcinoma. Cancer Res. 1990;50:2275–82. [PubMed] [Google Scholar]
- Akakura K, Bruchovsky N, Goldenberg SL, Rennie PS, Buckley AR, et al. Effects of intermittent androgen suppression on androgen-dependent tumors: apoptosis and serum prostate-specific antigen. Cancer. 1993;71:2782–90. doi: 10.1002/1097-0142(19930501)71:9<2782::aid-cncr2820710916>3.0.co;2-z. [DOI] [PubMed] [Google Scholar]
- Abrahamsson PA. Potential benefits of intermittent androgen suppression therapy in the treatment of prostate cancer: a systematic review of the literature. Eur Urol. 2010;57:49–59. doi: 10.1016/j.eururo.2009.07.049. [DOI] [PubMed] [Google Scholar]
- Jackson TL. A mathematical investigation of the multiple pathways to recurrent prostate cancer: comparison with experimental data. Neoplasia. 2004;6:679–704. doi: 10.1593/neo.04259. [DOI] [PMC free article] [PubMed] [Google Scholar]
- Jackson TL. A mathematical model of prostate tumor growth and androgen-independent relapse. Disc Cont Dyn Syst—Ser. B. 2004;4:187–201. [Google Scholar]
- Ideta AM, Tanaka G, Takeuchi T, Aihara K. A mathematical model of intermittent androgen suppression for prostate cancer. J Nonlinear Sci. 2008;18:593–614. [Google Scholar]
- Tanaka G, Tsumoto K, Tsuji S, Aihara K. Bifurcation analysis on a hybrid systems model of intermittent hormonal therapy for prostate cancer. Physica D. 2008;237:2616–27. [Google Scholar]
- Tanaka G, Tsuji S, Aihara K. Grazing-induced crises in hybrid dynamical systems. Phys Lett A. 2009;373:3134–9. [Google Scholar]
- Guo Q, Tao Y, Aihara K. Mathematical modelling of prostate tumor growth under intermittent androgen suppression with partial differential equations. Int J Bifurcat Chaos. 2008;18:3789–97. [Google Scholar]
- Tao Y, Guo Q, Aihara K. A model at the macroscopic scale of prostate tumor growth under intermittent androgen suppression. Math Mod Meth Appl Sci. 2009;19:2177–201. [Google Scholar]
- Tao Y, Guo Q, Aihara K. A mathematical model of prostate tumor growth under hormone therapy with mutation inhibitor. J Nonlinear Sci. 2010;20:219–40. [Google Scholar]
- Kokontis JM, Hay N, Liao S. Progression to LNCaP prostate tumor cells during androgen deprivation: hormone-independent growth, repression of proliferation by androgen, and role for p27Kip1 in androgen-induced cell cycle arrest. Mol Endocrinol. 1998;12:941–53. doi: 10.1210/mend.12.7.0136. [DOI] [PubMed] [Google Scholar]
- Hirata Y, Bruchovsky N, Aihara K. Development of a mathematical model that predicts the outcome of hormone therapy for prostate cancer. J Theor Biol. 2010;264:517–27. doi: 10.1016/j.jtbi.2010.02.027. [DOI] [PubMed] [Google Scholar]
- Shimada T, Aihara K. A nonlinear model with competition between prostate tumor cells and its application to intermittent androgen suppression therapy of prostate cancer. Math Biosci. 2008;214:134–9. doi: 10.1016/j.mbs.2008.03.001. [DOI] [PubMed] [Google Scholar]
- Tanaka G, Hirata Y, Goldenberg SL, Bruchovsky N, Aihara K. Mathematical modelling of prostate cancer growth and its application to hormone therapy. Philos Trans R Soc A. 2010;368:5029–44. doi: 10.1098/rsta.2010.0221. [DOI] [PubMed] [Google Scholar]
- Bruchovsky N, Klotz L, Crook J, Malone S, Ludgate C, et al. Final results of the Canadian Prospective Phase II trial of intermittent androgen suppression for men in biochemical recurrence after radiotherapy for locally advanced prostate cancer: clinical parameters. Cancer. 2006;107:389–95. doi: 10.1002/cncr.21989. [DOI] [PubMed] [Google Scholar]
- Bruchovsky N, Klotz L, Crook J, Goldenberg SL. Locally advanced prostate cancer: biochemical results from a prospective phase II study of intermittent androgen suppression for men with evidence of prostate-specific antigen recurrence after radiotherapy. Cancer. 2007;109:858–67. doi: 10.1002/cncr.22464. [DOI] [PubMed] [Google Scholar]
- Suzuki T, Bruchovsky N, Aihara K. Piecewise affine systems modelling for optimizing hormone therapy of prostate cancer. Philos Trans R Soc A. 2010;368:5045–59. doi: 10.1098/rsta.2010.0220. [DOI] [PubMed] [Google Scholar]
- Hirata Y, di Bernardo M, Bruchovsky N, Aihara K. Hybrid optimal scheduling for intermittent androgen suppression of prostate cancer. Chaos. 2010;20:045125. doi: 10.1063/1.3526968. [DOI] [PubMed] [Google Scholar]


