

Abstract
Prostate cancer (PCa) is the most common visceral malignancy in men with androgen deprivation therapy (ADT) the preferred therapy to suppress testosterone production and hence tumor growth. Despite its effectiveness in lowering testosterone, ADT is associated with side effects including loss of muscle mass, diminished muscle strength, decrements in physical performance, earlier fatigue and declining quality of life. This review reports a survey of the literature with a focus on changes in muscle strength, physical function and body composition, due to short-term and long-term ADT. Studies in these areas are sparse, especially well-controlled, prospective randomized trials. Cross-sectional and longitudinal data (up to 2 years) for men with PCa treated with ADT as well as patients with PCa not receiving ADT and age-matched healthy men are presented when available. Based on limited longitudinal data, the adverse effects of ADT on muscle function, physical performance and body composition occur shortly after the onset of ADT and tend to persist and worsen over time. Exercise training is a safe and effective intervention for mitigating these changes and initial guidelines for exercise program design for men with PCa have been published by the American College of Sports Medicine. Disparities in study duration, types of studies and other patient-specific variables such as time since diagnosis, cancer stage and comorbidities may all affect an understanding of the influence of ADT on health, physical performance and mortality.
Keywords: androgen deprivation therapy, androgen suppression, exercise prescription, exercise training, functional assessment, lean body mass, older men, prostate cancer
Introduction
Prostate cancer (PCa) is the most common visceral malignancy in men.1 Since the tumor is initially testosterone dependent, androgen deprivation therapy (ADT) is the preferred modality to suppress testosterone production in men with this disease. ADT has been extensively studied with surgical and chemical castration achieved via bilateral orchiectomy, use of a gonadotropin hormone-releasing hormone (GnRH) agonist or anti-androgens. Annually, about 500 000 men in the United States are treated with GnRH agonists.2 Though their effectiveness in lowering serum testosterone to castrate levels is well established, side effects are common.
Testosterone and its metabolites are essential for the maintenance of muscle mass and bone mineral content. Body composition changes in men undergoing ADT place them at increased risk not only for diminished physical capacity, but also for coronary artery disease, type II diabetes and the metabolic syndrome,3 though a recent meta-analysis suggests no increase in cardiovascular mortality.4 In addition, ADT-associated decreases in muscle and bone mass are thought to be associated with increased fracture risk, diminished muscle strength, decrements in physical performance, earlier fatigue and declining quality of life (Figure 1).
Figure 1.
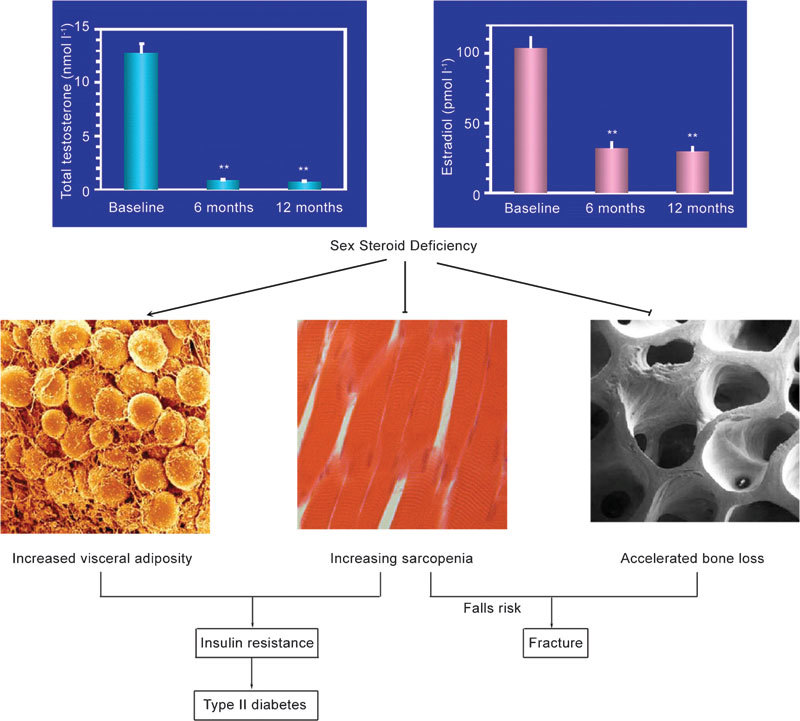
Consequences of androgen deprivation therapy (Courtesy of Mathis Grossmann, MD, University of Melbourne).
This narrative review focuses on changes in muscle strength, physical function and body composition. The effects of ADT on bone are discussed elsewhere in this issue. Cross-sectional and longitudinal data (up to 2 years) for men with PCa treated with ADT as well as patients with PCa not receiving ADT and age-matched healthy men (HC) are presented. For the purpose of this review, treatment durations of less than 6 months will be termed short-term ADT (ST-ADT) while treatment durations ≥6 months will be considered long-term treatment (LT-ADT). In addition, we examine the efficacy of exercise training interventions and briefly offer current recommendations for exercise intervention for possible mitigation of the adverse consequences of ADT.
Approach to literature review
The key words ‘PCa, androgen deprivation therapy, ADT, androgen suppression, muscle strength, physical function, body composition exercise and exercise training', were used in PubMed and Google Scholar searches. Studies included in this review were complete articles in peer-reviewed journals, and delimited to those studies in men with PCa undergoing or about to start ADT. Studies were included only if they reported measures of muscle strength or endurance, physical function or body composition either in randomized controlled trial (RCT), cross-sectional reports or studies with repeated measures over at least 3 months. Interventions during the study other than ADT or exercise training were excluded as were studies that did not clearly delineate PCa patients from patients with other cancers. Only English language papers were included.
Muscle function changes with ADT
Taken together, epidemiology and clinical trials data provide strong evidence of reduced muscle mass and strength in the presence of low testosterone levels occurring naturally or arrived at via artificial means. Both frank5 and ‘late-onset'6, 7, 8, 9 hypogonadism are associated with loss of lean body mass and muscle strength, increased fat mass and impaired physical function.5, 6, 7, 8, 9 In epidemiological studies of older men, lower endogenous bioavailable testosterone concentrations are associated with less lean body mass and lower levels of both upper and lower extremity skeletal muscle strength;6 decrements in self-reported and objective measures of physical function have also been reported though less conclusively. Larger longitudinal studies conducted in the United States10, 11 and the Netherlands12 have concluded that low levels of circulating testosterone are associated with impaired mobility and low muscle strength in aging men.
Clinical trials investigating the durability of exogenous testosterone effects reinforce these observations, and suggest that the effects of perturbations in circulating testosterone are localized in time and can be reversed. For instance, in a recent 12-month trial with 274 intermediate-frail and frail older men, lean body mass and leg muscle strength increased after 6-month treatment with 25–75 mg day−1 testosterone gel, but returned to baseline 6 months after withdrawal from treatment.13 The differing changes in lean mass and strength between groups appeared to be the direct influence of changing testosterone levels and not secondary treatment-related factors. A similar pattern of on-treatment gains and subsequent losses in muscle mass and strength were reported in a 24-week study of the durability of effects of 12 weeks' administration of oxandrolone on lean body mass, fat mass and several measures of muscle strength.14 In a manner mirroring these observations, administration of ADT is associated with loss of lean mass (see complete review below), contributing directly to loss of muscle strength. Aside from muscle mass, however, there are additional potential mediators of ADT influence on diminished muscle strength; androgen suppression has also been found to decrease androgen receptor concentration, decrease conduction of end-plate potentials at the myoneural junction and inhibit muscle protein synthesis by increasing insulin-like growth factor-binding factors thereby reducing local insulin-like growth factor-1.15 The relative contributions of these factors to overall loss in strength are at this point unknown.
Reports on muscle function or its change over time in men receiving ADT are few and have typically focused on strength measured with handgrip dynamometry. Declining grip strength or its absolute value16 has been shown to be associated with a number of important clinical outcomes. A 2008 systematic review17 reported that low grip strength was consistently associated with greater probability of premature mortality, earlier onset of disability and increased risk of complications or prolonged length of stay after hospitalization or surgery. Decreased functional status,18 increased prevalence of poor self-reported physical functioning19 and loss of independence in activities of daily living20, 21 have also been associated with low grip strength.
Several studies that have examined the effects of ADT on various measures of muscle performance are presented in Table 1. Most of these studies are cross-sectional with some studies including comparison groups comprised of men with PCa not initially treated with androgen suppression (PCa-0) and/or healthy age-matched men. One longitudinal study is included, but only baseline data are presented since no follow-up numerical data were provided.22
Table 1. Summary of baseline values in studies examining measures of muscle strength and endurance in men with prostate cancer treated with androgen deprivation therapy of different durations compared with control groups with and without prostate cancer.
| Performance measure | Type of study | Time on ADT (month) at baseline | N | Age (y) | Value | References |
|---|---|---|---|---|---|---|
| Grip strength (kg) | P-Long | 0 | 87 | 70 | 40 | Alibhai et al.,22 2010 |
| PCa-0 | 86 | 70 | 42 | |||
| HC | 86 | 68 | 41 | |||
| Right hand | CS | 34.8 | 20 | 74 | 28a | Soyupek et al.,23 2008 |
| HC | 20 | 73 | 39a | |||
| Left hand | CS | 21.6 | 57 | 73 | 35 | Joly et al.,24 2006 |
| Right hand | 39 | |||||
| Left hand | HC | 51 | 72 | 35 | ||
| Right hand | 37 | |||||
| Dominant hand | CS | 0 | 59 | 69 | 37 | Stone et al.,25 2000 |
| Chest press 1-RM (kg) | RCT | 18.2 | 29 | 70 | 34.6 | Galvao et al.,92 2010 |
| 10.1 | 28 | 70 | 34.7 | |||
| CS | 37 | 10 | 70 | 39.9 | Galvao et al.,37 2006 | |
| CS | >2 | 48 | 70 | 32.4a | Galvao et al.,66 2009 | |
| HC | 70 | 70 | 37.5a | |||
| Bench press 1-RM (kg) | CS | 45 | 20 | 70 | 21.6a | Basaria et al.,26 2002 |
| PCa-0 | 18 | 66 | 36.1a | |||
| HC | 20 | 69 | 27.7 | |||
| Leg press 1-RM (kg) | RCT | 18.2 | 29 | 70 | 98.4 | Galvao et al.,92 2010 |
| 10.1 | 28 | 70 | 102.6 | |||
| CS | 37 | 10 | 70 | 81.3 | Galvao et al.,37 2006 | |
| CS | >2 | 48 | 70 | 91.0 | Galvao et al.,66 2009 | |
| HC | 70 | 70 | 86.8 | |||
| CS | 45 | 20 | 70 | 86.2 | Basaria et al.,26 2002 | |
| PCa-0 | 18 | 66 | 118.4 | |||
| HC | 20 | 69 | 110.2 | |||
| Leg extension 1-RM (kg) | RCT | 18.2 | 29 | 70 | 38.1 | Galvao et al.,92 2010 |
| 10.1 | 28 | 70 | 40.0 | |||
| CS | >2 | 48 | 70 | 36.3a | Galvao et al.,66 2009 | |
| HC | 70 | 70 | 44.9a | |||
| Chest press end (reps to failure, 70% 1-RM) | RCT | 18.2 | 29 | 70 | 10.9 | Galvao et al.,92 2010 |
| 10.1 | 28 | 70 | 11.9 | |||
| CS | 37 | 10 | 70 | 9.0 | Galvao et al.,37 2006 | |
| CS | >2 | 48 | 70 | 11.6 | Galvao et al.,66 2009 | |
| HC | 70 | 70 | 11.4 | |||
| Reps to failure fixed resistance 20 kg | RCT | 12.8 | 155 | 68 | 32.2 | Segal et al.,117 2003 |
| Leg press end (reps to failure, 70% 1-RM) | RCT | 18.2 | 29 | 70 | 17.8 | Galvao et al.,92 2010 |
| 10.1 | 28 | 70 | 16.8 | |||
| CS | 37 | 10 | 70 | 20.3 | Galvao et al.,37 2006 | |
| CS | >2 | 48 | 70 | 18.0 | Galvao et al.,66 2009 | |
| HC | 70 | 70 | 17.7 | |||
| Reps to failure fixed resistance 40 kg | RCT | 12.8 | 155 | 68 | 37.4 | Segal et al.,117 2003 |
Abbreviations: CS, cross-sectional; END, endurance; HC, healthy control; PCa-0, patients with PCa but not using ADT; P-Long, prospective-longitudinal; RCT, randomized controlled triall; RM, repetitions maximum.
Identical symbols represent significant differences between groups within a study.
Grip strength
Soyupek et al.23 measured the effects of ADT on handgrip strength in 20 men with PCa treated for 35 months with an LH–RH agonist and in 20 age-matched HC (Table 1). Handgrip strength in men on ADT was 28% lower than in the control group. Both total and free testosterone were shown to be moderately correlated (r=616, P<0.001 and r=0.569, P<0.001, respectively) with handgrip strength. Conversely, other studies comparing men on LT-ADT with HC24 or men with PCa about to begin androgen suppression with PCa-0 and HC22 have shown no differences between groups in baseline handgrip strength (Table 1). In a study of 59 patients with PCa, higher levels of fatigue were not associated with objective measures of dominant hand grip strength, grip strength endurance or recovery from gripping exercise.25 Three months of ADT in this study resulted in a statistically significant decline in 3-min grip strength endurance, but grip strength and recovery from repeated fatiguing grip strength efforts did not change. Alibhai et al.22 showed no difference in baseline grip strength between men PCa-0 groups and HC, but a significant decline after 3 months of ADT in 87 men with PCa assigned to this group compared with no change in their PCa-0 and HC groups. After 12 months, subjects receiving ADT experienced a total fall of 5% in grip strength; men in the PCa-0 and HC groups remained stable over this period.
Dynamic strength measures
Measurement of muscle strength, power and endurance by means other than grip strength may be more well associated with greater muscle group specificity with implications for performance and impact on physical function. However, it is difficult to equate performance between cross-sectional studies unless test procedures, and particularly test equipment, movement pattern and muscle action are equivalent. When longitudinal data are presented using similar test procedures, use of percent change may allow reasonable comparisons of groups between studies. However, data presented here are largely cross-sectional with no commonality in test equipment. Consequently, caution is advised in comparing scores between studies even if the test exercise is the same.
In a well controlled cross-sectional study, Basaria et al.26 measured the effects of ADT on upper and lower body strength assessed by a one repetition maximum (1-RM) protocol with machine weights for the bench press and leg press exercises. Twenty men undergoing ADT for at least 12 months were compared with a PCa-0 group and an HC group all matched for age (Table 1). Men receiving ADT had 40% less upper body strength than the non-ADT group (P<0.05) and 22% less strength than the healthy controls. Although not significant, the ADT group had 27% and 22% less lower body strength than PCa-0 or HC, respectively. Somewhat surprisingly, men with PCa not receiving ADT (PCa-0) had non-significant 7% greater upper and 23% lower extremity strength than the healthy controls. The time since PCa diagnosis was not reported. Overall, these data suggest that lower levels of absolute muscular strength were associated with androgen suppression and not with PCa per se. However, apart from one other study,27 no baseline differences in 1-RM strength have been noted between men treated with ADT and HC groups (Table 2). No study has demonstrated differences in muscle endurance.
Table 2. Summary of baseline values in studies examining objective measures of physical function in men with prostate cancer treated with androgen deprivation therapy of different durations compared with control groups with and without prostate cancer.
| Performance measure | Type of study | Time on ADT (month) at baseline | N | Age (y) | Values | References |
|---|---|---|---|---|---|---|
| SPPB (0–12) | P-Long | 3.8 | 12 | 74 | 10.3 | Levy et al.,35 2008 |
| 24.6 | 23 | 71 | 9.5 | |||
| PCa-0 or HC | 13 | 67 | 10.3 | |||
| CS | 3.7 | 13 | 73 | 10.4a | Clay et al.,34 2007 | |
| 30.7 | 42 | 74 | 9.6a,b | |||
| PCa-0 | 25 | 65 | 10.4b | |||
| HC | 20 | 69 | 10.3 | |||
| P-Long | 36 | 50 | 78 | 7.9 | Bylow et al.,32 2008 | |
| Case–control | ≥6 | 63 | 72 | 10 | Bylow et al.,33 2011 | |
| PCa-0 | 71 | 71 | 10.3 | |||
| 6-MWT, m (m s−1) | P-Long | 0 | 87 | 70 | 471 (1.3) | Alibhai et al.,22 2010 |
| PCa-0 | 86 | 70 | 483 (1.3) | |||
| HC | 86 | 68 | 483 (1.3) | |||
| CS | >6 | 56 | 68 | 669 (1.9) | Culos-Reed et al.,36 2010 | |
| CS | 21.6 | 57 | 73 | 466 (1.3) | Joly et al.,24 2006 | |
| HC | 51 | 72 | 470 (1.3) | |||
| 400-m walk, s (m s−1) | RCT | 18.2 | 29 | 70 | 269.4 | Galvao et al.,92 2010 |
| 10.1 | 28 | 70 | 273.9 | |||
| CS | 37 | 10 | 70 | 283 (1.41) | Galvao et al.,37 2006 | |
| CS | >2 | 48 | 70 | 274b | Galvao et al.,66 2009 | |
| HC | 70 | 70 | 256b | |||
| 4-m walk, s (m s−1) | P-Long | 3.8 | 12 | 74 | 1.02 | Levy et al.,35 2008 |
| 24.6 | 23 | 71 | 1.04 | |||
| PCa-0 or HC | 13 | 67 | 1.07 | |||
| CS | 3.7 | 13 | 73 | 1.04 | Clay et al.,34 2007 | |
| 30.7 | 42 | 74 | 0.99b | |||
| PCa-0 | 25 | 65 | 1.06 | |||
| HC | 20 | 69 | 1.17b | |||
| 6-m usual walk, s (m s−1) | RCT | 18.2 | 29 | 70 | 4.7 (1.3) | Galvao et al.,92 2010 |
| 10.1 | 28 | 70 | 4.8 (1.3) | |||
| CS | 37 | 10 | 70 | 5.0 (1.2) | Galvao et al.,37 2006 | |
| CS | >2 | 48 | 70 | 4.8b (1.3) | Galvao et al.,66 2009 | |
| HC | 70 | 70 | 4.5b (1.3) | |||
| 6-m fast walk, s (m s−1) | RCT | 18.2 | 29 | 70 | 3.6 (1.7) | Galvao et al.,92 2010 |
| 10.1 | 28 | 70 | 3.6 (1.7) | |||
| CS | 10 | 70 | 3.7 (1.62) | Galvao et al.,37 2006 | ||
| CS | >2 | 48 | 70 | 3.7b (1.6) | Galvao et al.,66 2009 | |
| HC | 70 | 70 | 3.5b (1.7) | |||
| 6-m backward walk, s (m s−1) | RCT | 18.2 | 29 | 70 | 22.2 (0.3) | Galvao et al.,92 2010 |
| 10.1 | 28 | 70 | 23.7 (0.3) | |||
| CS | 37 | 10 | 70 | 23.5 (0.26) | Galvao et al.,37 2006 | |
| CS | >2 | 48 | 70 | 23.8b (0.3) | Galvao et al.,66 2009 | |
| HC | 70 | 70 | 19.9b (0.3) | |||
| 5× chair rise, s | P-Long | 3.8 | 12 | 74 | 13.5b | Levy et al.,35 2008 |
| 24.6 | 23 | 71 | 16.2b | |||
| PCa-0 or HC | 13 | 67 | 14.0 | |||
| RCT | 18.2 | 29 | 70 | 13.3 | Galvao et al.,92 2010 | |
| 10.1 | 28 | 70 | 13.4 | |||
| CS | 3.7 | 13 | 73 | 13.2 | Clay et al.,34 2007 | |
| 30.7 | 42 | 74 | 15.2 | |||
| PCa-0 | 25 | 65 | 13.7 | |||
| HC | 20 | 69 | 14.5 | |||
| CS | 37 | 10 | 70 | 15.4 | Galvao et al.,37 200637 | |
| CS | >2 | 48 | 70 | 13.5b | Galvao et al.,66 2009 | |
| HC | 70 | 70 | 12.0b | |||
| TUG, s | P-Long | 0 | 87 | 70 | 6.9 | Alibhai et al.,22 2010 |
| PCa-0 | 86 | 70 | 6.8 | |||
| HC | 86 | 68 | 6.5 | |||
| CS | 21.6 | 57 | 73 | 6.0 | Joly et al.,24 2006 | |
| HC | 51 | 72 | 6.0 | |||
| 13-step stair climb, s | RCT | 18.2 | 29 | 70 | 5.2 (326 W) | Galvao et al.,92 2010 |
| 10.1 | 28 | 70 | 5.3 (340 W) | |||
| CS | 37 | 10 | 70 | 7.0 (248 W) | Galvao et al.,37 2006 |
Abbreviations: 5× chair rise is the time (s) to perform five complete stands from an armless chair; CS, cross-sectional; HC, healthy control; 6-MWT, 6-min walk test expressed in meters walked and (gait speed, m s−1). The 400-, 4- and 6-m walk tests are in expressed in seconds and (m s−1); PCa-0, patients with PCa but not using ADT; P-Long, prospective-longitudinal; RCT, randomized controlled trial; SPPB, Short Physical Performance Battery scored on a 0–12 point scale; TUG, timed up-and-go expressed in seconds.
Identical symbols represent significant differences between groups within a study.
Very few studies have examined the specific impact of ADT on muscular performance. Handgrip strength appears to yield similar baseline values in men undergoing ST-ADT, LT-ADT, men with PCa receiving no ADT, and in age-matched HC. A single exception found a significant 28% decrement in right grip strength in men with LT-ADT exposure with an average 35-month ADT exposure compared to HC.23 One study showed no change in grip strength after 3 months of ADT25 and one study demonstrated a 5% loss of grip strength over 12 months of ADT exposure compared with no change in controls.28 Logically, handgrip strength might be a reasonable predictor of upper body strength. Grip strength has been shown to correlate well with other muscle strength tests29 such as knee extension strength or diaphragmatic strength; it should not be used as surrogate for muscle function of lower extremities when evaluating physical performance.30 Despite its previously published associations with a number of important outcomes, grip strength cannot replace evaluation of assessment of activities of daily living, lower extremity strength or walking speed in fragile populations, such as the elderly or in patients with diseases that might affect physical performance. Measures of dynamic muscle strength using muscle groups, type of muscle action and movement patterns similar to activities of daily living, may be more logical choices for strength assessments and their relation to physical performance.
Well-designed, longitudinal studies including PCa-0 and age-matched healthy control groups with sample sizes large enough to confirm adequate statistical power are needed. Of added importance is the need to establish whether loss of muscle strength per se is mechanistically related to decrements in lean body mass, physical function and survival in men treated with ADT.
Physical performance alterations with ADT
Measures of physical function reported in studies of ADT include subjective self-reports, as well as objective measures of physical function. Commonly used objective assessments include the short physical performance battery (SPPB),31, 32, 33, 34, 35 walk tests with targeted walk distances of 4–400 m24, 28, 34, 35, 36, 37 or target durations such as the 6-min walk test (6-MWT).38 In addition, repetitive chair stands,34, 35 the timed up-and-go (TUG),22, 24, 39 and stair climb tests37 have also been used to characterize physical performance in men undergoing ADT. Acquiring these data should provide insight into whether PCa per se or use of ADT in its treatment results in differential decrements in physical performance or whether interventions to mitigate these outcomes are effective. This report focuses on the objective measures of physical function.
Only a small number of studies have examined physical function in men undergoing ADT. Figure 2 displays annualized proportionate changes in a number of physical function outcomes in two longitudinal studies of at least one year duration. Table 2 summarizes baseline data from several longitudinal and cross-sectional studies. These are described below.
Figure 2.
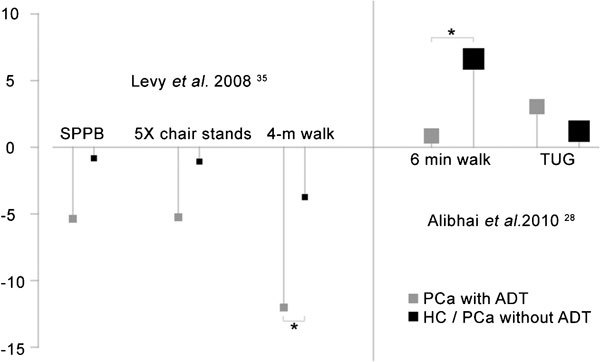
Annualized proportionate change in physical function outcomes in two longitudinal studies of at least 1-year duration, by treatment arm (ADT or control). Points are displayed with magnification proportionate to the square root of group sample size. Statistically significant differences between ADT (grey; PCa treated with ADT) and control (black; healthy control or PCa without ADT) are denoted with a star (*). ADT, androgen deprivation therapy; HC, healthy men; PCa, prostate cancer; SPPB, short physical performance battery; TUG, timed up-and-go test.
SPPB
Lower-extremity physical function assessed by the SPPB has been in widespread use since its development over 15 years ago.31 Strong associations have been found between SPPB performance in older persons and measures of self reported disability,31 functional measures such as the 6-MWT27 and 400-m walk time,40, 41 and is a strong and consistent predictor of progressive disability, hospitalization, poor clinical outcomes after hospitalization, nursing home admission and mortality.31, 42, 43, 44, 45, 46, 47, 48 Criteria for small and substantial meaningful change scores have been established.49, 50
Baseline SPPB scores in men with PCa suggest normally functioning individuals (scores greater than 9 out of 12 possible), but with a tendency for men with longer ADT exposure to have slightly lower scores compared with control groups. Notably, one cross-sectional study reported an SPPB score of 7.9 in men averaging 36 months of ADT.32 In this study, 56% of subjects had abnormal (<9 points) SPPB scores. Another cross-sectional study reported baseline SPPB scores in men with surgical or chemical castration of 31 months duration that were significantly lower than in men who had only 4 months treatment and in men with PCa who had not been treated, although the latter group tended to be younger than the other groups.34 One prospective study35 reported a 1.02 point change in SPPB score over 24 months in men who had been treated with a GnRH agonist alone or in combination with an antiandrogen for an average of 25 months. This >1 point difference from baseline is suggestive of a substantial meaningful change.49, 50 Men who had an average of 4 months of ADT at baseline as well as men with PCa not receiving ADT or HC changed by 0.42 and 0.17 points in SPPB, respectively, over the 24-month study period. Neither baseline values nor changes after 24 months were significantly different between groups.
Walk tests
Walking is a fundamental activity of daily living, that has been reported as a clinical indicator of well-being, reflective of health and functional status, and associated with mobility-related fatigue and survival among older adults.51, 52, 53, 54, 55, 56, 57, 58 Walking speed of 1 m s−1 is an important threshold for predicting an individual's physical function, ability to live independently, global health decline, rates of hospitalizations and mortality.52, 59 Walk tests of fixed distances of 4–400 m as well as the 6-MWT have been frequently used to assess functional capacity in patient groups.38, 60, 61, 62, 63, 64, 65 In their prospective, 24-month trial, Levy et al.35 examined changes in the 4-m walk time in men undergoing ST-ADT or LT-ADT. Performance on these tests was contrasted with a control group comprised of men who had PCa but without surgical or chemical castration (PCa-0) or healthy, age-matched men.35 There were no differences in gait speed between groups at baseline, but LT-ADT subjects had significant decrements in gait speed from 1.04 to 0.79 m s−1 which was significantly different from the change observed in the control subjects. No difference was observed between LT-ADT and ST-ADT walk speeds despite a 0.24-s decrease in speed. The >0.2 s decline in gait speed over the 24-month study period for these subjects is substantial50 and portends increased morbidity and mortality.52, 56, 58
Also evaluating 4-m walk time in a cross-sectional study, Clay et al.34 revealed significant differences in speed over the 4-m course between men receiving LT-ADT and healthy controls; no differences were seen among ST-ADT, men with PCa but without ADT or healthy controls. However, the 0.99 m s−1 walk speed in the LT-ADT group suggests greater risk for mobility limitation.52, 58
One group has used the 6-m walk distance at both usual and fast speeds as well as a backward 6-m walk to assess dynamic balance in men undergoing ADT.37, 66 In an earlier study, Galvao et al.37 assessed 10 men who had averaged 37 months of ADT (half had averaged 5 months on treatment) before and after 20 weeks of progressive, high-intensity resistance exercise training (see exercise training in ADT, below). Walk speeds for usual pace and fast pace were 1.2 and 1.6 m s−1, respectively. Speed for the backwards walk was 0.26 m s−1. The study design did not include control groups but for comparison, published reference values for healthy men in their 70s reported usual and fast walk speeds averaging (s.d.) 1.33 (0.20) and 2.08 (0.36) m s−1, respectively. Six meter backward walk speeds of 0.36 to 0.27 m s−1 have been reported in healthy men and women of similar age.67 Encouragingly, Galvao et al.37 reported improved usual pace, fast paced, and backward 6-m walk by 14%, 5.5% and 22.3%, respectively. The improvement in usual pace walk speed from 1.2 to 1.4 m s−1 exceeds the 0.1 m s−1 improvement criteria for substantial meaningful change.49, 50 Subsequently, in a larger, cross-sectional evaluation, Galvao et al.37 demonstrated significant differences between men receiving ADT and age matched healthy men (Table 2).66
The 6-MWT is an assessment of physical function used widely in several fragile populations62, 64, 68, 69, 70, 71, 72, 73 as the ability to walk for a distance is a quick and inexpensive measure of physical function, and an important component of independence and quality of life. Reference values68, 74, 75, 76 and criteria for meaningful change are published.50, 77, 78, 79, 80 The significant associations have been demonstrated between 6-min walk distance and lower extremity physical function,27, 81 lower extremity strength and power27 and survival.61, 72 Table 2 displays results from studies using this functional measure.
Three studies have examined 6-MWT scores in studies of men using ADT.22, 24, 36 Culos-Reed et al.36 reported that men on ADT for >6 months averaged 669 m in 6 min, a gait speed of 1.9 m s−1. These were baseline data prior to the onset of a 16-week controlled exercise training intervention. The training program did not result in significant improvements in either group, but the 25 and 20 additional meters walked in the two groups, respectively, suggest a small, meaningful change.50 The ability of subjects in this cohort to improve the 6-MWT may have been limited by a ceiling effect due to their exceptional baseline performance that is at least equal to that in HC of the same age: 525 m or about 1.5 m s−1.74 Another cross-sectional study reported 6-MWT performance in men who averaged 22 months of ADT that was nearly identical to an age-matched HC group, both groups averaging about 470 m (1.3 m s−1).24 Similarly, in a 12-month study of men about to begin ADT, men with PCa who would serve as non-ADT controls, and HC, baseline values for the 6-MWT were not significantly different, averaging about 480 m.22 Notably, while both control groups in this study improved over the 12-month observation period, patients treated with ADT remained stable. Differences in walk performance between HC and patients on ADT, although not statistically significant, were seen after just 3 months on treatment.
The 400-m walk test is somewhat analogous to the 6-MWT but uses a target distance rather than time. Walking speed over 400 m has been shown to be significantly faster than that for the 6-MWT.82 Test–retest reliability has been established83 and significant associations have been reported between 400-m walk time and aerobic capacity, lower extremity strength and power,40, 84 mobility limitation85 as well as mortality prognosis in older persons.86, 87, 88, 89 Minimally significant change for the 400-m walk test has been estimated at 20–30 s, while 50–60 s was suggested as criteria for substantial change.49
Prior to their 20-week progressive, resistance exercise training study in long-term users of ADT, Galvao et al.37 reported a mean 400-m walk time of 283 s (1.4 m s−1). This compares favorably with a mean walk speed of 1.34 m s−1 over 400 m for a group of 20 (four women) healthy subjects at 73 years of age.82 Also, the walk speed reported by Galvao et al.37 was similar to those observed in two cross-sectional studies of men receiving ADT who were measured with the 6-MWT.22, 24 The effectiveness of the exercise training was seen in a significant 30 s (7.4%) improvement which exceeds the 20 s criteria reported by Kwon et al.49 for a minimally significant change.
Additional measures to assess physical function in men with ADT have included time for five chair stands, TUG and stair climbs. These are relevant assessments of everyday activities and reasonable choices for examining the consequences of ADT on muscle function and physical performance. Data from studies using these measures of are summarized in Table 2.
One study noted significantly slower chair stand times in LT-ADT versus ST-ADT but not between either of these groups and PCa-0 or controls.35 In a cross-sectional study, men with at least 2 months ADT exposure were significantly slower in completing five chair stands than healthy controls.66 Several other studies have not been able to detect differences in chair stand time between using and not using ADT.
TUG and a 13-step stair climbing task
A meta-analysis of 21 studies showed that time for TUG in healthy older adults progressively increased with age averaging 8.1 s among 60–69 year olds, 9.2 s among 70–79 year olds and 11.3 s among 80–99 year olds.90 Two studies that assessed TUG in men receiving ADT and their control groups (Table 2) revealed times that were actually 23%–35% faster than reported of healthy age-matched individuals in the meta-analysis.
The stair climb test has been used infrequently as a measure of physical function in men undergoing ADT, but has the advantage of not being as susceptible to ceiling effects as other functional tests.91 To our knowledge, only one small uncontrolled study37 and one RCT92 of men exposed to LT-ADT have used this physical performance measure in ADT (Table 2). In the RCT, time for climbing 13 steps at baseline was not different between men assigned to exercise (18 months ADT use) or men with 10-month ADT exposure assigned to control. Twelve weeks of exercise training improved time by 4% and 2%, respectively, but the difference was not significant. Conversely, in their uncontrolled study, this same group demonstrated a significant 10% improvement in time to ascend the 13 steps after 20 weeks of resistance training.37 For comparison, we have estimated stair climb power in this study by using reported values for step rise, number of steps, an estimate of body weight and time to climb the 13 steps. At baseline, powers so calculated were 251 and 326–340 W for the two groups in the RCT. Recently, we reported that baseline 12-step stair climbing power averaged 322 W93 in 165 older men (mean age: 74 years) with mobility limitation. Although stair climb data in older men with PCa receiving ADT are limited, data from the studies noted above and in Table 3 suggest a 22% deficit when compared with men of approximately the same age with mobility limitation.
Table 3. Summary of baseline values in studies examining measures of body composition in men with prostate cancer treated with androgen deprivation therapy of different durations compared with control groups with and without prostate cancer.
| Type of study | Time on ADT (month) at baseline | N | Age (y) | Baseline values | References |
|---|---|---|---|---|---|
| Table 3A Body mass index (kg m−2) | |||||
| P-Long | 3.8 | 12 | 74 | 28.7 | Levy et al.,35 2008 |
| 24.6 | 23 | 71 | 29.6 | ||
| PCa-0 or HC | 13 | 67 | 28.7 | ||
| P-Long | 3.0 | 43 | 71 | 28.4 | van Londen et al.,105 2008 |
| 30.7 | 67 | 71 | 29.1 | ||
| PCa-0 | 81 | 67 | 28.3 | ||
| HC | 53 | 63 | 27.6 | ||
| P-Long | 0 | 32 | 66 | 26.9 | Smith et al.,104 2002 |
| P-Long | 0 | 79 | 71 | 28.4 | Smith et al.,129 2004 |
| P-Long | 0 | 35 | 75 | 25.9 | Berruti et al.,106 2002 |
| 11.6 | 50 | 73 | 25.3 | Denti et al.,130 1996 | |
| HC | 58 | 74 | 24.4 | ||
| P-Long | 0 | 10 | 74 | 25.2 | Tayek et al.,131 1990 |
| P-Long | PCa-0 | 18 | 67 | 24.7 | Nowicki et al.,132 2001 |
| P-Long | 0 | 25 | 68 | 29.1 | Smith et al.,107 2006 |
| P-Long | 0-12 | 26 | 65 | 27.1 | Smith et al.,100 2008 |
| P-Long | 0 | 62 | 69 | 25.4 | Stone et al.,25 2000 |
| RCT | 18.2 | 29 | 70 | 27.4 | Galvao et al.,92 2010 |
| 10.1 | 28 | 70 | 28.0 | ||
| RCT | 3 (median) | 120 | 72 | 28.8 | Ryan et al.,134 2007 |
| CS | 3.7 | 13 | 73 | 28.3 | Clay et al.,34 2007 |
| 30.7 | 42 | 74 | 28.1 | ||
| PCa-0 | 25 | 65 | 28.0 | ||
| HC | 20 | 69 | 27.6 | ||
| CS | >12 | 20 | 74 | 26.6 | Soyupek et al.,23 2008 |
| HC | 20 | 73 | 25.9 | ||
| CS | 45 | 20 | 70 | 29.6a | Basaria et al.,26 2002 |
| PCa-0 | 18 | 66 | 27.6 | ||
| HC | 20 | 69 | 24.7b | ||
| CS | <6 | 24 | 74 | 28.6 | Dacal et al.,109 2006 |
| ≥6 | 29 | 73 | 27.4 | ||
| PCa-0 | 23 | 64 | 28.5 | ||
| HC | 20 | 64 | 26.9 | ||
| CS | 12-60 | 62 | 74 | 27.4a | Chen et al.,101 2002 |
| HC | 47 | 73 | 25.8a | ||
| CS | >6 | 30 | 72 | 26.8 | Boxer et al.,96 2005 |
| HC | 25 | 75 | 26.1 | ||
| CS | PCa-0 | 11 | 69 | 28.4 | Maturo et al.,110 2003 |
| HC | 11 | 70 | 27.6 | ||
| CS | >6 | 63 | 68 | 28.7 | Culos-Reed et al.,36 2010 |
| CS | 41 | 19 | 72a | 28.0 | Stoch et al.,1 2001 |
| PCa-0 | 41 | 70b | 26.6 | ||
| HC | 197 | 66a,b | 27.9 | ||
| CS | PCa-0 | 155 | 68 | 28.8 | Segal et al.,117 2003 |
| CS | 37 | 10 | 70 | 28.0 | Galvao et al.,37 2006 |
| Table 3B Percent Lean body mass | |||||
| P-Long | 3.8 | 12 | 74 | 70.9 | Levy et al.,35 2008 |
| 24.6 | 23 | 71 | 65.6 | ||
| PCa-0 or HC | 13 | 67 | 72.3 | ||
| P-Long | 65a | 66 | 69.7 | Lee et al.,99 2005 | |
| P-Long | 3.0 | 43 | 71 | 69.9 | van Londen et al.,105 2008 |
| 30.7 | 67 | 71 | 65.9 | ||
| PCa-0 | 81 | 67 | 70.3 | ||
| HC | 53 | 63 | 71.6 | ||
| P-Long | 0 | 32 | 66 | 70.3 | Smith et al.,104 2002 |
| P-Long | PCa | 79 | 71 | 68.7 | Smith et al.,103 2004 |
| P-Long | 0 | 72 | 74 | 55.8 kg | Galvao et al.,95 2008 |
| P-Long | 0 | 35 | 75 | 68.5 | Berruti et al.,106 2002 |
| P-Long | 0 | 25 | 68 | 68.1 | Smith et al.,107 2006 |
| RCT | 18.2 | 29 | 70 | 69.5 | Galvao et al.,92 2010 |
| 10.1 | 28 | 70 | 69.5 | ||
| CS | 3.7 | 13 | 73 | 71.1c | Clay et al.,34 2007 |
| 30.7 | 42 | 74 | 66.7a–c | ||
| PCa-0 | 25 | 65 | 71.1a | ||
| HC | 20 | 69 | 71.2a | ||
| CS | <6 | 24 | 74 | 68.1 | Dacal et al.,109 2006 |
| ≥6 | 29 | 73 | 66.8 | ||
| P<0.01 for ADT groups vs. no ADT groups | |||||
| PCa-0 | 23 | 64 | 70.7 | ||
| HC | 20 | 64 | 72.2 | ||
| CS | 12-60 | 62 | 74 | 64.2 | Chen et al.,101 2005 |
| HC | 47 | 73 | 70.6 | ||
| CS | >6 | 30 | 72 | 53.3 | Boxer et al.,96 2005 |
| HC | 25 | 75 | 54.3 | ||
| CS | PCa-0 | 11 | 69 | 65.1a | Maturo et al.,110 2003 |
| HC | 11 | 70 | 67.3a | ||
| CS | 41 | 19 | 72a | 71.0 | Stoch et al.,1 2001 |
| PCa-0 | 41 | 70a | 75.0 | ||
| HC | 197 | 66a,b | NA | ||
| Appendicular skeletal muscle mass (kg) | |||||
| P-Long | 0 | 72 | 74 | 23.4 | Galvao et al.,95 2008 |
| Appendicular skeletal muscle mass index (ASM Ht−2) | |||||
| CS | >6 | 30 | 72 | 7.5 | Boxer et al.,96 2005 |
| HC | 25 | 75 | 7.5 | ||
| Table 3C Percent relative body fat</emph> | |||||
| P-Long | 3.8 | 12 | 74 | 26.5 | Levy et al.,35 2008 |
| 24.6 | 23 | 71 | 31.6 | ||
| PCa-0 or HC | 13 | 67 | 24.7 | ||
| P-Long | 35 | 65d | 66 | 27.1 | Lee et al.,99 2005 |
| P-Long | 0 | 26 | 65 | 25.1 | Smith et al.,112 2004 |
| P-Long | 0 | 25 | 68 | 28.7 | Smith et al.,107 2006 |
| P-Long | 0 | 79 | 71 | 28.0 | Smith et al.,103 2004 |
| P-Long | 3.0 | 43 | 71 | 27.1 | van Londen et al.,105 2008 |
| 30.7 | 67 | 71 | 31.4 | ||
| 0 | 81 | 67 | 26.7 | ||
| HC | 53 | 63 | 25.1 | ||
| P-Long | 0 | 32 | 66 | 26.4 | Smith et al.,104 2002 |
| P-Long | 0 | 72 | 74 | 25.8 | Galvao et al.,95 2008 |
| P-Long | 0 | 35 | 75 | 24.7 | Berruti et al.,106 2002 |
| P-Long | >6 | 30 | 72 | 29.8a | Boxer et al.,96 2005 |
| HC | 25 | 75 | 26.6a | ||
| RCT | 18.2 | 29 | 70 | 27.5 | Galvao et al.,92 2010 |
| 10.1 | 28 | 70 | 27.3 | ||
| CS | 3.7 | 13 | 73 | 26.2c | Clay et al.,34 2007 |
| 30.7 | 42 | 74 | 30.5a–c | ||
| PCa-0 | 25 | 65 | 25.9a | ||
| HC | 20 | 69 | 25.6b | ||
| CS | 45 | 20 | 70 | 32.2a,b | Basaria et al.,26 2002 |
| PCa-0 | 18 | 66 | 26.2a | ||
| HC | 20 | 69 | 22.4b | ||
| CS | <6 | 24 | 74 | 29.0 | Dacal et al.,109 2006 |
| ≥6 | 29 | 73 | 30.2 | ||
| P<0.01 for ADT groups vs. no ADT groups | |||||
| PCa-0 | 23 | 64 | 26.3 | ||
| HC | 20 | 64 | 24.6 | ||
| CS | 12-60 | 62 | 74 | 30.2a | Chen et al.,101 2002 |
| HC | 47 | 73 | 25.7a | ||
| CS | PCa-0 | 11 | 69 | 29.5 | Maturo et al.,110 2003 |
| HC | 11 | 70 | 29.6 | ||
| CS | 41 | 19 | 72a | 29 | Stoch et al.,1 2001 |
| PCa-0 | 41 | 70b | 25 | ||
| HC | 197 | 66a,b | NA | ||
| CS | 37 | 10 | 70 | 30.7 | Galvao et al.,37 2006 |
Abbreviations: ASM, appendicular skeletal muscle mass; ASM Ht−2, appendicular skeletal muscle mass index, ASM divided by height squared; CS, cross-sectional; HC, healthy control; PCa-0, patients with PCa but not using ADT; P-Long, prospective-longitudinal; RCT, randomized controlled trial.
Identical symbols represent significant differences between groups within a study.
35% of the 65 subjects had received GnRH agonist treatment for 35 months before entry into study. The remainder began ADT and continued treatment over the 12-month study duration.
When documenting the effects of ADT on physical function, future studies should consider ceiling effects in physical function tests. While the ideal test is one in which performance on the test is linearly related to the participant's ability, many tests reach a ceiling when performance cannot be improved once a particular ability is achieved.94 In this case, more physically demanding, yet realistic assessments might be considered. For example, performing 50-m walk test or climbing a flight of 12 steps while carrying a load was better able to discriminate performances among older, HC and older men with mobility limitations.93, 94
Body composition
Body composition is defined as the proportion of different tissue masses in the body. Its analysis can be very detailed and include water compartments, and elemental components of the body; however, the most common approach used to study the effect of ADT on body composition in studies of effects are measurements of fat mass (often expressed as percent body fat), lean mass (% LBM) and bone density. These tissue masses are generally reported for the whole body, although regional measures of body composition such as appendicular skeletal muscle mass (ASM)95 and ASM index (ASM Ht−2)96 have also been reported. Not strictly a measure of body composition, body mass and body mass index (BMI), are common indicators in studies on the effects of ADT on body weight. BMI was the focus of one study in over 450 men with ADT97 and body mass alone is commonly reported and was the subject of one 3-year study with the natural history of change in body mass with ADT.98
The summary of published data reported here focuses on BMI, % LBM and % Fat, as affected by androgen suppression. Except where noted all body composition variables were measured with dual energy X-ray absorptiometry (DEXA).
Body mass
Kim et al.98 reported change in body mass from a study of 132 men aged 66 years identified from the Shared Equal Access Regional Cancer Hospital database who started and continued ADT for up to 3 years after radical prostatectomy. Weight change was defined as the difference in body weight 6 months before starting ADT and between 6 and 18 months after starting ADT. Seventy percent of men in the study gained weight in the first year, while 26% lost weight with an overall mean (s.d.) change of 2.2 (4.1) kg. In the men who gained weight, gain averaged 4.2 (2.9) kg; weight losers lost a mean of 2.4 (2.4) kg. Among the men with body weight recorded in the year before and in the second year after starting ADT (64% of total sample), there was no significant weight change in the year prior to ADT or in the second year on therapy. However, the average weight while on ADT was 2.1 kg higher than pre-ADT weight and was thus similar to the entire cohort. Overall, these data support previously published smaller data99, 100 indicating the majority of weight change occurs within the first year of starting ADT, although neither was actually measured.
BMI
The effects of short- and long-term exposure to ADT on BMI are summarized in Table 3A and in Figure 3 along with comparisons of generally age-matched men with PCa and HC. The majority of these studies suggest no differences in BMI for men receiving ADT, PCa-0 or HC and that men in these studies are generally overweight with BMI averaging about 28.2 kg m−2. Only two26, 101 of the 23 studies included in Table 3 found statistically significant differences between groups with men receiving LT-ADT and healthy, age-matched controls. Beehler et al.97 assessed the association between ADT and changes in BMI with multilevel modeling in 473 cases of men with PCa drawn from the tumor registry at the Buffalo Veterans Administration Comprehensive Cancer Center. Neither surgery, radiation treatment nor ADT was associated with significant change in BMI over time. However, there was a linear relationship between the number of GnRH agonists dose and decreasing BMI over time especially among men who were younger at PCa diagnosis; younger survivors had a significant 33% greater rate of change than men averaging 68 years and 100% greater rate of change than men aged 77 years. A recent systematic review reported data from eight longitudinal studies (208 total patients) on the effects of ADT on body composition and BMI.102 The right panel of Figure 3 displays these data as an annualized percent change in BMI in studies with at least 1-year exposure.102 Figure 3 also presents longitudinal relationships between length of ADT exposure and BMI (left panel). Subjects newly receiving ADT show the most rapid changes, but overall changes are modest, reflecting the combined effect of ADT on lean mass (increases) and fat mass (decreases), and BMI's limited utility as a proxy for measures of body composition.
Figure 3.
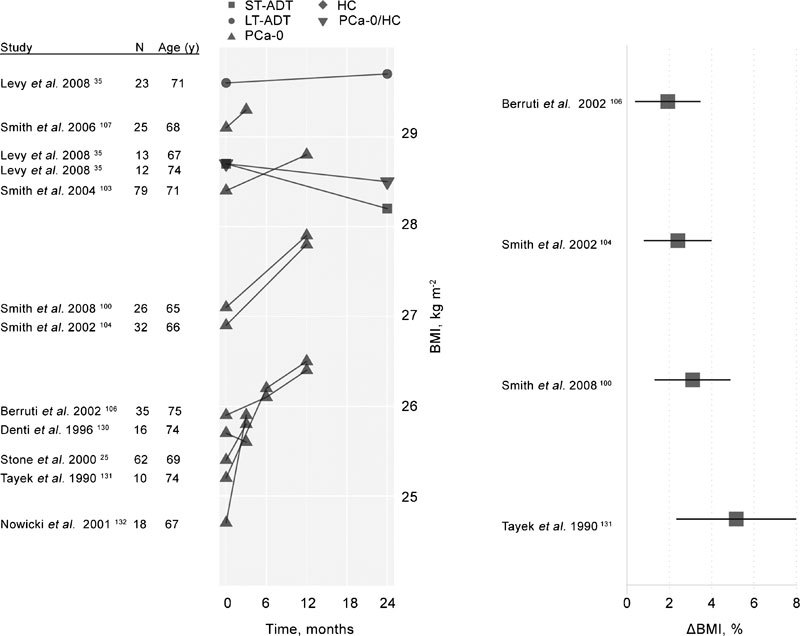
Left: Longitudinal changes in BMI among men enrolled in ADT studies. Untreated, healthy control participants are denoted as HC. A single mixed control group of healthy men and men with PCa not treated with ADT (HC/PCa-0) is also displayed. The remaining participants (all with PCa diagnoses and treated with ADT in the studies displayed) are classified according to their history of treatment with ADT prior to the current study. These groups include subjects with short-term (less than 6 months) previous exposure to ADT (ST-ADT groups), longer-term (six months or longer) previous exposure to ADT (LT-ADT groups) and subjects with no prior history of ADT exposure (PCa-0). Right: Annualized percent change in BMI among subjects treated with ADT in studies of at least 1-year duration reporting BMI change values, adapted from Haseen et al.102 ADT, androgen deprivation therapy; BMI, body mass index; HC, healthy men; PCa, prostate cancer.
LBM
Table 3B presents baseline values for % LBM from longitudinal35, 95, 96, 99, 103, 104, 105, 106, 107 and cross-sectional studies.1, 34, 37, 101, 108, 109, 110 In addition, two longitudinal studies include data for baseline and 6-month96 and 9-month95 values for LBM reported in kg. Prospective, longitudinal studies investigating effects of ADT on lean body mass that are included in Table 3B99, 103, 104, 107, 111, 112 were summarized in a recent systematic review that included 261 patients in aggregate and observation periods of 3–24 months.102 Changes in lean mass in these studies ranged between −1.4% and −3.86%, the latter reported in a 24-month study, one of the longest studies of ADT effects on body composition in the literature. The mean change (95% CI) in percent lean mass was −2.82% (−3.64%−2.01%). The right panel of Figure 4 displays annualized differences in percent change from studies with at least 1-year exposure.102 The mean annualized change was −2.0%. These changes typically occurred without significant changes in BMI.
Figure 4.
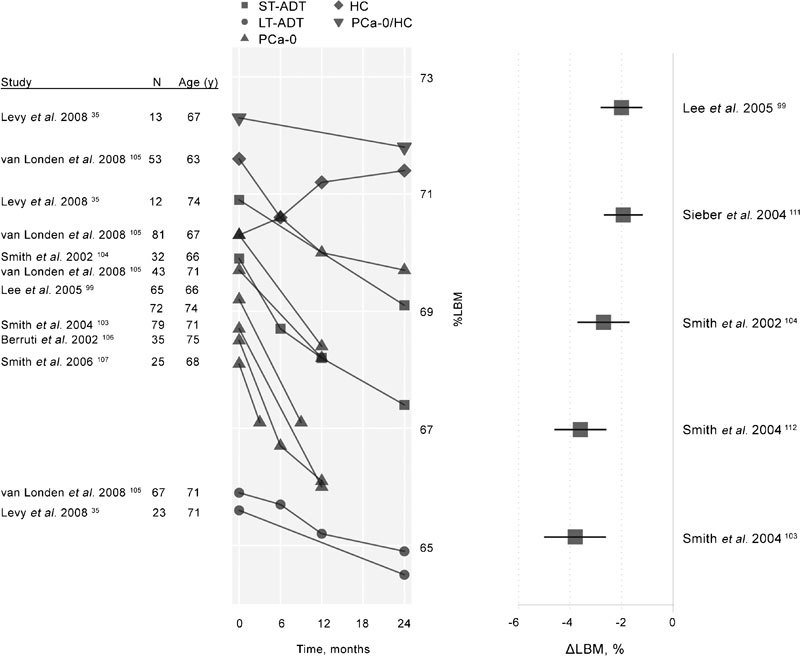
Left: Longitudinal changes in percent LBM among men enrolled in ADT studies. Untreated, healthy control participants are denoted as HC. A single mixed control group of healthy men and men with PCa not treated with ADT (HC/PCa-0) is also displayed. The remaining participants (all with PCa diagnoses and treated with ADT in the studies displayed) are classified according to their history of treatment with ADT prior to the current study. These groups include subjects with short-term (less than 6 months) previous exposure to ADT (ST-ADT groups), longer-term (6 months or longer) previous exposure to ADT (LT-ADT groups), and subjects with no prior history of ADT exposure (PCa-0). Right: Annualized percent change in percent lean body mass among subjects treated with ADT in studies of at least 1-year duration reporting LBM change values, adapted from Haseen et al.102 ADT, androgen deprivation therapy; HC, healthy men; LBM, lean body mass; PCa, prostate cancer.
The left side of Figure 4 displays qualitative changes from baseline in LBM in seven studies conducted over 3–24 months. LBM is seen to fall in all groups especially for men just beginning ADT. The average change from baseline to end of study, regardless of study length, was −1.5% LBM for patients receiving ADT compared with a 0.2% LBM change for HC. A 10-year longitudinal study of change in body composition in healthy older (61±8 year) men found a 1.9% decrease in LBM per decade in the 53 male participants,113 a 10-fold difference when compared with the annualized change in % LBM for men using ADT shown in the right panel of Figure 4.
Overall, theses data show a consistent trend of decreasing lean body mass with increasing ADT exposure consequent to the effects of androgen suppression. Whether this loss of lean mass affects muscle performance (strength, power or muscle fatigability) or physical function in men treated with ADT is yet to be demonstrated, though epidemiologic evidence suggests a potent association between skeletal muscle mass, mobility and physical ability.114 Changes in LBM occur early in the course of ADT suggesting that countermeasures be instituted to minimize the predicable loss of LBM with strategies implemented ideally prior to the onset of ADT.
Relative body fat (% Fat)
Androgen deprivation increases accumulation of fat mass, especially subcutaneous fat, and increases risk of obesity.104, 115 Relative body fat (% Fat) values from cross-sectional and longitudinal studies in men receiving ADT are given in Table 3C and summarized in Figure 5. The right panel of Figure 5 illustrates the annualized percent change in fat mass reported in four prospective, longitudinal studies with at least 1-year exposure to ADT. These studies, reviewed in a recent meta-analysis,102 included patients in a wide range of PCa stages with treatment durations of 3–12 months. All studies showed statistically significant increases in fat mass with an average annualized change of 11.1%. The left panel of Figure 5 illustrates rates of increase in % Fat from the longitudinal studies summarized in Table 3C. Taken together, these data provide clear indications of the effect of ADT on relative body fat at various points in time in exposure to therapy. Relative to men with PCa, healthy, age-matched men, in general, have lower % Fat values at baseline and show only modest increases over 2 years. Unfortunately, the comparative data for HC of similar age presented here are from only two studies. A 10-year study of longitudinal changes in body composition showed that fat mass (underwater weighing) increased 0.7% per year in 53 men averaging 61 years of age.113 This annual increase in fat mass is 16 times lower than the average 11.1% annualized percent change in fat mass for men undergoing androgen suppression therapy illustrated in Figure 5. As with changes in LBM, increases in fat mass with ADT occur as early as within 3 months of starting treatment.
Figure 5.
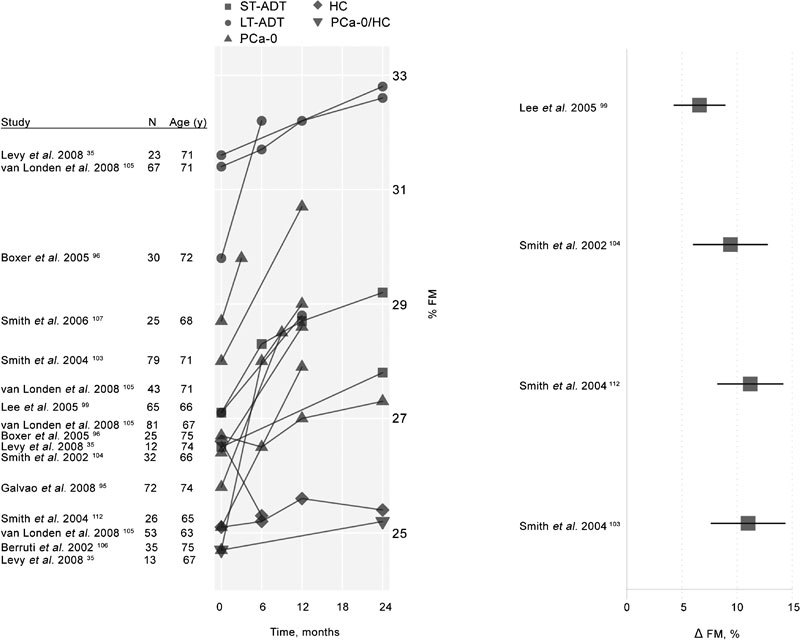
Left: Longitudinal changes in percent FM among men enrolled in ADT studies. Untreated, healthy control participants are denoted as HC. A single mixed control group of healthy men and men with PCa never treated with ADT (HC/PCa-0) is also displayed. The remaining participants (all with PCa diagnoses and treated with ADT in the studies displayed) are classified according to their history of treatment with ADT prior to the current study. These groups include subjects with short-term (less than 6 months) previous exposure to ADT (ST-ADT groups), longer-term (six months or longer) previous exposure to ADT (LT-ADT groups) and subjects with no prior history of ADT exposure (PCa-0). Right: Annualized percent change in percent FM among subjects treated with ADT in studies of at least 1-year duration reporting fat mass change values, adapted from Haseen et al.102 ADT, androgen deprivation therapy; FM, fat mass; HC, healthy men; LBM, lean body mass; PCa, prostate cancer.
Changes with exercise training
The adverse effects of ADT-induced low serum testosterone on body composition and strength are well appreciated and seen as contributors to loss of physical functional and increased levels of fatigue25, 32, 34, 35, 66 with fatigue itself interfering with functional ability and physical activity.116 Fatigue or lack of energy is a highly prevalent side effect of ADT and has been shown to be severe in 14 percent of men after only 3 months of androgen suppression.25 A number of RCT in men with PCa receiving androgen suppression have shown the value of well-designed exercise training programs. These studies have demonstrated significant improvements in muscle performance,37, 92, 117 physical function37, 92, 118, 119 and body composition37, 120 that occurred after as little as 12 weeks of training. Table 4 summarizes the efficacy of exercise training from five RCT, two uncontrolled trials and one small non-randomized pilot study in men undergoing androgen suppression therapy.
Table 4. Summary of studies examining longitudinal changes in measures of muscle strength, physical performance, and body composition in men with prostate cancer treated with androgen deprivation therapy.
| Study | Study design/Duration | Duration of ADT (month) | N | Age (y) | Intensity duration/volume, frequency | Groups | Outcome variables | % change from baseline | P between groups |
|---|---|---|---|---|---|---|---|---|---|
| Segal et al.,117 2003 | RCT | 12 | 82 | 68 | Eight exercises | RT supervised | CP end (rep) | 41%* | 0.009 |
| 12 weeks | 12-RM, two sets, 3 days week−1 | LP end (rep) | 32%* | <0.001 | |||||
| 13 | 73 | 68 | Control | CP end (rep) | −8% | ||||
| LP end (rep) | −4% | ||||||||
| Carmack Taylor et al.,119 2006 | RCT | 32.7 | 35 | 69 | Lifestyle physical activity, moderate intensity. Most day week−1 | Physical activity | 6-MWT | 3% | Not |
| 26 weeks | BMI | −0.3% | significant | ||||||
| Waist circumference | 0.2% | ||||||||
| 44 | Education | 6-MWT | 4% | ||||||
| BMI | 3% | ||||||||
| Waist circumference | 0.8% | ||||||||
| 34 | Usual care | 6-MWT | 4% | ||||||
| 0% | |||||||||
| BMI | 0.3% | ||||||||
| Waist circumference | |||||||||
| Galvao et al.,37 2006 | UC20 weeks | ≥2 | 10 | 70 | 10–12 exercises | RT supervised | 1-RM (kg)a | 79%* | |
| 12-6 RM. 2–4 sets | Muscle end (rep)b | 129%* | |||||||
| 2 days week−1 | 5× chair rise (s) | −27%* | |||||||
| 6-m walk usual (s) | −14%* | ||||||||
| 6-m walk fast (s) | −6% | ||||||||
| 6-m backward (s) | −22%* | ||||||||
| 400-m walk (m s−1) | −7%* | ||||||||
| Stair climb (s) | −10%* | ||||||||
| Lean mass (kg) | −0.4% | ||||||||
| Fat mass (kg) | −0.0% | ||||||||
| % Fat | 0.3% | ||||||||
| Culos-Reed et al.,118 2007 | UC | Not given | 31 | 67 | Intensity, duration, volume not reported | Home-based walking, | 6-MWT (ft) | 11%* | |
| 12 weeks | 3–5 days week−1 | light RT plus biweekly group sessions | BMI | 1%* | |||||
| Hansen et al.,135 2009 | Controlled pilot | Not given | 5 | 66 | Progressive | Eccentric AT supervised | Iso-KE, right | 19%* | Not |
| 12 weeks | RPE 7–13 | Iso-KE, left | 8% | significant | |||||
| 5–20 min | 6-MWT | 9%* | |||||||
| 3 days week−1 | TUG | 14% | |||||||
| Thigh muscle volume, right | 2% | ||||||||
| Thigh muscle volume, left | 0.9% | ||||||||
| PCa-0 | 5 | 67 | Iso-KE, right | 15% | |||||
| Iso-KE, left | -1% | ||||||||
| 6-MWT | 5% | ||||||||
| TUG | 13% | ||||||||
| Thigh muscle volume, right | 2% | ||||||||
| Thigh muscle volume, left | 3%* | ||||||||
| Galvaoet al.,92 2010 | RCT | 18.2 | 29 | 70 | 10–12 exercises | RT and AT supervised | 1-RM (kg)c | 30% | 0.018 |
| 12 weeks | 2–4 sets, 12-6 RM | Muscle end (rep)b | 60% | <0.001 | |||||
| Walk/cycle | 5× chair rise (s) | −9% | 0.074 | ||||||
| 15–20 min | Stair climb | −4% | 0.420 | ||||||
| 65%–80% HRmax | 6-m walk usual (s) | −6% | 0.024 | ||||||
| 11–13 RPE | −8% | 0.187 | |||||||
| 2 days week−1 | 6-m walk fast | ||||||||
| 6-m walk backward | −22% | 0.039 | |||||||
| 400-m walk (m s−1) | −4% | 0.080 | |||||||
| LBM | 1% | 0.047 | |||||||
| FM | −0.9% | 0.964 | |||||||
| % Fat | −1% | 0.366 | |||||||
| 10.1 | 28 | 70 | Control | 1-RM (kg)c | 5% | ||||
| Muscle end (rep)b | 7% | ||||||||
| 5× chair rise (s) | −2% | ||||||||
| 6-m walk usual (s) | −2% | ||||||||
| 6-m walk fast | −2% | ||||||||
| 6-m walk backward | −5% | ||||||||
| 400-m walk (m s−1) | −2% | ||||||||
| LBM | 0% | ||||||||
| FM | 1% | ||||||||
| % Fat | 0.7% | ||||||||
| Culos-Reed et al.,36 (2010) | RCT | ≥9 | 53 | 67 | Intensity, duration, volume not reported3–5 day week−1 | Home-based | 6-MWT (m) | 4% | 0.926 |
| 16 weeks | RT+walking | BMI | −0.8% | 0.225 | |||||
| Waist circumference | −0.5% | 0.044 | |||||||
| 57 | 68 | Control | 6-MWT (m) | 4% | |||||
| BMI | 3% | ||||||||
| Waist circumference | 2% |
Abbreviations: CP, chest press; CP end, repetitions to failure using fixed 20 kg resistance; Iso-KE, isokinetic knee extension; LP, leg press; LP end, repetitions to failure using fixed 40 kg resistance; Muscle end, muscle endurance, repetitions to failure, using 70% baseline 1-RM; P, difference in change from baseline between groups; RM, repetition maximum; 1-RM, maximum amount of weight that can be lifted once; 6-RM, maximum of weight than be lifted six times only.
BMI, waist circumference or sum of four skinfolds; RCT, randomized controlled trial; TUG, timed up-and-go expressed in seconds; FM, fat mass; LBM, lean body mass.
Muscle strength by 1-RM—values are mean changes for chest press and leg press exercises.
Muscle endurance—mean of changes in chest press and leg press exercise.
Muscle strength by 1-RM—mean of changes for chest press, leg press and leg extension exercise.
P<0.05.
Three randomized trials using supervised RT,117 RT or AT,120 and RT plus AT92 for 12–24 weeks have shown significant benefits in avoiding or reversing some of the changes associated with ADT. In one study, 155 men beginning ADT were randomly assigned to 12 weeks of thrice weekly resistance exercise training or no exercise.117 The exercising group had significantly improved upper and lower extremity muscle endurance, and less fatigue and better quality of life scores, but the change between groups for anthropometric and body composition measures were not different. Galvao et al.92 recently reported a 12-week RCT that evaluated the combined effects of RT and AT on comprehensive measures of muscle function, physical performance and body composition in men receiving ADT. After only 12 weeks of training, exercising subjects showed significantly greater changes from baseline than controls for several measures of upper and lower body muscle strength and endurance, 6-m usual gait speed and the 6-m backward walk. Changes between groups for the 400-m and fast 6-m walks, chair rises and stair climb were not significantly different. For measures of body composition, only the 0.8 kg mean difference for LBM change was significantly different between groups. Improvements were also noted for quality of life, and reduced fatigue. There were no adverse events due to assessments or training. In a prior uncontrolled trial of men undergoing ADT, Galvao et al.37 demonstrated substantial improvements in muscle strength, muscle endurance and several measures of physical function after 20 weeks of high intensity RT (Table 4). Although body composition did not change, neither did it deteriorate. The positive outcomes from these comprehensive studies are encouraging.
Home-based exercise interventions using walking, light resistance exercise or cognitive-behavioral approach to increase physical activity have produced mixed results in improving muscle performance, physical function and body composition in men receiving ADT (Table 2).36, 118, 119 One uncontrolled 12-week study requiring 3–5 day week−1 walking and light resistance exercise plus biweekly group sessions showed statistically significant changes in 6-MWT (+12%) and BMI (+1%) in men undergoing ADT.118 The 63-m improvement in 6-MWT is clinically meaningful.50 In a later study by the same group, 6-MWT distance increased by 25 m in the home exercise group and 29 m in the controls. However, initial 6-MWT distances were 650–700 m for these groups, respectively, suggesting relatively high functioning individuals74 and a possible ceiling effect. One RCT evaluated the effectiveness of a 6-month group-based lifestyle physical activity program (Project Active121) in men who had undergone 33 months of continuous ADT.119 An educational support group controlling for group and facilitator support provided in the lifestyle program, and a standard care group were included. After 6 and 12 months of the program, no differences were observed between groups for physical activity, self-reported physical functioning (SF-36), 6-min walk distance or measures of body composition. It is possible that the participant's physical activity was of sufficient intensity to prevent declines in physical function and body composition, but not adequate to show the levels of improvement seen in studies utilizing formalized and more rigorous exercise training. Currently, the dose of physical activity or exercise in men with PCa, especially those undergoing ADT, is unknown. However, the lack of decline in physical function and body composition variables noted above119 suggest that lifestyle guidelines that focus on increasing physical activity might be considered as a minimal dose.
The specific side effects of ADT (e.g., fatigue, muscle atrophy, weight gain, declining physical functional ability), suggest the value of combined resistance and aerobic activities. Largely, supervised exercise training appears to be more effective, but well-designed and monitored home-based physical activity programs may provide fitness benefits while being offered as a more cost-effective option.118 There are no studies to date which have directly compared home versus supervised exercise training in men receiving androgen suppression. However, with the growing use of telehealth approaches,122, 123 home-based exercise training may prove to be a viable solution.
A recent American College of Sports Medicine (ACSM) Expert Panel has provided a consensus statement on exercise guidelines and the safety of exercise for cancer survivors124 organized according to NHLBI classifications of evidence-based research.125 Based on the 12 interventional studies reviewed by the expert panel specifically for men with PCa undergoing ADT and/or radiotherapy, evidence in favor of exercise training safety, improvements in aerobic capacity due to AT and/or RT, improved muscle strength due to RT and improved fatigue was judged to be definitive (‘Category A' assessment). Improvements in at least one variable associated with body composition, physical function and improved measures of quality of life were rated reasonably strong but not overwhelming (‘Category B' assessment).
A systematic review of exercise training in men undergoing androgen suppression provided clear support for the ACSM Expert Panel's findings in reducing the adverse effects of ADT on body composition, muscle performance and physical function.126 As suggested in the ACSM Expert Panel report,124 evidence for change in body composition due to exercise interventions was not as strong perhaps due to the considerable loss of LBM and increased fat mass occurring with ADT.96 Maintenance of LBM and fat mass might therefore be important objectives of an exercise intervention.96, 124, 126
The ACSM Expert Panel advised that exercise prescription recommendations for both AT and RT for men with PCa should follow the 2008 Physical Activity Guidelines for Americans.127 While there were no PCa-specific contraindications for beginning or stopping an exercise program, the panel advised awareness of fracture risk in men with PCa treated with ADT and to use general ACSM guidelines for stopping exercise.128
It is clear that appropriately and judiciously applied exercise training in men with PCa receiving ADT is a valuable adjunct for mitigating many of the adverse events associated with ADT. The field is in need of additional well controlled randomized trials investigating dose–response relationships and the longer-term sustainability of not only benefits derived from exercise training but also continuation of the training itself.
Limitations to this review
We have not implemented a formal meta-analysis or systematic review, but rather a broad literature search. Among the studies examined, disparities in study duration, design and population are tremendous and resist easy summary. These may dramatically affect our understanding of the influence of ADT on men's health and physical capacity. In addition, though some studies have explicitly examined the influence of PCa itself on these outcomes, differentiating the effects of cancer itself from that of its treatment is fraught with difficulty.
The study of the adverse effects of ADT on the outcomes reported is rapidly growing. Larger, randomized controlled trials are needed to better understand these and other adverse effects and thereby develop interventions that will successfully mitigate the negative outcomes of ADT.
Summary and recommendations
Clinicians should obtain baseline values for muscle performance, physical function and body composition in men with PCa beginning ADT or as soon as reasonable during the course of treatment if previous data are not available. Examples of possible assessments and instruments are summarized in Table 5.
Assessment tools should have demonstrated validity and precision94 with consideration of possible ceiling effects, especially in tests of physical function.
Hand grip strength correlates well with other muscle strength tests,29 but caution is advised when considering its use as a surrogate for muscle function of lower extremities when evaluating physical performance.30 Measures of dynamic muscle strength using muscle groups, type of muscle action and movement patterns similar to activities of daily living, may be more logical choices for strength assessments and their relation to body composition and physical performance.26, 37, 92
Performance-based measures of physical function can provide objective assessments of an individual's physical performance. Walking tests and chair stands are easily administered in the clinician's office.
Men who are receiving ADT for PCa should be encouraged to avoid physical inactivity. With consideration of individual disease and treatment adverse effects, the ACSM Expert Panel124 advised implementation of the age-appropriate 2008 Physical Activity Guidelines for Americans127 with a goal of accumulating 150-min activity per week. Guidance from knowledgeable and experienced fitness professionals with training in working with cancer patients may facilitate positive outcomes. A certification program for fitness trainers working with cancer patients is offered by the ACSM (http://certification.acsm.org/acsm-cancer-exercise-trainer).
As appropriate, resistance exercise training should be emphasized for its beneficial effects on LMB, muscle strength and physical function.
Use of telehealth services and physiological sensing systems including triaxial accelerometers and heart rate monitors could be considered aids in improving compliance and program efficacy.
Expert groups should continue to evaluate and recommend methods of exercise training of appropriate type, intensity, duration and frequency for men with PCa, especially those receiving ADT.124
For the researcher, long-term efficacy outcomes from exercise interventions should include measures of morbidity and mortality.
Table 5. Metrics and equipment used to assess muscle function, physical performance and body composition in men with prostate cancer treated with androgen deprivation therapy.
| Measure | Equipment |
|---|---|
| Muscle strength | |
| 1-RM or3-RM | Plate loaded, selectorized or pneumatic weight machines; free weights. Exercises for major muscle groups of upper and lower extremity, e.g., chest/bench press and leg press or leg extension |
| Grip strength | |
| Sum both hands | Hand grip dynamometer |
| Repetitions to failure—70%–80% | Plate loaded, selectorized or pneumatic weight machines; free weights. Exercises for major muscle groups of upper and lower extremity, e.g., chest/bench press and leg press or leg extension |
| 1-RM or 3-RM | |
| Grip endurance | Hand grip dynamometer |
| Repetitions to failure at 50%–70% maximal force OR time to failure while sustaining 50%–50% max force | |
| SPPB | 4-m measured course, armless chair, stopwatch |
| 4-, 6-, 400-m, 6-min walk tests | Accurately measured course, stopwatch or timing system. For 400-m and 6-MWT, at least 20-m per lap |
| Chair stands | Armless chair and stopwatch |
| Timed up-and-go | Armless chair, stopwatch or timing system |
| Stair climb | Staircase and timing system |
| Body mass | Calibrated scale |
| BMI | Calibrated scale and stadiometer |
| Lean mass and fat mass | DEXAa |
| Skeletal muscle mass | DEXAa |
| Appendicular skeletal mass | DEXAa |
| Skin fold thickness | Skinfold calipers |
| Waist circumference | Tape measure |
| Appendicular skeletal mass index (ASM Ht−2) | DEXAa and stadiometer |
| Visceral fat area | DEXAa |
DEXA is the preferred instrument for assessing body composition. If unavailable, BIA may offer a reliable index of change but has greater error in assessing absolute values.
All authors declare that there are no competing financial interests
References
- Stoch SA, Parker RA, Chen L, Bubley G, Ko YJ, et al. Bone loss in men with prostate cancer treated with gonadotropin-releasing hormone agonists. J Clin Endocrinol Metab. 2001;86:2787–91. doi: 10.1210/jcem.86.6.7558. [DOI] [PubMed] [Google Scholar]
- Smith MR. Therapy Insight: osteoporosis during hormone therapy for prostate cancer. Nat Clin Pract Urol. 2005;2:608–15; quiz 28. doi: 10.1038/ncpuro0326. [DOI] [PubMed] [Google Scholar]
- Levine GN, D'Amico AV, Berger P, Clark PE, Eckel RH, et al. Androgen-deprivation therapy in prostate cancer and cardiovascular risk: a science advisory from the American Heart Association, American Cancer Society, and American Urological Association: endorsed by the American Society for Radiation Oncology. Circulation. 2010;121:833–40. doi: 10.1161/CIRCULATIONAHA.109.192695. [DOI] [PMC free article] [PubMed] [Google Scholar]
- Nguyen PL, Je Y, Schutz FA, Hoffman KE, Hu JC, et al. Association of androgen deprivation therapy with cardiovascular death in patients with prostate cancer: a meta-analysis of randomized trials. JAMA. 2011;306:2359–66. doi: 10.1001/jama.2011.1745. [DOI] [PubMed] [Google Scholar]
- Mauras N, Hayes V, Welch S, Rini A, Helgeson K, et al. Testosterone deficiency in young men: marked alterations in whole body protein kinetics, strength, and adiposity. J Clin Endocrinol Metab. 1998;83:1886–92. doi: 10.1210/jcem.83.6.4892. [DOI] [PubMed] [Google Scholar]
- Roy TA, Blackman MR, Harman SM, Tobin JD, Schrager M, et al. Interrelationships of serum testosterone and free testosterone index with FFM and strength in aging men. Am J Physiol Endocrinol Metab. 2002;283:E284–94. doi: 10.1152/ajpendo.00334.2001. [DOI] [PubMed] [Google Scholar]
- Szulc P, Claustrat B, Marchand F, Delmas PD. Increased risk of falls and increased bone resorption in elderly men with partial androgen deficiency: the MINOS study. J Clin Endocrinol Metab. 2003;88:5240–7. doi: 10.1210/jc.2003-030200. [DOI] [PubMed] [Google Scholar]
- van den Beld AW, de Jong FH, Grobbee DE, Pols HA, Lamberts SW. Measures of bioavailable serum testosterone and estradiol and their relationships with muscle strength, bone density, and body composition in elderly men. J Clin Endocrinol Metab. 2000;85:3276–82. doi: 10.1210/jcem.85.9.6825. [DOI] [PubMed] [Google Scholar]
- Grinspoon S, Corcoran C, Lee K, Burrows B, Hubbard J, et al. Loss of lean body and muscle mass correlates with androgen levels in hypogonadal men with acquired immunodeficiency syndrome and wasting. J Clin Endocrinol Metab. 1996;81:4051–8. doi: 10.1210/jcem.81.11.8923860. [DOI] [PubMed] [Google Scholar]
- O'Donnell AB, Travison TG, Harris SS, Tenover JL, McKinlay JB. Testosterone, dehydroepiandrosterone, and physical performance in older men: results from the Massachusetts Male Aging Study. J Clin Endocrinol Metab. 2006;91:425–31. doi: 10.1210/jc.2005-1227. [DOI] [PubMed] [Google Scholar]
- Orwoll E, Lambert LC, Marshall LM, Blank J, Barrett-Connor E, et al. Endogenous testosterone levels, physical performance, and fall risk in older men. Arch Intern Med. 2006;166:2124–31. doi: 10.1001/archinte.166.19.2124. [DOI] [PubMed] [Google Scholar]
- Schaap LA, Pluijm SM, Smit JH, van Schoor NM, Visser M, et al. The association of sex hormone levels with poor mobility, low muscle strength and incidence of falls among older men and women. Clin Endocrinol (Oxf) 2005;63:152–60. doi: 10.1111/j.1365-2265.2005.02315.x. [DOI] [PubMed] [Google Scholar]
- O'Connell MD, Roberts SA, Srinivas-Shankar U, Tajar A, Connolly MJ, et al. Do the effects of testosterone on muscle strength, physical function, body composition, and quality of life persist six months after treatment in intermediate-frail and frail elderly men. J Clin Endocrinol Metab. 2011;96:454–8. doi: 10.1210/jc.2010-1167. [DOI] [PubMed] [Google Scholar]
- Schroeder ET, Zheng L, Yarasheski KE, Qian D, Stewart Y, et al. Treatment with oxandrolone and the durability of effects in older men. J Appl Physiol. 2004;96:1055–62. doi: 10.1152/japplphysiol.00808.2003. [DOI] [PubMed] [Google Scholar]
- Williams MB, Hernandez J, Thompson I. Luteinizing hormone-releasing hormone agonist effects on skeletal muscle: how hormonal therapy in prostate cancer affects muscular strength. J Urol. 2005;173:1067–71. doi: 10.1097/01.ju.0000143193.81585.5c. [DOI] [PubMed] [Google Scholar]
- Hicks GE, Shardell M, Alley DE, Miller RR, Bandinelli S, et al. Absolute strength and loss of strength as predictors of mobility decline in older adults: the InCHIANTI Study. J Gerontol A Biol Sci Med Sci. 2012;67A:66–73. doi: 10.1093/gerona/glr055. [DOI] [PMC free article] [PubMed] [Google Scholar]
- Bohannon RW. Hand-grip dynamometry predicts future outcomes in aging adults. J Geriatr Phys Ther. 2008;31:3–10. doi: 10.1519/00139143-200831010-00002. [DOI] [PubMed] [Google Scholar]
- Humphreys J, de la Maza P, Hirsch S, Barrera G, Gattas V, et al. Muscle strength as a predictor of loss of functional status in hospitalized patients. Nutrition. 2002;18:616–20. doi: 10.1016/s0899-9007(02)00756-6. [DOI] [PubMed] [Google Scholar]
- Sayer AA, Syddall HE, Martin HJ, Dennison EM, Roberts HC, et al. Is grip strength associated with health-related quality of life? Findings from the Hertfordshire Cohort Study. Age Ageing. 2006;35:409–15. doi: 10.1093/ageing/afl024. [DOI] [PubMed] [Google Scholar]
- Al Snih S, Markides KS, Ottenbacher KJ, Raji MA. Hand grip strength and incident ADL disability in elderly Mexican Americans over a seven-year period. Aging Clin Exp Res. 2004;16:481–6. doi: 10.1007/BF03327406. [DOI] [PubMed] [Google Scholar]
- Rantanen T, Avlund K, Suominen H, Schroll M, Frandin K, et al. Muscle strength as a predictor of onset of ADL dependence in people aged 75 years. Aging Clin Exp Res. 2002;14:10–5. [PubMed] [Google Scholar]
- Alibhai SM, Breunis H, Timilshina N, Johnston C, Tomlinson G, et al. Impact of androgen-deprivation therapy on physical function and quality of life in men with nonmetastatic prostate cancer. J Clin Oncol. 2010;28:5038–45. doi: 10.1200/JCO.2010.29.8091. [DOI] [PubMed] [Google Scholar]
- Soyupek F, Soyupek S, Perk H, Ozorak A. Androgen deprivation therapy for prostate cancer: effects on hand function. Urol Oncol. 2008;26:141–6. doi: 10.1016/j.urolonc.2006.12.014. [DOI] [PubMed] [Google Scholar]
- Joly F, Alibhai SM, Galica J, Park A, Yi QL, et al. Impact of androgen deprivation therapy on physical and cognitive function, as well as quality of life of patients with nonmetastatic prostate cancer. J Urol. 2006;176:2443–7. doi: 10.1016/j.juro.2006.07.151. [DOI] [PubMed] [Google Scholar]
- Stone P, Hardy J, Huddart R, A'Hern R, Richards M. Fatigue in patients with prostate cancer receiving hormone therapy. Eur J Cancer. 2000;36:1134–41. doi: 10.1016/s0959-8049(00)00084-8. [DOI] [PubMed] [Google Scholar]
- Basaria S, Lieb J 2 nd, Tang AM, DeWeese T, Carducci M, et al. Long-term effects of androgen deprivation therapy in prostate cancer patients. Clin Endocrinol (Oxf) 2002;56:779–86. doi: 10.1046/j.1365-2265.2002.01551.x. [DOI] [PubMed] [Google Scholar]
- Bean JF, Kiely DK, Leveille SG, Herman S, Huynh C, et al. The 6-minute walk test in mobility-limited elders: what is being measured. J Gerontol A Biol Sci Med Sci. 2002;57:M751–6. doi: 10.1093/gerona/57.11.m751. [DOI] [PubMed] [Google Scholar]
- Alibhai SM, Gogov S, Allibhai Z. Long-term side effects of androgen deprivation therapy in men with non-metastatic prostate cancer: a systematic literature review. Crit Rev Oncol Hematol. 2006;60:201–15. doi: 10.1016/j.critrevonc.2006.06.006. [DOI] [PubMed] [Google Scholar]
- Tornvall G.Assessment of physical capabilities with special reference to the evaluation of maximal voluntary isometric muscle strength and maximal working capacity. Acta Physiol Scand 58: Suppl. 201.
- Kuh D, Bassey EJ, Butterworth S, Hardy R, Wadsworth ME. Grip strength, postural control, and functional leg power in a representative cohort of British men and women: associations with physical activity, health status, and socioeconomic conditions. J Gerontol A Biol Sci Med Sci. 2005;60:224–31. doi: 10.1093/gerona/60.2.224. [DOI] [PubMed] [Google Scholar]
- Guralnik JM, Simonsick EM, Ferrucci L, Glynn RJ, Berkman LF, et al. A short physical performance battery assessing lower extremity function: association with self-reported disability and prediction of mortality and nursing home admission. J Gerontol. 1994;49:M85–94. doi: 10.1093/geronj/49.2.m85. [DOI] [PubMed] [Google Scholar]
- Bylow K, Dale W, Mustian K, Stadler WM, Rodin M, et al. Falls and physical performance deficits in older patients with prostate cancer undergoing androgen deprivation therapy. Urology. 2008;72:422–7. doi: 10.1016/j.urology.2008.03.032. [DOI] [PMC free article] [PubMed] [Google Scholar]
- Bylow K, Hemmerich J, Mohile SG, Stadler WM, Sajid S, et al. Obese frailty, physical performance deficits, and falls in older men with biochemical recurrence of prostate cancer on androgen deprivation therapy: a case-control study. Urology. 2011;77:934–40. doi: 10.1016/j.urology.2010.11.024. [DOI] [PMC free article] [PubMed] [Google Scholar]
- Clay CA, Perera S, Wagner JM, Miller ME, Nelson JB, et al. Physical function in men with prostate cancer on androgen deprivation therapy. Phys Ther. 2007;87:1325–33. doi: 10.2522/ptj.20060302. [DOI] [PubMed] [Google Scholar]
- Levy ME, Perera S, van Londen GJ, Nelson JB, Clay CA, et al. Physical function changes in prostate cancer patients on androgen deprivation therapy: a 2-year prospective study. Urology. 2008;71:735–9. doi: 10.1016/j.urology.2007.09.018. [DOI] [PubMed] [Google Scholar]
- Culos-Reed SN, Robinson JW, Lau H, Stephenson L, Keats M, et al. Physical activity for men receiving androgen deprivation therapy for prostate cancer: benefits from a 16-week intervention. Support Care Cancer. 2010;18:591–9. doi: 10.1007/s00520-009-0694-3. [DOI] [PubMed] [Google Scholar]
- Galvao DA, Nosaka K, Taaffe DR, Spry N, Kristjanson LJ, et al. Resistance training and reduction of treatment side effects in prostate cancer patients. Med Sci Sports Exerc. 2006;38:2045–52. doi: 10.1249/01.mss.0000233803.48691.8b. [DOI] [PubMed] [Google Scholar]
- ATS statement: guidelines for the six-minute walk test. . Am J Respir Crit Care Med. 2002;166:111–7. doi: 10.1164/ajrccm.166.1.at1102. [DOI] [PubMed] [Google Scholar]
- Podsiadlo D, Richardson S. The timed ‘Up & Go': a test of basic functional mobility for frail elderly persons. J Am Geriatr Soc. 1991;39:142–8. doi: 10.1111/j.1532-5415.1991.tb01616.x. [DOI] [PubMed] [Google Scholar]
- Sayers SP, Guralnik JM, Newman AB, Brach JS, Fielding RA. Concordance and discordance between two measures of lower extremity function: 400 meter self-paced walk and SPPB. Aging Clin Exp Res. 2006;18:100–6. doi: 10.1007/BF03327424. [DOI] [PubMed] [Google Scholar]
- Vasunilashorn S, Coppin AK, Patel KV, Lauretani F, Ferrucci L, et al. Use of the Short Physical Performance Battery Score to predict loss of ability to walk 400 meters: analysis from the InCHIANTI study. J Gerontol A Biol Sci Med Sci. 2009;64:223–9. doi: 10.1093/gerona/gln022. [DOI] [PMC free article] [PubMed] [Google Scholar]
- Ferrucci L, Penninx BW, Leveille SG, Corti MC, Pahor M, et al. Characteristics of nondisabled older persons who perform poorly in objective tests of lower extremity function. J Am Geriatr Soc. 2000;48:1102–10. doi: 10.1111/j.1532-5415.2000.tb04787.x. [DOI] [PubMed] [Google Scholar]
- Guralnik JM, Ferrucci L, Pieper CF, Leveille SG, Markides KS, et al. Lower extremity function and subsequent disability: consistency across studies, predictive models, and value of gait speed alone compared with the short physical performance battery. J Gerontol A Biol Sci Med Sci. 2000;55:M221–31. doi: 10.1093/gerona/55.4.m221. [DOI] [PMC free article] [PubMed] [Google Scholar]
- Guralnik JM, Ferrucci L, Simonsick EM, Salive ME, Wallace RB. Lower-extremity function in persons over the age of 70 years as a predictor of subsequent disability. N Engl J Med. 1995;332:556–61. doi: 10.1056/NEJM199503023320902. [DOI] [PMC free article] [PubMed] [Google Scholar]
- Penninx BW, Ferrucci L, Leveille SG, Rantanen T, Pahor M, et al. Lower extremity performance in nondisabled older persons as a predictor of subsequent hospitalization. J Gerontol A Biol Sci Med Sci. 2000;55:M691–7. doi: 10.1093/gerona/55.11.m691. [DOI] [PubMed] [Google Scholar]
- Perera S, Studenski S, Chandler JM, Guralnik JM. Magnitude and patterns of decline in health and function in 1 year affect subsequent 5-year survival. J Gerontol A Biol Sci Med Sci. 2005;60:894–900. doi: 10.1093/gerona/60.7.894. [DOI] [PubMed] [Google Scholar]
- Volpato S, Cavalieri M, Sioulis F, Guerra G, Maraldi C, et al. Predictive value of the Short Physical Performance Battery following hospitalization in older patients. J Gerontol A Biol Sci Med Sci. 2011;66:89–96. doi: 10.1093/gerona/glq167. [DOI] [PMC free article] [PubMed] [Google Scholar]
- Cesari M, Onder G, Zamboni V, Manini T, Shorr RI, et al. Physical function and self-rated health status as predictors of mortality: results from longitudinal analysis in the ilSIRENTE study. BMC Geriatr. 2008;8:34. doi: 10.1186/1471-2318-8-34. [DOI] [PMC free article] [PubMed] [Google Scholar]
- Kwon S, Perera S, Pahor M, Katula JA, King AC, et al. What is a meaningful change in physical performance? Findings from a clinical trial in older adults (the LIFE-P study) J Nutr Health Aging. 2009;13:538–44. doi: 10.1007/s12603-009-0104-z. [DOI] [PMC free article] [PubMed] [Google Scholar]
- Perera S, Mody SH, Woodman RC, Studenski SA. Meaningful change and responsiveness in common physical performance measures in older adults. J Am Geriatr Soc. 2006;54:743–9. doi: 10.1111/j.1532-5415.2006.00701.x. [DOI] [PubMed] [Google Scholar]
- Abellan van Kan G, Rolland Y, Andrieu S, Bauer J, Beauchet O, et al. Gait speed at usual pace as a predictor of adverse outcomes in community-dwelling older people: an International Academy on Nutrition and Aging (IANA) Task Force. J Nutr Health Aging. 2009;13:881–9. doi: 10.1007/s12603-009-0246-z. [DOI] [PubMed] [Google Scholar]
- Cesari M, Kritchevsky SB, Penninx BW, Nicklas BJ, Simonsick EM, et al. Prognostic value of usual gait speed in well-functioning older people—results from the Health, Aging and Body Composition Study. J Am Geriatr Soc. 2005;53:1675–80. doi: 10.1111/j.1532-5415.2005.53501.x. [DOI] [PubMed] [Google Scholar]
- Hall WJ. Update in geriatrics. Ann Intern Med. 2006;145:538–43. doi: 10.7326/0003-4819-145-7-200610030-00012. [DOI] [PubMed] [Google Scholar]
- Manty M, Mendes de Leon CF, Rantanen T, Era P, Pedersen AN, et al. Mobility-related fatigue, walking speed, and muscle strength in older people J Gerontol A Biol Sci Med Sci 2011. e-pub ahead of print 19 October doi: 10.1093/gerona/glr183. [DOI] [PubMed]
- Ostir GV, Kuo YF, Berges IM, Markides KS, Ottenbacher KJ. Measures of lower body function and risk of mortality over 7 years of follow-up. Am J Epidemiol. 2007;166:599–605. doi: 10.1093/aje/kwm121. [DOI] [PubMed] [Google Scholar]
- Woo J, Ho SC, Yu AL. Walking speed and stride length predicts 36 months dependency, mortality, and institutionalization in Chinese aged 70 and older. J Am Geriatr Soc. 1999;47:1257–60. doi: 10.1111/j.1532-5415.1999.tb05209.x. [DOI] [PubMed] [Google Scholar]
- Hardy SE, Perera S, Roumani YF, Chandler JM, Studenski SA. Improvement in usual gait speed predicts better survival in older adults. J Am Geriatr Soc. 2007;55:1727–34. doi: 10.1111/j.1532-5415.2007.01413.x. [DOI] [PubMed] [Google Scholar]
- Studenski S, Perera S, Patel K, Rosano C, Faulkner K, et al. Gait speed and survival in older adults. JAMA. 2011;305:50–8. doi: 10.1001/jama.2010.1923. [DOI] [PMC free article] [PubMed] [Google Scholar]
- Studenski S, Perera S, Wallace D, Chandler JM, Duncan PW, et al. Physical performance measures in the clinical setting. J Am Geriatr Soc. 2003;51:314–22. doi: 10.1046/j.1532-5415.2003.51104.x. [DOI] [PubMed] [Google Scholar]
- Butland RJ, Pang J, Gross ER, Woodcock AA, Geddes DM. Two-, six-, and 12-minute walking tests in respiratory disease. Br Med J (Clin Res Ed) 1982;284:1607–8. doi: 10.1136/bmj.284.6329.1607. [DOI] [PMC free article] [PubMed] [Google Scholar]
- Enfield K, Gammon S, Floyd J, Falt C, Patrie J, et al. Six-minute walk distance in patients with severe end-stage COPD: association with survival after inpatient pulmonary rehabilitation. J Cardiopulm Rehabil Prev. 2010;30:195–202. doi: 10.1097/HCR.0b013e3181c565e4. [DOI] [PMC free article] [PubMed] [Google Scholar]
- Gayda M, Temfemo A, Choquet D, Ahmaidi S. Cardiorespiratory requirements and reproducibility of the six-minute walk test in elderly patients with coronary artery disease. Arch Phys Med Rehabil. 2004;85:1538–43. doi: 10.1016/j.apmr.2003.11.037. [DOI] [PubMed] [Google Scholar]
- Kervio G, Carre F, Ville NS. Reliability and intensity of the six-minute walk test in healthy elderly subjects. Med Sci Sports Exerc. 2003;35:169–74. doi: 10.1097/00005768-200301000-00025. [DOI] [PubMed] [Google Scholar]
- Olsson LG, Swedberg K, Clark AL, Witte KK, Cleland JG. Six minute corridor walk test as an outcome measure for the assessment of treatment in randomized, blinded intervention trials of chronic heart failure: a systematic review. Eur Heart J. 2005;26:778–93. doi: 10.1093/eurheartj/ehi162. [DOI] [PubMed] [Google Scholar]
- Troosters T, Gosselink R, Decramer M. Six minute walking distance in healthy elderly subjects. Eur Respir J. 1999;14:270–4. doi: 10.1034/j.1399-3003.1999.14b06.x. [DOI] [PubMed] [Google Scholar]
- Galvao DA, Taaffe DR, Spry N, Joseph D, Turner D, et al. Reduced muscle strength and functional performance in men with prostate cancer undergoing androgen suppression: a comprehensive cross-sectional investigation. Prostate Cancer Prostatic Dis. 2009;12:198–203. doi: 10.1038/pcan.2008.51. [DOI] [PubMed] [Google Scholar]
- Taaffe DR, Duret C, Wheeler S, Marcus R. Once-weekly resistance exercise improves muscle strength and neuromuscular performance in older adults. J Am Geriatr Soc. 1999;47:1208–14. doi: 10.1111/j.1532-5415.1999.tb05201.x. [DOI] [PubMed] [Google Scholar]
- Camarri B, Eastwood PR, Cecins NM, Thompson PJ, Jenkins S. Six minute walk distance in healthy subjects aged 55–75 years. Respir Med. 2006;100:658–65. doi: 10.1016/j.rmed.2005.08.003. [DOI] [PubMed] [Google Scholar]
- Lucas C, Stevenson LW, Johnson W, Hartley H, Hamilton MA, et al. The 6-min walk and peak oxygen consumption in advanced heart failure: aerobic capacity and survival. Am Heart J. 1999;138:618–24. doi: 10.1016/s0002-8703(99)70174-2. [DOI] [PubMed] [Google Scholar]
- Ross RM, Murthy JN, Wollak ID, Jackson AS. The six minute walk test accurately estimates mean peak oxygen uptake. BMC Pulm Med. 2010;10:31. doi: 10.1186/1471-2466-10-31. [DOI] [PMC free article] [PubMed] [Google Scholar]
- Simonsick EM, Newman AB, Nevitt MC, Kritchevsky SB, Ferrucci L, et al. Measuring higher level physical function in well-functioning older adults: expanding familiar approaches in the Health ABC study. J Gerontol A Biol Sci Med Sci. 2001;56:M644–9. doi: 10.1093/gerona/56.10.m644. [DOI] [PubMed] [Google Scholar]
- Spruit MA, Polkey MI, Celli B, Edwards LD, Watkins ML, et al. Predicting outcomes from 6-minute walk distance in chronic obstructive pulmonary disease J Am Med Dir Assoc 2011. e-pub ahead of print 21 June doi: 10.1016/j.jamda.2011.06.009. [DOI] [PubMed]
- Swerts PM, Mostert R, Wouters EF. Comparison of corridor and treadmill walking in patients with severe chronic obstructive pulmonary disease. Phys Ther. 1990;70:439–42. doi: 10.1093/ptj/70.7.439. [DOI] [PubMed] [Google Scholar]
- Enright PL, Sherrill DL. Reference equations for the six-minute walk in healthy adults. Am J Respir Crit Care Med. 1998;158:1384–7. doi: 10.1164/ajrccm.158.5.9710086. [DOI] [PubMed] [Google Scholar]
- Steffen TM, Hacker TA, Mollinger L. Age- and gender-related test performance in community-dwelling elderly people: Six-Minute Walk Test, Berg Balance Scale, Timed Up & Go Test, and gait speeds. Phys Ther. 2002;82:128–37. doi: 10.1093/ptj/82.2.128. [DOI] [PubMed] [Google Scholar]
- Teramoto S, Ohga E, Ishii T, Yamaguchi Y, Yamamoto H, et al. Reference value of six-minute walking distance in healthy middle-aged and older subjects. Eur Respir J. 2000;15:1132–3. doi: 10.1034/j.1399-3003.2000.01525.x. [DOI] [PubMed] [Google Scholar]
- Casaburi R. Factors determining constant work rate exercise tolerance in COPD and their role in dictating the minimal clinically important difference in response to interventions. COPD. 2005;2:131–6. doi: 10.1081/copd-200050576. [DOI] [PubMed] [Google Scholar]
- du Bois RM, Weycker D, Albera C, Bradford WZ, Costabel U, et al. Six-minute-walk test in idiopathic pulmonary fibrosis: test validation and minimal clinically important difference. Am J Respir Crit Care Med. 2011;183:1231–7. doi: 10.1164/rccm.201007-1179OC. [DOI] [PubMed] [Google Scholar]
- Laviolette L, Bourbeau J, Bernard S, Lacasse Y, Pepin V, et al. Assessing the impact of pulmonary rehabilitation on functional status in COPD. Thorax. 2008;63:115–21. doi: 10.1136/thx.2006.076844. [DOI] [PubMed] [Google Scholar]
- Puhan MA, Mador MJ, Held U, Goldstein R, Guyatt GH, et al. Interpretation of treatment changes in 6-minute walk distance in patients with COPD. Eur Respir J. 2008;32:637–43. doi: 10.1183/09031936.00140507. [DOI] [PubMed] [Google Scholar]
- Canuto FF, Rocco CC, de Andrade DV, Sampaio LM, Oliveira CS, et al. Neurophysiological comparison between the Sit-to-Stand test with the 6-Minute Walk test in individuals with COPD. Electromyogr Clin Neurophysiol. 2010;50:47–53. [PubMed] [Google Scholar]
- Simonsick EM, Montgomery PS, Newman AB, Bauer DC, Harris T. Measuring fitness in healthy older adults: the Health ABC Long Distance Corridor Walk. J Am Geriatr Soc. 2001;49:1544–8. doi: 10.1046/j.1532-5415.2001.4911247.x. [DOI] [PubMed] [Google Scholar]
- Pettee Gabriel KK, Rankin RL, Lee C, Charlton ME, Swan PD, et al. Test–retest reliability and validity of the 400-meter walk test in healthy, middle-aged women. J Phys Act Health. 2010;7:649–57. doi: 10.1123/jpah.7.5.649. [DOI] [PubMed] [Google Scholar]
- Marsh AP, Miller ME, Saikin AM, Rejeski WJ, Hu N, et al. Lower extremity strength and power are associated with 400-meter walk time in older adults: the InCHIANTI study. J Gerontol A Biol Sci Med Sci. 2006;61:1186–93. doi: 10.1093/gerona/61.11.1186. [DOI] [PMC free article] [PubMed] [Google Scholar]
- Simonsick EM, Newman AB, Visser M, Goodpaster B, Kritchevsky SB, et al. Mobility limitation in self-described well-functioning older adults: importance of endurance walk testing. J Gerontol A Biol Sci Med Sci. 2008;63:841–7. doi: 10.1093/gerona/63.8.841. [DOI] [PMC free article] [PubMed] [Google Scholar]
- Klepin HD, Geiger AM, Tooze JA, Newman AB, Colbert LH, et al. Physical performance and subsequent disability and survival in older adults with malignancy: results from the health, aging and body composition study. J Am Geriatr Soc. 2010;58:76–82. doi: 10.1111/j.1532-5415.2009.02620.x. [DOI] [PMC free article] [PubMed] [Google Scholar]
- Newman AB, Simonsick EM, Naydeck BL, Boudreau RM, Kritchevsky SB, et al. Association of long-distance corridor walk performance with mortality, cardiovascular disease, mobility limitation, and disability. JAMA. 2006;295:2018–26. doi: 10.1001/jama.295.17.2018. [DOI] [PubMed] [Google Scholar]
- Singer RB. Mortality in active adults age 70–79 years in relation to performance in a long-distance corridor walk. J Insur Med. 2009;41:45–8. [PubMed] [Google Scholar]
- Vestergaard S, Patel KV, Bandinelli S, Ferrucci L, Guralnik JM. Characteristics of 400-meter walk test performance and subsequent mortality in older adults. Rejuvenation Res. 2009;12:177–84. doi: 10.1089/rej.2009.0853. [DOI] [PMC free article] [PubMed] [Google Scholar]
- Bohannon RW. Reference values for the timed up and go test: a descriptive meta-analysis. J Geriatr Phys Ther. 2006;29:64–8. doi: 10.1519/00139143-200608000-00004. [DOI] [PubMed] [Google Scholar]
- Storer TW, Woodhouse L, Magliano L, Singh AB, Dzekov C, et al. Changes in muscle mass, muscle strength, and power but not physical function are related to testosterone dose in healthy older men. J Am Geriatr Soc. 2008;56:1991–9. doi: 10.1111/j.1532-5415.2008.01927.x. [DOI] [PMC free article] [PubMed] [Google Scholar]
- Galvao DA, Taaffe DR, Spry N, Joseph D, Newton RU. Combined resistance and aerobic exercise program reverses muscle loss in men undergoing androgen suppression therapy for prostate cancer without bone metastases: a randomized controlled trial. J Clin Oncol. 2010;28:340–7. doi: 10.1200/JCO.2009.23.2488. [DOI] [PubMed] [Google Scholar]
- Travison TG, Basaria S, Storer TW, Jette AM, Miciek R, et al. Clinical meaningfulness of the changes in muscle performance and physical function associated with testosterone administration in older men with mobility limitation. J Gerontol A Biol Sci Med Sci. 2011;66:1090–9. doi: 10.1093/gerona/glr100. [DOI] [PMC free article] [PubMed] [Google Scholar]
- LeBrasseur NK, Bhasin S, Miciek R, Storer TW. Tests of muscle strength and physical function: reliability and discrimination of performance in younger and older men and older men with mobility limitations. J Am Geriatr Soc. 2008;56:2118–23. doi: 10.1111/j.1532-5415.2008.01953.x. [DOI] [PMC free article] [PubMed] [Google Scholar]
- Galvao DA, Spry NA, Taaffe DR, Newton RU, Stanley J, et al. Changes in muscle, fat and bone mass after 36 weeks of maximal androgen blockade for prostate cancer. BJU Int. 2008;102:44–7. doi: 10.1111/j.1464-410X.2008.07539.x. [DOI] [PubMed] [Google Scholar]
- Boxer RS, Kenny AM, Dowsett R, Taxel P. The effect of 6 months of androgen deprivation therapy on muscle and fat mass in older men with localized prostate cancer. Aging Male. 2005;8:207–12. doi: 10.1080/13685530500361226. [DOI] [PubMed] [Google Scholar]
- Beehler GP, Wade M, Kim B, Steinbrenner L, Wray LO. Longitudinal assessment of BMI in relation to ADT use among early stage prostate cancer survivors. J Cancer Surviv. 2009;3:233–40. doi: 10.1007/s11764-009-0099-9. [DOI] [PubMed] [Google Scholar]
- Kim HS, Moreira DM, Smith MR, Presti JC, Jr, Aronson WJ, et al. A natural history of weight change in men with prostate cancer on androgen-deprivation therapy (ADT): results from the Shared Equal Access Regional Cancer Hospital (SEARCH) database. BJU Int. 2011;107:924–8. doi: 10.1111/j.1464-410X.2010.09679.x. [DOI] [PMC free article] [PubMed] [Google Scholar]
- Lee H, McGovern K, Finkelstein JS, Smith MR. Changes in bone mineral density and body composition during initial and long-term gonadotropin-releasing hormone agonist treatment for prostate carcinoma. Cancer. 2005;104:1633–7. doi: 10.1002/cncr.21381. [DOI] [PubMed] [Google Scholar]
- Smith MR, Lee H, McGovern F, Fallon MA, Goode M, et al. Metabolic changes during gonadotropin-releasing hormone agonist therapy for prostate cancer: differences from the classic metabolic syndrome. Cancer. 2008;112:2188–94. doi: 10.1002/cncr.23440. [DOI] [PMC free article] [PubMed] [Google Scholar]
- Chen Z, Maricic M, Nguyen P, Ahmann FR, Bruhn R, et al. Low bone density and high percentage of body fat among men who were treated with androgen deprivation therapy for prostate carcinoma. Cancer. 2002;95:2136–44. doi: 10.1002/cncr.10967. [DOI] [PubMed] [Google Scholar]
- Haseen F, Murray LJ, Cardwell CR, O'Sullivan JM, Cantwell MM. The effect of androgen deprivation therapy on body composition in men with prostate cancer: systematic review and meta-analysis. J Cancer Surviv. 2010;4:128–39. doi: 10.1007/s11764-009-0114-1. [DOI] [PubMed] [Google Scholar]
- Smith MR. Changes in fat and lean body mass during androgen-deprivation therapy for prostate cancer. Urology. 2004;63:742–5. doi: 10.1016/j.urology.2003.10.063. [DOI] [PubMed] [Google Scholar]
- Smith MR, Finkelstein JS, McGovern FJ, Zietman AL, Fallon MA, et al. Changes in body composition during androgen deprivation therapy for prostate cancer. J Clin Endocrinol Metab. 2002;87:599–603. doi: 10.1210/jcem.87.2.8299. [DOI] [PubMed] [Google Scholar]
- van Londen GJ, Levy ME, Perera S, Nelson JB, Greenspan SL. Body composition changes during androgen deprivation therapy for prostate cancer: a 2-year prospective study. Crit Rev Oncol Hematol. 2008;68:172–7. doi: 10.1016/j.critrevonc.2008.06.006. [DOI] [PMC free article] [PubMed] [Google Scholar]
- Berruti A, Dogliotti L, Terrone C, Cerutti S, Isaia G, et al. Changes in bone mineral density, lean body mass and fat content as measured by dual energy X-ray absorptiometry in patients with prostate cancer without apparent bone metastases given androgen deprivation therapy. J Urol. 2002;167:2361–7; discussion 7. [PubMed] [Google Scholar]
- Smith MR, Lee H, Nathan DM. Insulin sensitivity during combined androgen blockade for prostate cancer. J Clin Endocrinol Metab. 2006;91:1305–8. doi: 10.1210/jc.2005-2507. [DOI] [PubMed] [Google Scholar]
- Alberga AS, Segal RJ, Reid RD, Scott CG, Sigal RJ, et al. Age and androgen-deprivation therapy on exercise outcomes in men with prostate cancer Support Care Cancer 2011. e-pub ahead of print 3 May doi: 10.1007/s00520-011-1169-x. [DOI] [PubMed]
- Dacal K, Sereika SM, Greenspan SL. Quality of life in prostate cancer patients taking androgen deprivation therapy. J Am Geriatr Soc. 2006;54:85–90. doi: 10.1111/j.1532-5415.2005.00567.x. [DOI] [PubMed] [Google Scholar]
- Maturo G, Vespasiani G, Mohamed EI, Maiolo C, Finazzi Agro E, et al. Evaluating body composition of Italian prostate cancer patients without metastases Acta Diabetol02003Suppl 1S168–70. [DOI] [PubMed]
- Sieber PR, Keiller DL, Kahnoski RJ, Gallo J, McFadden S. Bicalutamide 150 mg maintains bone mineral density during monotherapy for localized or locally advanced prostate cancer. J Urol. 2004;171:2272–6, quiz 2435. doi: 10.1097/01.ju.0000127738.94221.da. [DOI] [PubMed] [Google Scholar]
- Smith MR, Goode M, Zietman AL, McGovern FJ, Lee H, et al. Bicalutamide monotherapy versus leuprolide monotherapy for prostate cancer: effects on bone mineral density and body composition. J Clin Oncol. 2004;22:2546–53. doi: 10.1200/JCO.2004.01.174. [DOI] [PubMed] [Google Scholar]
- Hughes VA, Frontera WR, Roubenoff R, Evans WJ, Singh MA. Longitudinal changes in body composition in older men and women: role of body weight change and physical activity. Am J Clin Nutr. 2002;76:473–81. doi: 10.1093/ajcn/76.2.473. [DOI] [PubMed] [Google Scholar]
- Janssen I, Heymsfield SB, Ross R. Low relative skeletal muscle mass (sarcopenia) in older persons is associated with functional impairment and physical disability. J Am Geriatr Soc. 2002;50:889–96. doi: 10.1046/j.1532-5415.2002.50216.x. [DOI] [PubMed] [Google Scholar]
- Saylor PJ, Smith MR. Metabolic complications of androgen deprivation therapy for prostate cancer. J Urol. 2006;181:1998–2006; discussion 2007–8. doi: 10.1016/j.juro.2009.01.047. [DOI] [PMC free article] [PubMed] [Google Scholar]
- Thorsen L, Courneya KS, Stevinson C, Fossa SD. A systematic review of physical activity in prostate cancer survivors: outcomes, prevalence, and determinants. Support Care Cancer. 2008;16:987–97. doi: 10.1007/s00520-008-0411-7. [DOI] [PubMed] [Google Scholar]
- Segal RJ, Reid RD, Courneya KS, Malone SC, Parliament MB, et al. Resistance exercise in men receiving androgen deprivation therapy for prostate cancer. J Clin Oncol. 2003;21:1653–9. doi: 10.1200/JCO.2003.09.534. [DOI] [PubMed] [Google Scholar]
- Culos-Reed SN, Robinson JL, Lau H, O'Connor K, Keats MR. Benefits of a physical activity intervention for men with prostate cancer. J Sport Exerc Psychol. 2007;29:118–27. doi: 10.1123/jsep.29.1.118. [DOI] [PubMed] [Google Scholar]
- Carmack Taylor CL, Demoor C, Smith MA, Dunn AL, Basen-Engquist K, et al. Active for Life After Cancer: a randomized trial examining a lifestyle physical activity program for prostate cancer patients. Psychooncology. 2006;15:847–62. doi: 10.1002/pon.1023. [DOI] [PubMed] [Google Scholar]
- Segal RJ, Reid RD, Courneya KS, Sigal RJ, Kenny GP, et al. Randomized controlled trial of resistance or aerobic exercise in men receiving radiation therapy for prostate cancer. J Clin Oncol. 2009;27:344–51. doi: 10.1200/JCO.2007.15.4963. [DOI] [PubMed] [Google Scholar]
- Dunn AL, Garcia ME, Marcus BH, Kampert JB, Kohl HW, et al. Six-month physical activity and fitness changes in Project Active, a randomized trial. Med Sci Sports Exerc. 1998;30:1076–83. doi: 10.1097/00005768-199807000-00009. [DOI] [PubMed] [Google Scholar]
- Dalleck LC, Schmidt LK, Lueker R. Cardiac rehabilitation outcomes in a conventional versus telemedicine-based programme. J Telemed Telecare. 2011;17:217–21. doi: 10.1258/jtt.2010.100407. [DOI] [PubMed] [Google Scholar]
- Sparrow D, Gottlieb DJ, Demolles D, Fielding RA. Increases in muscle strength and balance using a resistance training program administered via a telecommunications system in older adults. J Gerontol A Biol Sci Med Sci. 2011;66:1251–7. doi: 10.1093/gerona/glr138. [DOI] [PMC free article] [PubMed] [Google Scholar]
- Schmitz KH, Courneya KS, Matthews C, Demark-Wahnefried W, Galvao DA, et al. American College of Sports Medicine roundtable on exercise guidelines for cancer survivors. Med Sci Sports Exerc. 2010;42:1409–26. doi: 10.1249/MSS.0b013e3181e0c112. [DOI] [PubMed] [Google Scholar]
- Clinical Guidelines on the Identification, Evaluation, and Treatment of Overweight and Obesity in Adults—The Evidence Report. National Institutes of Health. Obes Res. 1998. pp. 51S–209S. [PubMed]
- Keogh JW, Macleod RD. Body composition, physical fitness, functional performance, quality of life, and fatigue benefits of exercise for prostate cancer patients: a systematic review. J Pain Symptom Manage. 2012;43:96–110. doi: 10.1016/j.jpainsymman.2011.03.006. [DOI] [PubMed] [Google Scholar]
- Activity Guidelines Advisory Committee Report . Washington DC; US Department of Health and Human Services; 2008. [Google Scholar]
- Thompson WR. ACSM's Guidelines for Exercise Testing and Prescription. Philadelphia, PA; Wolters Kluwer/Lippincott Williams & Wilkins; 2010; [Google Scholar]
- Smith MR. Osteoporosis and obesity in men receiving hormone therapy for prostate cancer. J Urol. 2004;172:S52–6; discussion S6–7. doi: 10.1097/01.ju.0000141820.17959.2f. [DOI] [PubMed] [Google Scholar]
- Denti L, Pasolini G, Cortellini P, Ferretti S, Sanfelici L, et al. Effects of androgen suppression by gonadotropin-releasing hormone agonist and flutamide on lipid metabolism in men with prostate cancer: focus on lipoprotein(a) Clin Chem. 1996;42:1176–81. [PubMed] [Google Scholar]
- Tayek JA, Heber D, Byerley LO, Steiner B, Rajfer J, et al. Nutritional and metabolic effects of gonadotropin-releasing hormone agonist treatment for prostate cancer. Metabolism. 1990;39:1314–9. doi: 10.1016/0026-0495(90)90190-n. [DOI] [PubMed] [Google Scholar]
- Nowicki M, Bryc W, Kokot F. Hormonal regulation of appetite and body mass in patients with advanced prostate cancer treated with combined androgen blockade. J Endocrinol Invest. 2001;24:31–6. doi: 10.1007/BF03343805. [DOI] [PubMed] [Google Scholar]
- Ryan CW, Huo D, Stallings JW, Davis RL, Beer TM, et al. Lifestyle factors and duration of androgen deprivation affect bone mineral density of patients with prostate cancer during first year of therapy. Urology. 2007;70:122–6. doi: 10.1016/j.urology.2007.03.026. [DOI] [PubMed] [Google Scholar]
- Hansen PA, Dechet CB, Porucznik CA, LaStayo PC. Comparing eccentric resistance exercise in prostate cancer survivors on and off hormone therapy: a pilot study. PM R. 2009;1:1019–24. doi: 10.1016/j.pmrj.2009.09.016. [DOI] [PubMed] [Google Scholar]