Abstract
Templating of cell spreading and proliferation is described that yields confluent layers of cells aligned across an entire two-dimensional surface. The template is a reactive, two-component interface that is synthesized in three steps in nanometer thick, micron-scaled patterns on silicon and on several biomaterial polymers. In this method, a volatile zirconium alkoxide complex is first deposited at reduced pressure onto a surface pattern that is prepared by photolithography; the substrate is then heated to thermolyze the organic ligands to form surface-bound zirconium oxide patterns. The thickness of this oxide layer ranges from 10 to 70 nanometers, which is controlled by alkoxide complex deposition time. The oxide layer is treated with 1,4-butanediphosphonic acid to give a monolayer pattern whose composition and spatial conformity to the photolithographic mask are determined spectroscopically. NIH 3T3 fibroblasts and human bone marrow-derived mesenchymal stem cells attach and spread in alignment with the pattern without constraint by physical means or by arrays of cytophilic and cytophobic molecules. Cell alignment with the pattern is maintained as cells grow to form a confluent monolayer across the entire substrate surface.
1 Introduction
An extracellular matrix (ECM), which is the body’s natural scaffold, is assembled by cells to support the mechanical and chemical requirements of a specific tissue. The central role of the ECM in the structural and functional make-up of different tissue types makes its recreation a primary goal for tissue regeneration, yet the complex nature of native ECM renders it virtually impossible to mimic with synthetic materials. In this context it has been suggested that “[r]ather than recreate complexity of tissues ex vivo we should aim to develop synthetic materials that establish key interactions with cells in ways that unlock the body’s innate powers of organization and self repair.”1 Indeed cells growing in culture will assemble a matrix with a fibrous organization that resembles native tissue ECM. Thus, if templates could be designed that induce cells to grow into tissue-specific arrangements, then the cells should assemble an ECM that follows that arrangement. In this regard, methods to pattern cell adhesion on a surface typically use adsorption and/or attachment of cytophilic and cytophobic molecular arrays onto or creating physical barriers on substrate surfaces.2-27 A major challenge for spatial control of ECM assembly is that the very constraints used to promote cell spreading on a pattern may not allow cells to spread beyond that pattern to cover an entire surface and to grow to a sufficient density for optimal ECM assembly while maintaining overall spatial organization.
Here we present a versatile method for templating the growth of cells over an entire surface with spatial organization that is predetermined by a simple chemical surface pattern. This method can be applied to many types of hard or polymer surfaces, is easily scalable, as synthesized uses commercially available abiologics, involves well-known photolithographic procedures, and yields template patterns that are stable for weeks under cell culture conditions. Our method constructs a two-component micron scale, nanometer thin surface architecture on the substrate, in which its distal surface is more cell-adhesive than the substrate material itself. The ease of implementation of our method made it possible to rapidly determine template parameters that yield optimal spatial alignment of cells on a variety of surface types.
As proof of principle, we show that both mouse fibroblasts and human bone marrow-derived mesenchymal stem cells (MSCs) align within striped patterns in statistically significant ways compared to an unpatterned control. The cells proliferate to fill the stripes, and eventually spread into regions between these stripes forming a confluent layer that maintains alignment with the striped pattern. Thus, this simple nanoscale pattern enables cell alignment across an entire two-dimensional surface.
2 Experimental
2.1 Materials
p-Type, heavily boron-doped silicon terminated with a 1000 Å thermally grown oxide layer (Silicon Quest, Inc.); polyetheretherketone (PEEK), nylon 6,6 (Nylon), and polyethylene terephthalate (PET) films of 0.05 mm thickness (Goodfellow, Corp.); hexanes, toluene, methanol, 2-propanol, hexamethyldisilazane (HMDS), formaldehyde, 4′,6-diamidino-2-phenylindole (DAPI), and anti-vinculin antibodies (Sigma-Aldrich); zirconium tetra(tert-butoxide) (Strem Chemicals, Inc.); Dulbecco’s modified eagle medium (DMEM) and phosphate buffered saline (PBS) (Invitrogen); bone marrow derived human mesenchymal stem cells (hMSCs, PT-2501), serum containing “bullet” medium (PT-3001), trypsin/EDTA (CC-3232) (Lonza); nonyl phenoxypolyethoxylethanol (NP-40), sulfuric and hydrochloric acids (EMD Chemicals); 30 % hydrogen peroxide (J.T. Baker); rhodamine phalloidin (Molecular Probes); 1,4-butanediphosphonic acid (Acros Organics); AZ-5214E photoresist and AZ-312 MIF developer (Capitol Scientific, Inc.); and, absolute ethyl alcohol (Pharmco-Aaper) were used as received.
Photomasks were fabricated using a Heidelberg DWL laser writer equipped with a 20 mm focal length writehead. The dimensions of the photolithographic patterns used for optimization studies were (width of stripe X space between stripes; all nominal dimensions are in μm): 10 × 10, 20 × 20, 10 × 20, 20 × 10, 20 × 30, 30 × 10, 30 × 30, 40 × 30, 50 × 30, 60 × 30, and 100 × 40. Some minor shadowing was observed with stripes ≤ 20 μm.
2.2 Substrate Cleaning
Silicon wafers were cut into 1 cm × 1 cm coupons and cleaned by sequential sonication in hexanes, toluene, and methanol for 15 min each. The samples were next immersed in “piranha” solution (H2SO4: 30% H2O2, 3:1) for 15 min at 85 °C followed by sequential rinsing in deionized water and 2-propanol, and then dried under a stream of nitrogen. A second acid cleaning was done in “buzzard” solution (HCl: 30% H2O2, 1:1) at 85 °C for 15 min; the samples were rinsed sequentially with deionized water and 2-propanol, and then dried under a stream of nitrogen. The cleaned surfaces were stored in a desiccator 55 until use. Polymer films were cut into 1 cm × 1 cm coupons and were cleaned by sonication in ethanol for 15 min. The substrates were rinsed and stored as silicon.
2.3 Photolithography
Cleaned polymer and silicon surfaces were heated (95 °C) for 10 min, save nylon and PET, which were not heated to avoid glass transition. HMDS was spin-cast onto the substrate surfaces (4000 rpm, 40 sec) followed by AZ-5214E photoresist (4000 rpm, 40 sec). Substrates were baked for 45 sec (95 °C), exposed to UV (365 nm, 4 W) through a photomask for 30 sec, and then developed in AZ-312 MIF for 30-34 sec. The substrates were rinsed vigorously in deionized water and examined by optical microscopy. All patterns were fabricated and analyzed at minimum in duplicate.
2.4 Vapor Phase Deposition of Zirconium tetra(tert-butoxide) (1), and Formation of the Self-Assembled Monolayer ofPhosphonates (SAMP)28-30
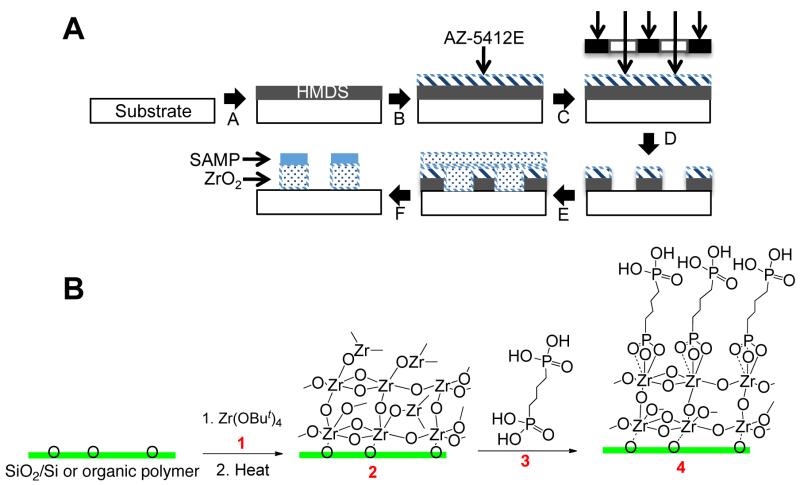
Substrates patterned with photoresist were placed inside a deposition chamber equipped with two valves; one was connected to vacuum and the other to a bulb containing zirconium tetra(tert-butoxide) (1). The chamber was evacuated to 1 × 10⁻³ torr for 10 min. Silicon samples were exposed to vapor of 1 for 3 min with the chamber opened to vacuum; polymer samples were exposed for 5 min. The bulb and chamber were sealed, and the chamber was warmed to 50 °C for silicon and 75 °C for polymers, giving a cross-linked, zirconium oxide base layer. The chamber was then cooled to room temperature. The chamber was back-filled with zero-grade nitrogen, and valves were closed to isolate the chamber prior to dismounting. The chamber was opened, and the substrates were soaked in an ethanol solution of 1,4-butanediphosphonic acid (0.25 mg/mL) for 24 hr to give 4. The substrates were then rinsed sequentially with ethanol and 2-propanol, dried under nitrogen, and then inspected by optical microscopy (Scheme 1). Using this 30 procedure it is easy to prepare about 60 1 cm × 1 cm patterned surfaces in a day.
Scheme 1.
(Top, A) Schematic for the preparation of a nanoscale-patterned surface using a self-assembled monolayer of phosphonates (SAMP). (A) Spin-cast with HMDS; (B) spin-cast AZ-5412E photoresist; (C) expose to UV through a photomask; (D) develop in AZ-312 MIF; (E) vapor deposition of 1, then heat to form the adhesion layer; (F) assembly of the SAMP. (Bottom, B) The photolithographically patterned surface (after step D) is treated with vapor of 1 and then heated to give ZrO2/surface (2); reaction with phosphonic acid 3 gives SAMP/ZrO2/surface (4).
2.5 Material and Surface Characterization
Surfaces functionalized with 4 were analyzed by X-ray photoelectron spectroscopy (XPS), scanning electron microscopy (SEM) and energy dispersion spectroscopy (EDS). A VG scientific ESCALab Mk II equipped with a Mg Kα (1253.6 keV) anode source operating at 15 keV accelerating voltage and 20 mA and a VG scientific hemispherical sector analyzer (HAS) detector was used. A 50 eV pass energy, 1 eV step size, and 100 ms dwell time were used to collect survey (1000 to 0 eV) spectra. Detailed XPS data were collected at a pass energy of 20 eV with a dwell time of 500 ms and a step size of 0.05 eV. Data analysis was carried out using CasaXPS software (Casa Software Ltd.). Spectra were calibrated against adventitious C 1s (284.5 eV). SEM analysis used a FEI Quanta 200 Environmental-SEM equipped with an Oxford INCA Synergy 450 energy-dispersive X-ray microanalysis system with an X-Max 80 large area analytical silicon drift detector (SDD) at an acceleration voltage of 5 keV. Atomic force microscopy (AFM) was used to determine the height on the patterns deposited on the substrate coupons (Digital Instruments Multimode AFM in tapping mode).
Nylon, PET, and PEEK films were cut into individual “dogbone” shaped pieces using an ASTM die and a PHI hydraulic press. Polymer “dogbones” were cleaned by sonicating in ethanol for 15 minutes. “Dogbone” polymer substrates were then used for growth of 2 and 4 as described above. The elastic moduli of surfaces with 2 and 4 were then used for stress-strain measurements that were done at a displacement rate of 1 mm/min using an Instron 5865 load frame with Instron 2710-103 screw side-action grips suited for a maximum load of 1 kN. Five polymer “dogbones” were analyzed for each group (cleaned polymer, 2-modified, and 4-modified) for each polymer.
2.6 Pattern Stability Studies
Glass and silicon substrates were patterned with 30 × 30 ZrO2 stripes. The substrates were immersed in serum-containing medium (DMEM with 10% calf serum) for 18 days. Glass and silicon substrates were removed on days 3, 6, 9, 12, and 18, and were rinsed gently with PBS. Optical microscopy determined if the ZrO2 stripes remained intact, XPS analysis was used to identify elemental presence on the surface, and AFM investigated the surface morphology.
2.7 Cell Adhesion and Imaging
Cell adhesion studies for statistical analysis of cell aspect ratio and alignment were conducted using NIH 3T3 fibroblasts. SAMP-Patterned and control (unpatterned SAMP) samples were placed in individual wells of 24-well plates and were rinsed twice with phosphate buffered saline (PBS). NIH 3T3 fibroblasts were plated at 30,000 cells per well on the substrates in serum-free DMEM and were allowed to attach at 37 °C for 3 hr. The medium was changed to DMEM with 10% calf serum and the attached cells were allowed to spread for an additional 21 hr (24 hr total). Cells were fixed using 3.7 % formaldehyde in PBS for 15 min, permeabilized with 0.5 % NP-40 in PBS for 15 min at room temperature, and stained with rhodamine-phalloidin and DAPI for cell shape and orientation studies.
Cell toxicity was studied using NIH 3T3 cells plated on silicon surfaces completely coated with 4 (unpatterned) described above. Cells were plated as described above in duplicate, and were allowed to proliferate for 3 days; after 24 hr and 3 days they were stained and analyzed as above. Cells were counted and cell-spreading areas were 100 measured using ImageJ, 10 image fields were used for the measurements and field dimensions were 853 μm × 683 μm. Cell doubling time was calculated assuming constant growth rate.
Longer term (8 day) cell studies were performed on silicon and polymer patterned surfaces. NIH 3T3 cells were plated at 30,000 cells/well in serum-containing DMEM (10% calf serum). Bone marrow-derived MSCs were trypsinized with trypsin/EDTA and plated at 30,000 cells/well in Mesenchymal Stem Cell Growth Medium (MSCGM, Lonza Inc.) (note: MSCs were not studied on polymers). The cells were incubated at 37 °C as the cells grew to confluence. Time points on silicon were taken at 24 hr, 3 days, and 8 days at which time the cells were stained for imaging as described above. Polymer time points were 24 hr and 3 days. Cells were plated on all surfaces in duplicate.
Cells were visualized with a Nikon TE2000U fluorescent microscope and images were captured with a QImaging Retiga 1300 camera and iVision software, and were further analyzed using ImageJ software.
2.8 Data Analysis and Statistics
Cell aspect ratio was calculated using ImageJ software and was defined as the ratio of cell width to length; measurements were made after 24 hr on both experimental and control surfaces. Long membrane projections that were ≤ 5.3 μm wide were not included in the measurement of the overall length. The angle of cell orientation was also measured with respect to that of the pattern for the experimental surfaces (see electronic supplementary information (ESI) Fig. S1). An arbitrary horizontal axis was defined as the reference for the control surfaces; typically 5 fields were analyzed to measure 100 cells. The Shapiro-Wilk test was used to determine if data were normally distributed (n = 100, α < 0.05). The Kruskal-Wallis one-way analysis of variance was used to test for significant difference between all experimental groups and the control for both cell aspect ratio and angle of orientation (n = 100, α < 0.05). The Mann-Whitney U nonparametric statistical hypothesis test was used to test for significance in a pair-wise manner comparing the experimental groups, individually, to the control; the Bonferoni correction was used to adjust the significance level (n = 100, α < 0.0045). Origin 8.5 was used to generate box plots. The elastic moduli of each of the polymer groups were compared using a one-way analysis of variance (one-way ANOVA) after testing for normality with the Shapiro-Wilk test (n = 5, α < 0.05).
3 Results and Discussion
3.1 Characterization and Stability of SAMP/ZrO2 Surface Structures
Material surfaces were chemically modified using a simple photolithographic procedure (Scheme 1A). Silicon was the substrate used for template dimension optimization: It is planar, and photolithography on Si is very well established. Nanoscale stripes were prepared first by vapor phase deposition of volatile zirconium tetra(tert-butoxide) (1) onto a substrate that had been patterned by photolithography followed by mild thermolysis to ZrO2 (2) (Scheme 1B). The second component was then introduced as the SAMP that is grown on the patterned oxide (SAMP/ZrO2, 4).28, 312 We had previously shown that unpatterned nanoscale interface 2 can increase cell affinity for several biopolymer surfaces.28, 31-33 Our method uses commercially available materials and does not require specialized equipment. Further, this method is scalable and is only limited by the size of the UV source, photomasks, and CVD chamber used for ZrO2 deposition. We used 11 striped patterns defined as the width of the SAMP/ZrO2 stripe (in μm) × spacing between stripes (in μm), for example, 20 × 30.
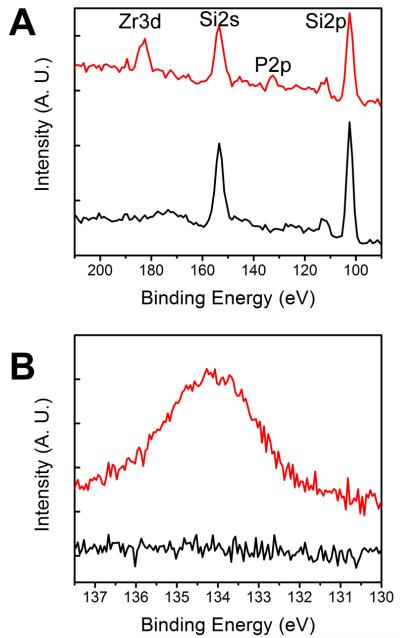
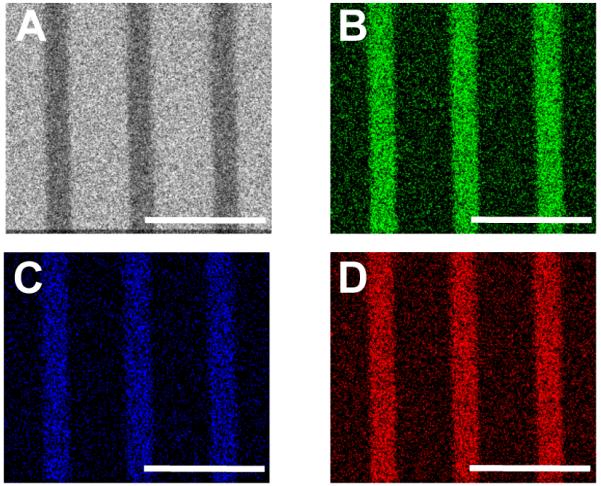
Spectroscopic analysis was used to determine elemental composition and distribution of the 4 template on oxide-terminated Si (SiO2/Si) (Fig. 1). XPS analysis of a 30 × 30 4 pattern on SiO2/Si showed peaks with binding energy (BE) Zr(3d5/2) = 183.4 eV and BE P(2p) = 134.3 eV, with relative integrated areas Zr : P ≈ 1 : 1.5 (additional spectra are shown in ESI Fig. S2). Zirconium, P, C, and Si were mapped using SEM with EDS for a nominal 20 × 30 pattern on silicon, which showed conformity of Zr, P, and C with the pattern and with concomitantly reduced Si signal intensity (Fig. 2); the P(Kα) emission peak (2.013 keV) somewhat overlaps with the stronger Zr(Lα) peak (2.042 keV). Polymer surface characterization was performed on 60 × 30 4-patterned surfaces using the same techniques (see ESI Figs. S3-S6). Polymer substrates required slightly longer times (an additional ca. 2 min) of exposure to 1 to ensure good surface coverage (see ESI Fig. S6J).
Fig. 1.
XP spectra before (black) and after (red) surface modification to form 4 on SiO2/Si. (A) Scans over the Zr(3d) to Si(2p) region, (B) narrow range scans over the P2(2p) region. Note the appearance of the Zr(3d) and P(2p) peaks after surface modification.
Fig. 2.
EDS maps of Si (A, gray), Zr (B, green), C (C, blue), and P (D, red). Note the reduction (darkening) in the signal intensity for Si where Zr, P, and C exist showing conformity of the bisphosphonate SAMP/ZrO2 with the pattern. Scale bars = 70 μm.
AFM analysis of 4 stripes on SiO2/Si showed heights to be 10 – 70 nm. AFM of the 4 pattern on PET showed an average height of 70 nm (see ESI Fig. S7). Variations in height measured on any substrate surface are likely due to small changes in vapor-phase deposition conditions for 1: Any intrusion of moisture into the reservoir of 1 will give ZrO2 and volatile tert-butanol, which could adversely impact vapor pressure transport of 1, thus decreasing the rate of deposition.
SAMP/ZrO2 surface structures in the range of 10–70 nm should not affect the physical properties of the substrate material. Indeed, measurements of the elastic moduli of 25 PET, PEEK, and nylon showed no statistical difference between 2 and 4 coated surfaces, and native, uncoated surfaces. Statistical comparison within each polymer group found no difference between the native control, 2-modified, and 4-modified materials after surface treatment (PET, p = 0.367; PEEK, p = 0.137; nylon, p = 0.265, see ESI Table 1).
We tested the stability of the deposited ZrO2 stripes on glass and SiO2/Si substrates by immersion in standard cell cultured medium and conditions for 18 days (10 % calf serum in DMEM at 37 °C). Optical microscopy showed no evidence of stripe peeling or delamination for the duration of the study (see ESI Fig. S8). XPS analysis of substrate surfaces showed the persistence, but with signal attenuation, of the Zr(3d) peak and with the appearance of an N(1s) peak and higher binding energy shoulders on the C(1s) peak (see ESI Figs S9-S10); these spectroscopic changes are attributed to serum protein adsorption onto the surface. Attenuation of the Zr(3d) peak was somewhat more pronounced on the glass substrate, and it could not be detected after day 9. AFM analysis showed that the height of the patterned ZrO2 stripe on SiO2/Si (relative to that of underivatized regions) remained nearly constant following an initial increase in height within 9 days of immersion (see ESI Fig. S11). For example, the initial pattern height of ZrO2/SiO2/Si was 12 nm; after immersion in culture medium this height increased to 20-25 nm and remained at this level for the duration of the study from day 3 to day 18. The ZrO2/glass pattern height (before adding protein) was also 12 nm; after immersion it increased from 26 nm (day 3) to 50 nm (day 18). EDS analysis of the ZrO2/SiO2/Si pattern at day 3 showed, in addition to the striped pattern for Zr (as in Fig. 2 above), that nitrogen-containing material covered the entire surface (see ESI Fig. S12). We interpret these observations to mean that relative protein adsorption rates are ZrO2 > SiO2/Si > glass cover slip surfaces.
3.2 Quantification of NIH 3T3 Fibroblast Shape and Alignment on Modified SiO2/Si
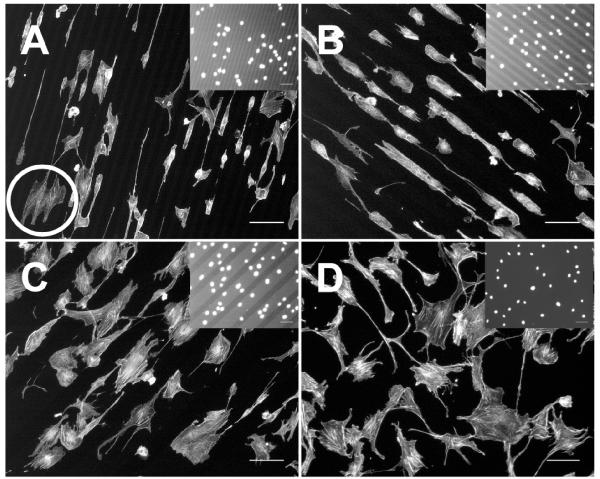
NIH 3T3 fibroblasts were plated on 4-patterned and unpatterned SiO2/Si surfaces and allowed to attach and spread for 3 hr. Medium was replaced with DMEM/10% serum and, at 24 hr, cells were fixed and stained to visualize cell shapes and alignment (Fig. 3; see ESI Fig. S13). The cells attached preferentially to the 4 patterns and nuclei were located almost entirely on the stripes of 4, which is observed readily in the insets (Fig. 3). On closely spaced patterns (separated by 10 μm) cells were able to cross over unpatterned areas and spread along adjacent 4 stripes (Fig. 3A circle).
Fig. 3.
NIH 3T3 fibroblasts spread on 4-modified SiO2/Si after 24 hr. (A) 20 × 10; (B) 30 × 30; (C) 100 × 40; (D) unpatterned, control. Images are of actin stain, and the insets are increased brightness images of the nuclei stain. Note the placement of the nuclei on the 4-modified regions (lighter stripes). The circle in (A) shows an example of a cell spreading across multiple stripes. Scale bar = 100 μm.
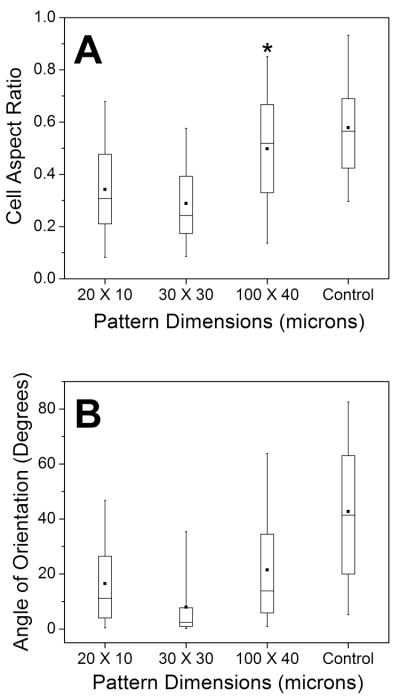
We evaluated cell shape changes related to the underlying surface architecture by determining the cell aspect ratio for cells plated on 4 patterns of various dimensions and on unpatterned, control surfaces. As we define the cell aspect ratio to be the ratio of cell width to length, an aspect ratio of 1 means the cell is perfectly round. The “box plots” represent the distribution of cell aspect ratio measurements (Fig. 4A, see ESI Fig. S14). Analysis of variance for cell aspect ratio for all groups (patterns and control) found statistical difference (p < 0.001) of at least one group to the others, and pair-wise analysis found all groups to be different from the control (p < 0.0001), save the 100 × 40 pattern (p = 0.0184). As shown in Fig. 4A, cells are more elongated on the narrower 20 × 10 and 30 × 30 patterns compared to unpatterned or 100 × 40 patterns. In fact, the distributions calculated for the 100 × 40 pattern (the largest width of 4 studied) and the control substantially overlap. These results indicate that all of our 4 pattern dimensions, with the exception of the 100 × 40 pattern, can influence cell shape to be statistically more elongated compared to an unpatterned surface.
Fig. 4.
Box plots for cell aspect ratio (A) and angle of orientation (B). Plots represent the distribution of all measurements (n = 100). The boxes span the 25th to 75th percentiles, and the whiskers span the 5th to 95th percentiles of the distribution. The square in the box is the mean, and the horizontal line is the median. The asterisk (*) denotes no statistical difference compared to the control.
Cell alignment with the pattern direction was determined by measuring the angles of cellular long axes relative to the patterns. Analysis of variance found a statistical difference among the individual groups (p < 0.001), and pair-wise comparison tests found statistical differences between each of the patterned surfaces compared to the control (p < 0.0001) (Fig. 4B, see ESI Fig. S14). In other words, all of the 4 stripe dimensions can influence the direction of the cellular long axis in such a way that attached cells are oriented in the pattern direction compared to cells on an unpatterned surface. It is interesting that the 100 × 40 pattern can induce alignment of cells in the direction of the pattern but does not cause the cells to become more elongated than does an unpatterned surface. In this analysis, however, two pattern dimensions are especially noteworthy: The 20 × 20 and 30 × 30 dimensions had the narrowest distributions for cell long axis orientation and pattern correspondence. While these data suggest that 20 × 20 and 30 × 30 dimensions are best for alignment of NIH 3T3 cells, these same dimensions may not be appropriate for other cells where sizes may differ. Given that our method allows for pattern size diversity, multiple cell types can likely be accommodated.
3.3 Cell Alignment with Increasing Density
We determined that our surface structures are not inhibiting the growth of cells by simply plating NIH 3T3 fibroblasts on 4-coated (unpatterned) SiO2/Si for 1 and 3 days. After 1 day 34 ± 6 cells were counted in 10 fields. Cell numbers increased on these surfaces over the next 3 days to 134 ± 32 cells; this corresponds to a doubling time of 24 hr. This is typical of cell growth on standard culture materials. These data suggest that 4-modified surfaces are apparently not cytotoxic; indeed, a SAMP/TiO2 coating was found to be effective for bone growth on a titanium implant in vivo34 (see ESI Fig. 15).
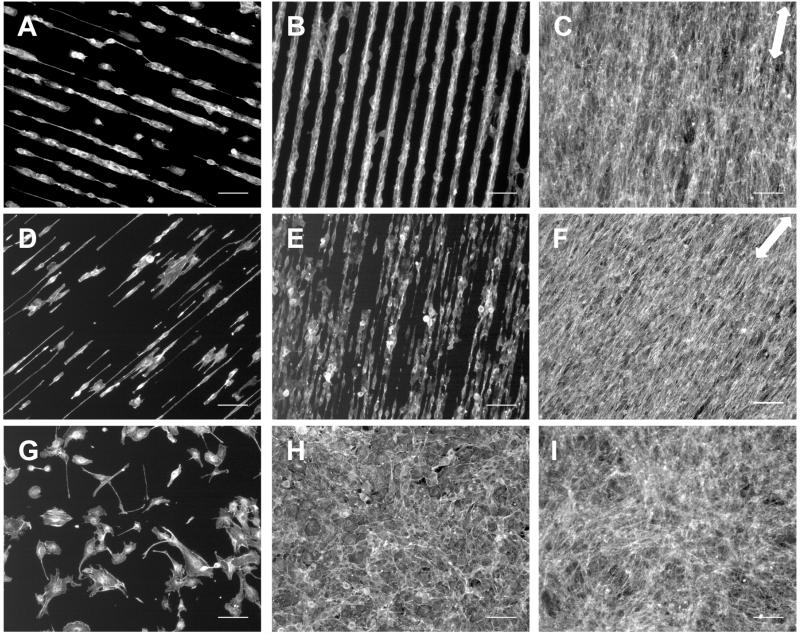
NIH 3T3 fibroblasts plated on 4-patterned silicon surfaces maintained alignment with the pattern for 8 days as the cells grew to confluence. After 1, 3, and 8 days, cells were fixed and stained with fluorescent phalloidin to visualize actin filaments (Fig. 5). At 1 day, NIH 3T3 cells were oriented with the 30 × 30 and 10 × 10 stripes (Fig. 5A, D). After 3 days, the cells on 30 × 30 and 10 × 10 surfaces had proliferated to cover most of the 4 stripes and remained aligned with pattern direction (Fig. 5B, E). Cells on the control surface were randomly oriented at all time points and cell densities (Fig. 5G-I). Cells on both 10 × 10 and 30 × 30 4-patterned surfaces maintained their alignment with the patterns as they grew to confluence by day 8. Note the correspondence between actin filament orientation and the underlying chemical pattern indicated by the two-headed arrows (Fig. 5C, F). These results show that alignment of sparsely-plated cells on these patterns enables development of an oriented cell layer that covers an entire 1 cm × 1 cm silicon coupon.
Fig. 5.
NIH 3T3 fibroblasts on 4-modified 30 × 30 (A-C); 10 × 10 (D-F); and unpatterned, control (G-I) SiO2/Si surfaces after 24 hr (left), 3 days (middle), and 8 days (right) in culture. Note how the cells align initially and spread to confluence while maintaining alignment with the chemical pattern 4, arrows in D and F indicate pattern direction. Images show actin stain, scale bar = 100 μm.
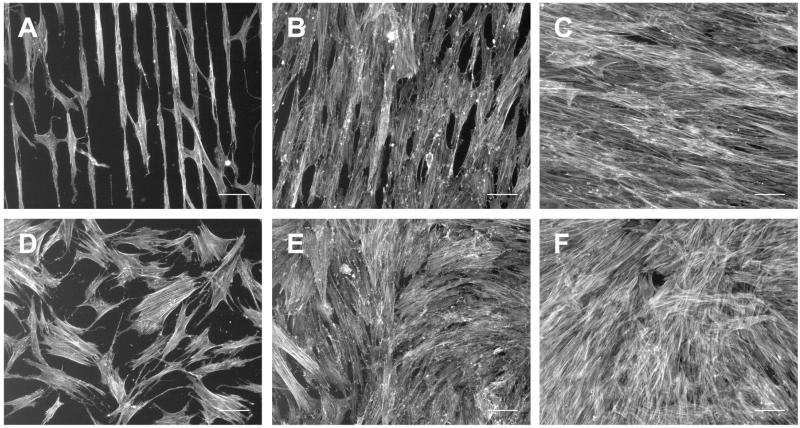
Similar experiments were performed with human bone marrow-derived MSCs on a representative 30 × 30 pattern and on an unpatterned surface of SiO2/Si. Fluorescence staining of the actin cytoskeleton after 1, 3, and 8 days showed that MSCs were aligned with and spread on the patterned surface but were randomly oriented on the unpatterned control (compare Fig. 6A and D). MSCs are larger than NIH 3T3 cells which allowed them to occasionally spread across 30 μm-wide untreated surface regions to adjacent adhesive stripes (Fig. 6A). As cells grew to confluence, they remained aligned with the pattern (Fig. 6B, C) in contrast to cells on the control surface (Fig. 6E, F). Therefore, MSCs and fibroblasts display a similar response to a 30 × 30 patterned substrate.
Fig. 6.
Bone marrow derived hMSCs on 4-modified 30 × 30 (A-C) and unpatterned, control (D-F) SiO2/Si after 24 hr (left), 3 days (middle), and 8 days (right) in culture. hMSCs align with the pattern of 4 and remain aligned as they grow to confluence over 8 days, as was observed with the NIH 3T3 cells. Images show actin, scale bar = 100 μm.
3.4 Translation to Biomedically-Relevant Polymers
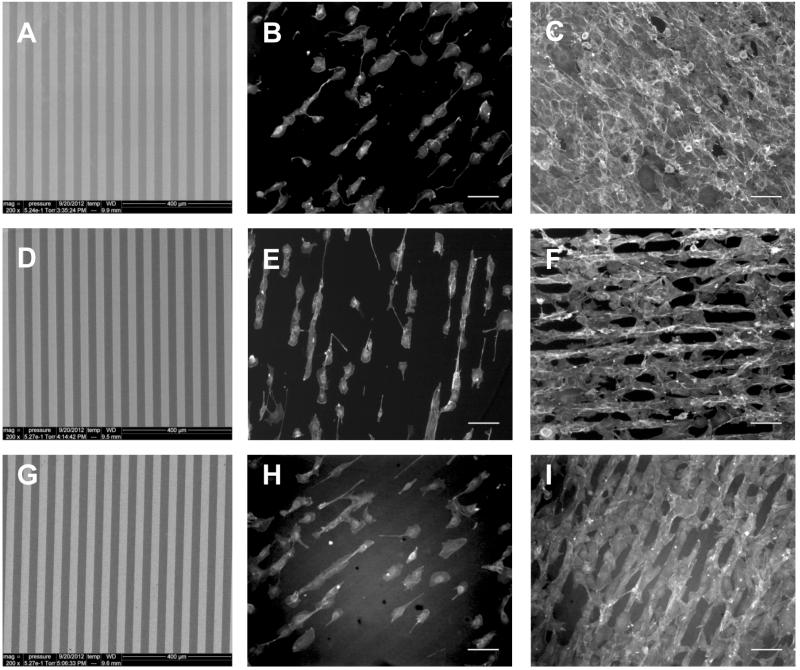
Photolithographic surface chemical templating was extended to polymers that are representative of three classes of biomaterials, polyesters, polyamides, and PEEK, which may be used for biomedical purposes as implantable devices or tissue scaffolds. 35-39 Myriad differences exist, however, between organic polymers and SiO2/Si as substrates for vapor phase-based synthesis of 2: In particular, all photolithography procedures and reagents used herein have been perfected for use on the hydrophilic SiO2/Si surface; the polymers we used are rather hydrophobic. Furthermore, Si wafers are flat, but the polymer sheets used are somewhat “wavy;” AFM shows that they are significantly rougher than oxide-terminated Si. Finally, the SiO2/Si surface is replete with oxide groups that can readily coordinate 1 from the vapor phase; the organic polymers are relatively limited in the surface area density of Zr-ligating groups, such as carbonyls or ethers (Scheme 1). Given these many differences with SiO2/Si it is noteworthy that our method for surface patterning does translate faithfully to the polymers we used, and NIH 3T3 fibroblasts plated on 30 × 30 4-templated polymer surfaces adhered within the striped pattern and maintained conformity with the pattern comparable to that which we found for these dimensions on SiO2/Si (Fig. 7).
Fig. 7.
(Left) SEM images at 200× of 30 × 30 4-modified nylon 6,6 (A), PET (D), and PEEK (G). The pattern is uniform across the polymer surface, with well defined edges. NIH 3T3 fibroblasts on patterned nylon 6,6 (B-C), PET (E-F), and PEEK (H-I) after 24 hr (middle) and 3 days (right). Images are of actin stain, scale bar = 100 μm.
4 Conclusions
We have developed a versatile, reproducible method using well-known techniques of photolithography and organometallic chemical vapor deposition to make nanometer thin, micron-scale patterned surfaces to template cell growth. In contrast to reported methods to improve cell attachment and growth on such biopolymer surfaces, including plasma treatment to increase surface roughness and introduce oxygen-based functional groups,40-42 or blending of polymers with cell-adhesive amino acid-containing side chain materials,42, 43 our method does not change the fundamental structure of the polymer nor its physical properties. Because the organometallic-based interface can be formed on essentially any oxide-terminated surface or on organic polymers that contain appropriate ligating atoms, our patterned interface method should be readily translatable to a broad spectrum of hard and soft biomaterial surfaces.28, 29, 32-34, 44, 45 This work represents to the best of our knowledge the first example of creating a patterned nanoscale, abiologic interface, as synthesized, to control cell adhesion and spreading on flexible polymer surfaces of biomedical relevance. Because our method does not rely on the surface attachment of any specific cell surface receptor ligands, the SAMP/ZrO2 interface should be permissive for adhesion of a variety of cell types. Herein we showed that fibroblasts and human MSCs adhere to this interface; we had previously shown that osteoblasts also adhere to it (on a non-patterned surface).28 We had also shown that 4 can be synthesized (unpatterned) on type I collagen,46 silk,46 Tecoflex® polyurethane,33 and polyvinylalcohol,29 so controlling the alignment of various types of cells on these classes of materials can now be envisaged following the protocols we demonstrated herein for PEEK, PET, and nylon 6,6. Most important is that our procedure does not induce cell alignment through techniques that depend on cell confinement: Cells attach to the SAMP/ZrO2-activated patterns on all of the surfaces we examined and spread in register with these patterns in statistically significant ways. Since no physical channeling or cytophobic barriers are used, and since the SAMP/ZrO2 architecture is thin (no more than 70 nm high), cells are free to spread from the SAMP/ZrO2-activated stripes across intervening regions, yet maintaining registry with the pattern to form a spatially aligned confluent layer. Ramifications for aligned ECM assembly are now under study.
Supplementary Material
Acknowledgements
The authors thank the National Science Foundation (CHE-0924104), the National Institutes of Health (CA160611 and GM059383), and the New Jersey Center for Biomaterials NIBIB Post-doctoral Training Program (T32EB005583) for financial support. They also thank Dr. Samuel Lesko (University of Scranton, PA, USA) for advice with statistical analyses and Prof. Rick Register (Princeton University, NJ, USA) for use of laboratory equipment.
Footnotes
Electronic Supplementary Information (ESI) available: [Fifteen figures and one table are available: (Fig. S1) A cell modelled as an ellipse to determine cell aspect ratio and orientation; (Fig. S2) XP spectra of SiO2/Si before and after surface modification (Survey, Zr(3d), and Zr(3p)); (Figs. S3-S5) XP spectra for modified polymers (Survey and P(2p)); (Fig. S6) SEM images and EDS maps of polymers; (Fig. S7) AFM images of 4-stripe on SiO2/Si and PET; (Fig. S8) Optical images of 4-stripes on SiO2/Si and glass after immersion in serum containing medium; (Fig. S9) Survey XP spectra of 2-patterned SiO2/Si and glass after immersion in serum containing medium; (Fig. S10) XP spectra of C(1s) region of 2-patterned SiO2/Si after immersion in serum containing medium; (Fig. S11) AFM images of 2-stripes on SiO2/Si and glass after immersion in serum containing medium; (Fig. S12) SEM image and EDS maps of 2-patterned SiO2/Si after 3 days in serum contaiing medium; (Fig. S13) NIH 3T3 Fibroblasts after 24 hr on other dimensions studied; (Fig. S14) Box plots of cell aspect ratio and angle of orientation for other dimensions studied; (Fig. S15) NIH 3T3 Fibroblasts on 4-modified SiO2/Si after 1 and 3 days in culture; (Table 1) summary of elastic moduli data and statistical analysis].
references
- 1.Place ES, Evans ND, Stevens MM. Nat. Mater. 2009;8:457–470. doi: 10.1038/nmat2441. [DOI] [PubMed] [Google Scholar]
- 2.Flemming RG, Murphy CJ, Abrams GA, Goodman SL, Nealey PF. Biomaterials. 1999;20:573–588. doi: 10.1016/s0142-9612(98)00209-9. [DOI] [PubMed] [Google Scholar]
- 3.McBeath R, Pirone DM, Nelson CM, Bhadriraju K, Chen CS. Develop. Cell. 2004;806:483–495. doi: 10.1016/s1534-5807(04)00075-9. [DOI] [PubMed] [Google Scholar]
- 4.Kilian KA, Bugarija B, Lahn BT, Mrksich M. Proc. Natl. Acad. Sci. 2010;107:4872–4877. doi: 10.1073/pnas.0903269107. [DOI] [PMC free article] [PubMed] [Google Scholar]
- 5.Chen CS, Mrksich M, Huang S, Whitesides GM, Ingber DE. Science. 1997;276:1425–1428. doi: 10.1126/science.276.5317.1425. [DOI] [PubMed] [Google Scholar]
- 6.Williams C, Brown XQ, Bartolak-Suki E, Ma H, Chilkoti A, Wong JY. Biomaterials. 2011;32:410–418. doi: 10.1016/j.biomaterials.2010.08.105. [DOI] [PMC free article] [PubMed] [Google Scholar]
- 7.Pum D, Stangl G, Sponer C, Fallmann W, Sleytr UB. Colloids Surf., B. 1997;8:157–162. [Google Scholar]
- 8.Jing GS, Wang Y, Zhou TY, Perry SF, Grimes MT, Tatic-Lucic S. Acta Biomater. 2011;7:1094–1103. doi: 10.1016/j.actbio.2010.09.040. [DOI] [PubMed] [Google Scholar]
- 9.Miller JS, Béthencourt MI, Hahn M, Lee TR, West JL. Biotechnol. Bioeng. 2006;93:1060–1068. doi: 10.1002/bit.20809. [DOI] [PubMed] [Google Scholar]
- 10.Leclair AM, Ferguson SSG, Lagugné-Labarthet F. Biomaterials. 2011;32:1351–1360. doi: 10.1016/j.biomaterials.2010.10.051. [DOI] [PubMed] [Google Scholar]
- 11.Rosenthal A, Macdonald A, Voldman J. Biomaterials. 2007;28:3208–3216. doi: 10.1016/j.biomaterials.2007.03.023. [DOI] [PMC free article] [PubMed] [Google Scholar]
- 12.Whitesides GM, Ostuni E, Takayama S, Jiang XY, Ingber DE. Annu. Rev. Biomed. Eng. 2001;3:335–373. doi: 10.1146/annurev.bioeng.3.1.335. [DOI] [PubMed] [Google Scholar]
- 13.Revzin A, Tompkins RG, Toner M. Langmuir. 2003;19:9855–9862. [Google Scholar]
- 14.Rettig JR, Folch A. Anal. Chem. 2005;77:5628–5634. doi: 10.1021/ac0505977. [DOI] [PubMed] [Google Scholar]
- 15.Kapoor A, Caporali EHG, Kenis PJA, Stewart MC. Acta Biomater. 2010;6:2580–2589. doi: 10.1016/j.actbio.2009.12.047. [DOI] [PubMed] [Google Scholar]
- 16.Gil ES, Park S, Marchant J, Omenetto F, Kaplan DL. Macromol. Biosci. 2010;10:664–673. doi: 10.1002/mabi.200900452. [DOI] [PMC free article] [PubMed] [Google Scholar]
- 17.Ruiz SA, Chen CS. Soft Matter. 2007;3:168–177. doi: 10.1039/b613349e. [DOI] [PubMed] [Google Scholar]
- 18.Roth EA, Xu T, Das M, Gregory C, Hickman JJ, Boland T. Biomaterials. 2004;25:3707–3715. doi: 10.1016/j.biomaterials.2003.10.052. [DOI] [PubMed] [Google Scholar]
- 19.Thibault C, Le Berre V, Casimirius S, Trévisiol E, François J, Vieu C. J. Nanobiotechnol. 2005;3:7. doi: 10.1186/1477-3155-3-7. [DOI] [PMC free article] [PubMed] [Google Scholar]
- 20.Sorribas H, Braun D, Leder L, Sonderegger P, Tiefenauer L. J. Neurosci. Meth. 2001;104:131–141. doi: 10.1016/s0165-0270(00)00333-2. [DOI] [PubMed] [Google Scholar]
- 21.Suh KY, Seong J, Khademhosseini A, Laibinis PE, Langer R. Biomaterials. 2004;25:557–563. doi: 10.1016/s0142-9612(03)00543-x. [DOI] [PubMed] [Google Scholar]
- 22.Veiseh M, Wickes BT, Castner DG, Zhang MQ. Biomaterials. 2004;25:3315–3324. doi: 10.1016/j.biomaterials.2003.10.014. [DOI] [PubMed] [Google Scholar]
- 23.Lenci S, Tedeschi L, Pieri F, Domenici C. Appl. Surf. Sci. 2011;257:8413–8419. [Google Scholar]
- 24.Mrksich M, Chen CS, Xia YN, Dike LE, Ingber DE, Whitesides GM. Proc. Natl. Acad. Sci. U. S. A. 1996;93:10775–10778. doi: 10.1073/pnas.93.20.10775. [DOI] [PMC free article] [PubMed] [Google Scholar]
- 25.Sánchez-Cortés J, Mrksich M. ACS Chem. Biol. 2011;6:1078–1086. doi: 10.1021/cb200186j. [DOI] [PMC free article] [PubMed] [Google Scholar]
- 26.Dillmore WS, Yousaf MN, Mrksich M. Langmuir. 2004;20:7223–7231. doi: 10.1021/la049826v. [DOI] [PubMed] [Google Scholar]
- 27.Lan S, Veiseh M, Zhang MQ. Biosens. Bioelectron. 2005;20:1697–1708. doi: 10.1016/j.bios.2004.06.025. [DOI] [PubMed] [Google Scholar]
- 28.Dennes TJ, Schwartz J. J. Am. Chem. Soc. 2009;131:3456–3457. doi: 10.1021/ja810075c. [DOI] [PubMed] [Google Scholar]
- 29.Allon AA, Ng KW, Hammoud S, Russell BH, Jones CM, Rivera JJ, Schwartz J, Höök H, Maher SA. J. Biomed. Mater. Res.: A. 2012;100A:2168–2175. doi: 10.1002/jbm.a.34144. [DOI] [PMC free article] [PubMed] [Google Scholar]
- 30.Jones CM, Donnelly PE, Schwartz J. ACS Appl. Mater. Interfaces. 2010;2:2185–2188. doi: 10.1021/am1004893. [DOI] [PubMed] [Google Scholar]
- 31.Dennes TJ, Schwartz J. ACS Appl. Mater. Interfaces. 2009;1:2119–2122. doi: 10.1021/am9004946. [DOI] [PubMed] [Google Scholar]
- 32.Dennes TJ, Hunt GC, Schwarzbauer JE, Schwartz J. J. Am. Chem. Soc. 2007;129:93–97. doi: 10.1021/ja065217t. [DOI] [PMC free article] [PubMed] [Google Scholar]
- 33.Dennes TJ, Schwartz J. Soft Matter. 2008;4:86–89. doi: 10.1039/b714947f. [DOI] [PubMed] [Google Scholar]
- 34.Shannon F, Cottrell JM, Deng X-H, Crowder KN, Doty SB, Avaltroni MJ, Warren RF, Wright TM, Schwartz J. J. Biomed. Mater. Res. 2008;86A:857–864. doi: 10.1002/jbm.a.31651. [DOI] [PubMed] [Google Scholar]
- 35.Shakespeare P. Clin. Dermatol. 2005;23:413–418. doi: 10.1016/j.clindermatol.2004.07.015. [DOI] [PubMed] [Google Scholar]
- 36.Supp D, Boyce S. Clin. Dermatol. 2005;23:403–412. doi: 10.1016/j.clindermatol.2004.07.023. [DOI] [PubMed] [Google Scholar]
- 37.Kurtz AM, Devine JN. Biomaterials. 2007;28:4845–4869. doi: 10.1016/j.biomaterials.2007.07.013. [DOI] [PMC free article] [PubMed] [Google Scholar]
- 38.Puskas J, Chen Y. Biomacromolecules. 2004;5:1141–1154. doi: 10.1021/bm034513k. [DOI] [PubMed] [Google Scholar]
- 39.Ma Z, Kotaki M, Yong T, He W, Ramakrishna S. Biomaterials. 2005;26:2527–2536. doi: 10.1016/j.biomaterials.2004.07.026. [DOI] [PubMed] [Google Scholar]
- 40.Yang J, Bei J, Wang S. Polym. Adv. Technol. 2002;13:220–226. [Google Scholar]
- 41.Wan Y, Qu X, Lu J, Zhu C, Wan L, Yang J, Bei J, Wang S. Biomaterials. 2004;25:4777–4783. doi: 10.1016/j.biomaterials.2003.11.051. [DOI] [PubMed] [Google Scholar]
- 42.Hersel U, Dahmen C, Kessler H. Biomaterials. 2003;24:4385–4415. doi: 10.1016/s0142-9612(03)00343-0. [DOI] [PubMed] [Google Scholar]
- 43.Cook AD, Hrkach JS, Gao NS, Johnson IM, Pajvani UB, Cannizzaro SM, Langer R. J. Biomed. Mater. Res. 1997;35:513–523. doi: 10.1002/(sici)1097-4636(19970615)35:4<513::aid-jbm11>3.0.co;2-c. [DOI] [PubMed] [Google Scholar]
- 44.Gawalt ES, Avaltroni MJ, Danahy MP, Silverman BM, Hanson EL, Midwood KS, Schwarzbauer JE, Schwartz J. Langmuir. 2003;19:200–204. correction, Langmuir 2003, 2019, 7147. [Google Scholar]
- 45.Danahy MP, Avaltroni MJ, Midwood KS, Schwarzbauer JE, Schwartz J. Langmuir. 2004;20:5333–5337. doi: 10.1021/la036084h. [DOI] [PubMed] [Google Scholar]
- 46.Dennes TJ, Princeton University . Ph.D. Thesis. 2008. [Google Scholar]
Associated Data
This section collects any data citations, data availability statements, or supplementary materials included in this article.


