

Abstract
Introduction
Epidemiologic evidence suggests that tomato-based products could reduce the risk of cardiovascular diseases. One of the main cardiovascular risk factors is low levels of high-density lipoprotein cholesterol (HDL-C). This study aimed to prospectively evaluate the effect of tomato consumption on HDL-C levels.
Subject and methods
We conducted a randomized, single-blinded, controlled clinical trial. We screened 432 subjects with a complete lipid profile. Those individuals with low HDL-C (men <40 mg/dL and women <50 mg/dL) but normal triglyceride levels (<150 mg/dL) were included. Selected participants completed a 2-week run-in period on an isocaloric diet and then were randomized to receive 300 g of cucumber (control group) or two uncooked Roma tomatoes a day for 4 weeks.
Results
A total of 50 individuals (women = 41; 82%) with a mean age of 42 ± 15.5 years and a mean body mass index of 27.6 ± 5.0 kg/m2 completed the study. A significant increase in HDL-C levels was observed in the tomato group (from 36.5 ± 7.5 mg/dL to 41.6 ± 6.9 mg/dL, P < 0.0001 versus the control group). After stratification by gender, the difference in HDL-C levels was only significant in women. The mean HDL-C increase was 5.0 ± 2.8 mg/dL (range 1–12 mg/dL). Twenty patients (40%) finished the study with levels >40 mg/dL. A linear regression model that adjusted for those parameters that impact HDL-C levels (age, gender, waist-to-hip ratio, body mass index, fasting triglyceride concentration, simple sugars, alcohol, physical activity, and omega-3 consumption) showed an independent association between tomato consumption and the increase in HDL-C (r2 = 0.69; P < 0.0001).
Conclusion
Raw tomato consumption produced a favorable effect on HDL-C levels in overweight women.
Keywords: lycopene, hypoalphalipoproteinemia, dyslipidemia, overweight, cardiovascular diseases
Introduction
Cardiovascular diseases (CVDs) are the main causes of death worldwide, with well recognized risk factors associated with their development.1 Low levels of high-density lipoprotein cholesterol (HDL-C) rank among the most common lipid abnormalities associated with CVD.2 Low HDL-C is currently defined as an HDL-C value <40 mg/dL for men and <50 mg/dL for women.3 Factors associated with low HDL-C include cigarette smoking,4 high triglyceride concentrations,5 a sedentary lifestyle,6 and insulin resistance.7 Nonpharmacological strategies to increase HDL-C concentration include increasing alcohol and fish consumption,8,9 weight reduction,3 physical activity,10 and smoking cessation.8 Some of these strategies are difficult to implement in practice. Moreover, in low-income countries, these interventions could be costly for the general population. Vegetable consumption may be an alternative for managing low HDL-C. Epidemiologic evidence indicates that a high consumption of vegetables reduces the risk of CVD,11 and particular attention has been paid to tomato-based products. Growing evidence from several epidemiological studies indicates that lycopene, the major carotenoid in tomatoes,12 might be more important than other carotenoids in preventing atherosclerosis and CVD.13,14 The consumption of more than seven servings per week of tomato-based products has been associated with a 30% reduction in the relative risk of CVD.15 Such potential benefits to vascular health from a tomato-rich diet could be related to a lowering of arterial intimal wall thickness,13,16 a reduction in levels of low-density lipoprotein cholesterol (LDL-C),17 and an inverse correlation with markers of inflammation and vascular endothelial dysfunction.18 However, HDL-C levels may also be positively influenced by tomato consumption. In a pilot study, we found that tomato juice consumption did not increase HDL-C after 1 month (unpublished data); this finding has also been reported previously.19 In contrast, another study has shown that the daily consumption of 300 g of uncooked tomatoes during 1 month significantly increased HDL-C levels by 15.2%.20 However, that study was not controlled, blinded, or randomized. Roma tomato consumption could be an accessible intervention to improve HDL-C levels; however, a longitudinal clinical trial is necessary to evaluate this association. Therefore, we performed a randomized, single-blinded, controlled clinical trial to specifically evaluate whether the consumption of two uncooked tomatoes per day (14 servings a week) during 1 month could produce a favorable effect on HDL-C. Our data suggest that raw tomato consumption can increase HDL-C levels in overweight women.
Subjects and methods
Ethics statement
This study was conducted according to the guidelines in the Declaration of Helsinki, and all procedures involving human patients were approved by our Institutional Human Research Ethics Committee (REF2039). Written informed consent was obtained from all patients after a full explanation of the purpose and nature of all procedures was provided.
Study subjects
Between March 1, 2009 and April 30, 2011, workers and patients from the Instituto Nacional de Ciencias Médicas y Nutrición Salvador Zubirán were invited to participate in the study. After participants had signed the informed consent, a complete fasting lipid profile was measured in all participants. Of 432 potentially eligible subjects, 66 (15.2%) fulfilled the inclusion criteria, defined as age between 18 years and 65 years, low HDL-C level (men <40 mg/dL and women <50 mg/dL), and a normal triglyceride concentration (<150 mg/dL). Exclusion criteria included a previous diagnosis of diabetes; arterial hypertension; renal, hepatic, or cardiac insufficiency; hyperuricemia; hyperandrogenic anovulation; thyroid dysfunction (hypothyroidism or hyperthyroidism); any difficulty in swallowing; or hospitalization in the previous 6 months. Additionally, subjects taking fibrates, statins, nicotinic acid, steroids, allopurinol, hormone replacement therapy (testosterone, estrogens, or progesterone), metformin or other oral hypoglycemic agents, insulin, sibutramine, orlistat, and nonsteroidal antiinflammatory drugs were also excluded (N = 366). Furthermore, 14 individuals who fulfilled the inclusion criteria declined to participate or were unable to participate because of acute illness or difficulty in attending the study visits (Figure 1). A final sample of 52 patients was randomized using a block-designed randomization system with sealed opaque envelopes for assignment.
Figure 1.
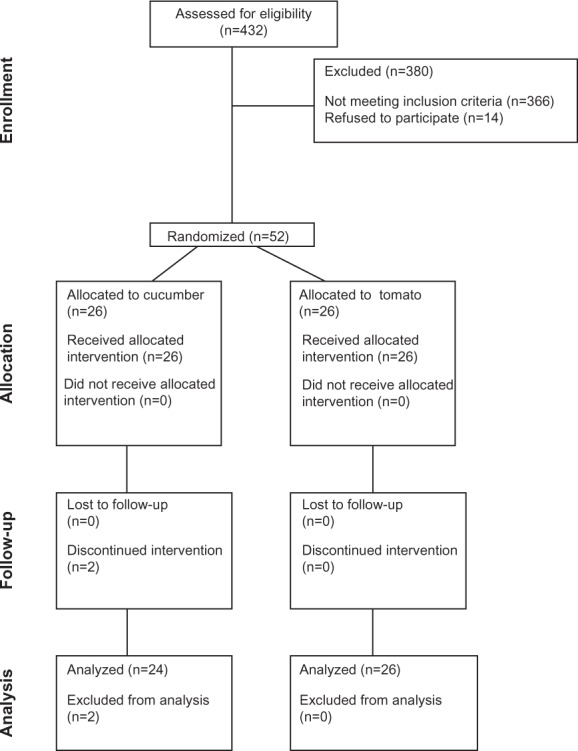
Flow chart of the study protocol.
Abbreviation: n, number of subjects.
Study design
This was a longitudinal, comparative, randomized, single-blinded, controlled clinical trial. The protocol included a 2-week run-in period with prescription of an isocaloric diet (50% carbohydrates, 20% proteins, and 30% fats). After completion of the run-in period, participants were randomized to consume 300 g of raw cucumber (control group) or the same amount of uncooked tomatoes (approximately two Roma tomatoes) a day. Patients were instructed to weigh and prepare the cucumber or the tomato at home. Participants were instructed to minimize changes in diet and daily habits, specifically physical activity and smoking. We used cucumber because (1) it was not possible to have a tomato placebo; (2) cucumber does not have any lycopene; (3) both can be consumed in a similar manner; and (4) the required quantity can be measured in the same way. After treatment assignment, we requested participants to avoid mentioning during clinical evaluations whether they were in the tomato or cucumber arm of the study. One blinded nutritionist performed the evaluations and the other evaluated adherence. No member of the research team knew the participant’s study group.
Clinical evaluation
Clinical evaluation consisted of a complete medical history and physical examination performed by one nurse and one physician unrelated to the study. Resting blood pressure was measured in the morning by a trained nurse using a mercury sphygmomanometer and after instructing participants to remain seated at rest for at least 10 minutes. We took the average of two measurements at every visit. Basal daily physical activity was evaluated with a questionnaire already validated in the Mexican population.21 The questionnaire quantifies the level of physical activity (kilocalories per day or in kilojoules if kilocalories are multiplied by 4.1855) over a 24-hour period as previously described.22 Every subject completed three questionnaires, recording the physical activity level over 2 workdays and 1 day of the weekend. These results were analyzed, and the average kilocalories per day and kilocalories per month were obtained. Smoking was classified as (1) current in those who smoked more than one cigarette per day (low: 1–14; moderate: 15–24; high: ≥25); (2) previous smoker (one or more cigarettes per day in the past); or (3) never smoked.
Nutritional evaluation and adherence
The anthropometric measurements were performed by a nutritionist blinded to the participant’s intervention. After participants removed their shoes and upper garments, body weight was quantified with a UM-026 Tanita body composition analyzer (Tanita Corporation, Tokyo, Japan). All subjects were instructed to stand on the central part of the scale during weight assessment. Height was obtained to the nearest 0.5 cm using a floor scale’s stadiometer with the patient standing on the central part of the scale. Body mass index (BMI) was calculated as weight (in kilograms) divided by height (in meters squared). Waist and hip circumferences were measured with patients standing with their feet together, placing their arms on their sides with the palms of their hands facing inward, and breathing out gently. Abdominal circumference was measured to the nearest 0.1 cm at the level of the greatest frontal extension of the abdomen between the bottom of the rib cage and the top of the iliac crest. Hip circumference was measured around the maximum circumference of the buttocks. In addition, nutritional evaluation consisted of three 24 hour food records for each patient at every visit. Consumption of carbohydrates, proteins, lipids, fiber, simple sugars, fish, omega-3 acids, and alcohol was calculated with standardized tables.23–26 Another nutritionist evaluated adherence, asking for the number of days per week that a given patient fully complied with tomato or cucumber consumption. Adherence was reinforced in every visit.
To detect small changes in weight, physical activity, and diet throughout the study duration, the clinical and nutritional evaluations were performed every week during the 6-week study period (Table S1). These measurements were averaged and used for statistical adjustment as needed.
Biochemical evaluation
Glucose and lipid profiles were measured at the screening visit and again at the end of follow-up. Laboratory measurements were performed in the Department of Endocrinology and Metabolism at the Instituto Nacional de Ciencias Médicas y Nutrición Salvador Zubirán using standardized procedures. The measurements were performed with commercially available standardized methods. Glucose was measured by the glucose oxidase method (Roche Diagnostics, Indianapolis, IN, USA); serum total cholesterol, triglycerides, HDL-C, and LDL-C levels were measured by an enzymatic method (Beckman Coulter, Inc, Brea, CA, USA). The coefficients of variation for total cholesterol and HDL-C were 3.3% and 2.5%, respectively.
Statistical analysis
The sample size was calculated with the formula for means for two-tailed comparisons. According to a previous report,20 we expected an increase of at least 6 mg/dL in HDL-C after 1 month of tomato consumption. With a standard deviation of 5 mg/dL, an alpha level of 0.05, and a study power of 80%, and adding 20% for potential losses, we calculated that a total of 48 subjects (24 per group) was required. Normally distributed data, determined with a Kolmogorov–Smirnov test, were expressed as means and standard deviation, whereas variables with a skewed distribution were reported as median and interquartile range. A χ2 test, Student’s unpaired t-test, Wilcoxon signed rank test, or Mann–Whitney U test was used as appropriate for comparison between groups. Homogeneity of variance was evaluated with Levene’s test. Correlation coefficients between HDL-C and dimensional variables were evaluated in all participants and were calculated with the Spearman’s rho or Pearson’s r tests. To evaluate the effect of tomato consumption on HDL-C, we used the difference between final and basal levels (indicated as “delta”). A stepwise linear regression model was used to examine the impact of variables on delta HDL-C levels. The variables selected for the regression analyses were those that correlated significantly or those that are known to be associated with plasma HDL-C levels. All reported P-values were based on two-sided tests, with P ≤ 0.05 considered significant. Analyses were performed with the Statistical Package for the Social Sciences version 17.0 (SPSS, Inc, Chicago, IL, USA).
Results
A total of 52 subjects were included in the study. They were randomized to receive tomato (N = 26) or cucumber (N = 26). Two patients were eliminated after 1 week of follow-up (for gastric intolerance and poor study compliance). Both requested to be excluded from the study. The remaining subjects completed 1 month of follow-up (Figure 1). The mean adherence per month was 27.6 ± 1.9 days and 27.5 ± 2.0 days in the tomato and cucumber groups, respectively (P = 0.90). A total of 47 (94%) of the subjects declared that they had followed the assigned intervention for ≥25 days during the month of follow-up (Table 1).
Table 1.
Characteristics of the population studied
| Parameter | Group
|
P-value | |
|---|---|---|---|
| Control (N = 24) | Tomato (N = 26) | ||
| Gender (female) | 19 (38) | 22 (44) | 0.72 |
| Age (years) | 40.3 ± 16.0 | 43.4 ± 15.5 | 0.49 |
| Weight (kg) | 69.2 ± 11.9 | 69.5 ± 14.6 | 0.93 |
| BMI (kg/m2) | 27.1 ± 4.0 | 27.1 ± 5.0 | 0.64 |
| Waist circumference (cm) | 90.1 ± 9.8 | 88.6 ± 9.7 | 0.96 |
| Hip circumference (cm) | 102.6 ± 8.0 | 101.8 ± 8.9 | 0.94 |
| Systolic pressure (mmhg) | 112.3 ± 19.3 | 107.5 ± 17.2 | 0.28 |
| Diastolic pressure (mmhg) | 74.9 ± 8.4 | 71.1 ± 10.0 | 0.16 |
| Smoking, n (%) | 0.34 | ||
| Never | 9 (19.1) | 14 (29.8) | |
| 1 to 14 per day | 6 (12.8) | 3 (6.4) | |
| More than 14 per day | 0 (0) | 0 (0) | |
| In the past | 8 (17.0) | 7 (14.9) | |
| Diet | |||
| Carbohydrates (%) | 49.6 ± 6.5 | 50.9 ± 6.5 | 0.50 |
| Simple sugars (%) | 13.8 ± 5.8 | 15.1 ± 6.6 | 0.49 |
| Fiber (%) | 25.2 ± 7.4 | 23.7 ± 4.4 | 0.38 |
| Fat (%) | 33.8 ± 5.5 | 33.1 ± 5.1 | 0.64 |
| Proteins (%) | 16.4 ± 2.4 | 15.8 ± 2.5 | 0.44 |
| Alcohol (g/month) | 3.5 ± 1.4 | 4.9 ± 1.5 | 0.83 |
| Fish (g/month) | 0.3 ± 0.06 | 0.4 ± 0.05 | 0.70 |
| Omega-3 (g/month) | 0.17 (0.0–0.96) | 0.61 (0.25–1.30) | 0.02 |
| Daily activity (kcal/month) | 658 (576.5–729.4) | 712 (643.1–826.1) | 0.31 |
| Adherence (days) | 0.85 | ||
| 21 | 1 (4.2) | 0 (0.0) | |
| 22 | 0 (0.0) | 1 (3.8) | |
| 24 | 1 (4.2) | 0 (0.0) | |
| 25 | 1 (4.2) | 2 (7.7) | |
| 26 | 2 (8.3) | 2 (7.7) | |
| 27 | 4 (16.7) | 4 (15.4) | |
| 28 | 8 (33.3) | 6 (23.1) | |
| 29 | 3 (12.5) | 5 (19.2) | |
| 30 | 4 (16.7) | 6 (23.1) | |
Notes: Data are presented as mean ± SD or median (interquartile range). Frequencies are expressed as N (%). Values represent the average from six weekly evaluations throughout the study (see supplementary table).
Abbreviations: N, number of subjects; BMI, body mass index.
Clinical and anthropometric characteristics
Table 1 shows the characteristics of the subjects studied. A total of 41 individuals (82%) were women. There were no significant differences between groups with respect to age (P = 0.49) or BMI (P = 0.64). We only identified a significantly higher consumption of omega-3 fatty acids in the tomato group (P = 0.02). During the study, the subjects’ anthropometric characteristics did not change significantly (Table 1). Table 2 shows the effect of tomato consumption on lipid profile and anthropometric measurements of the subjects categorized by group and gender.
Table 2.
Effect of tomato consumption on lipid profile and anthropometric measurements
| Parameter | Group
|
|||||
|---|---|---|---|---|---|---|
| Tomato (N = 26)
|
Control (N = 24)
|
|||||
| Baseline | Final | P-value | Baseline | Final | P-value | |
| HDL-C | 36.5 ± 7.5 | 41.6 ± 6.9 | <0.0001 | 36.8 ± 7.2 | 35.8 ± 7.3 | 0.08 |
| Men | 32.0 ± 4.3 | 37.3 ± 2.0 | 0.06 | 32.6 ± 5.4 | 32.2 ± 6.7 | 0.62 |
| Women | 37.5 ± 6.2 | 42.3 ± 7.2 | <0.0001 | 38.06 ± 7.5 | 36.8 ± 7.3 | 0.10 |
| Triglycerides | 113.4 ± 46.4 | 122.7 ± 21.8 | 0.18 | 107.5 ± 36.3 | 106.9 ± 41.5 | 0.89 |
| Men | 110 (51.0–140.7) | 133 (42.0–136.0) | 0.88 | 103.0 (77.5–113.5) | 104.0 (66.5–145.5) | 0.68 |
| Women | 107.5 (77.7–120.0) | 110.0 (82.5–165.7) | 0.12 | 119.0 (73.0–131.0) | 101.0 (66.0–127.7) | 0.28 |
| Cholesterol | 165.9 ± 44.7 | 169.7 ± 39.7 | 0.62 | 162.5 ± 31.0 | 159.9 ± 33.2 | 0.41 |
| Men | 132.0 ± 70.1 | 139.6 ± 76.2 | 0.44 | 157.0 ± 39.1 | 160.2 ± 36.2 | 0.61 |
| Women | 172.0 ± 41.2 | 174.2 ± 32.5 | 0.74 | 164.11 ± 29.5 | 159.8 ± 33.4 | 0.26 |
| LDL-C | 108.1 ± 38.1 | 104.5 ± 31.0 | 0.63 | 103.2 ± 28.0 | 104.3 ± 30.0 | 0.71 |
| Men | 63 (44.9–111.5) | 67 (34.0–154.0) | 0.59 | 101.2 ± 37.0 | 103.2 ± 28.9 | 0.79 |
| Women | 112.6 ± 37.6 | 107.6 ± 24.9 | 0.53 | 103.8 ± 26.4 | 104.7 ± 31.1 | 0.80 |
| BMI (kg/m2) | 27.1 ± 5.0 | 27.0 ± 4.9 | 0.21 | 27.1 ± 4.0 | 26.9 ± 4.2 | 0.32 |
| Men | 26.4 ± 4.5 | 26.4 ± 4.1 | 0.87 | 25.8 ± 3.5 | 25.7 ± 2.9 | 0.69 |
| Women | 27.2 ± 5.1 | 27.1 ± 5.2 | 0.15 | 27.5 ± 4.2 | 27.2 ± 4.6 | 0.37 |
| WC (cm) | 88.6 ± 9.7 | 88.0 ± 10.6 | 0.38 | 90.1 ± 9.8 | 90.8 ± 10.4 | 0.11 |
| Men | 90.1 ± 6.0 | 90.1 ± 2.2 | 0.98 | 92.1 ± 9.9 | 92.5 ± 9.3 | 0.57 |
| Women | 88.3 ± 10.2 | 87.7 ± 11.3 | 0.30 | 89.6 ± 10.0 | 90.3 ± 10.8 | 0.15 |
| HC (cm) | 101.8 ± 8.9 | 101.6 ± 9.4 | 0.66 | 102.6 ± 8.0 | 102.7 ± 7.9 | 0.66 |
| Men | 99.0 ± 7.1 | 98.5 ± 5.8 | 0.67 | 97.9 ± 6.7 | 98.4 ± 5.8 | 0.43 |
| Women | 102.2 ± 9.2 | 102.1 ± 9.9 | 0.77 | 104.0 ± 8.0 | 104.0 ± 8.1 | 0.93 |
| WHR | 0.86 ± 0.05 | 0.86 ± 0.05 | 0.47 | 0.88 ± 0.07 | 0.88 ± 0.07 | 0.18 |
| Men | 0.92 ± 0.0 | 0.91 ± 0.0 | 0.65 | 0.94 ± 0.0 | 0.93 ± 0.0 | 0.21 |
| Women | 0.86 ± 0.0 | 0.85 ± 0.0 | 0.54 | 0.86 ± 0.0 | 0.87 ± 0.0 | 0.01 |
Abbreviations: N, number of subjects; HDL-C, high-density lipoprotein cholesterol; LDL-C, low-density lipoprotein cholesterol; BMI, body mass index; WC, waist circumference; HC, hip circumference; WHR, waist-to-hip ratio.
Changes in lipid profile
Baseline values of HDL-C (36.5 ± 7.5 mg/dL versus 36.8 ± 7.2 mg/dL, P = 0.83) and triglyceride levels (113.4 ± 46.4 mg/dL versus 108.5 ± 36.9 mg/dL, P = 0.54) were similar between groups. Additionally, at baseline, serum triglycerides (P = 0.77), total cholesterol (P = 0.82), and LDL-C (P = 0.37) were not different between groups (Table 2). After 1 month of intervention, a significant increment of HDL-C levels from 36.5 ± 7.5 mg/dL to 41.6 ± 6.96 mg/dL (P < 0.0001) was observed in the group assigned to tomato consumption (Table 2). The mean increment of HDL-C was 5.0 ± 2.8 mg/dL (range 1–12 mg/dL). Levels of triglycerides, LDL-C, and total cholesterol did not change significantly. Adherence correlated positively with the HDL-C increment in the tomato group (r = 0.34, P = 0.01). This association was not identified with cucumber consumption (r = 0.08, P = 0.71; Figure 2). Figure 3 shows the change in HDL-C levels according to days of adherence (Figure 3A) and in every case studied (Figure 3B).
Figure 2.
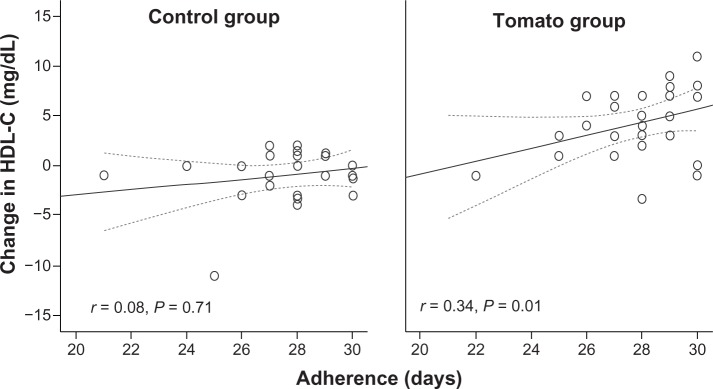
Correlation between the change in HDL-C levels and the number of days reported with complete adherence to cucumber (control group) or tomato consumption.
Note: Dotted lines represent a 95% confidence interval.
Abbreviation: HDL-C, high-density lipoprotein cholesterol.
Figure 3.
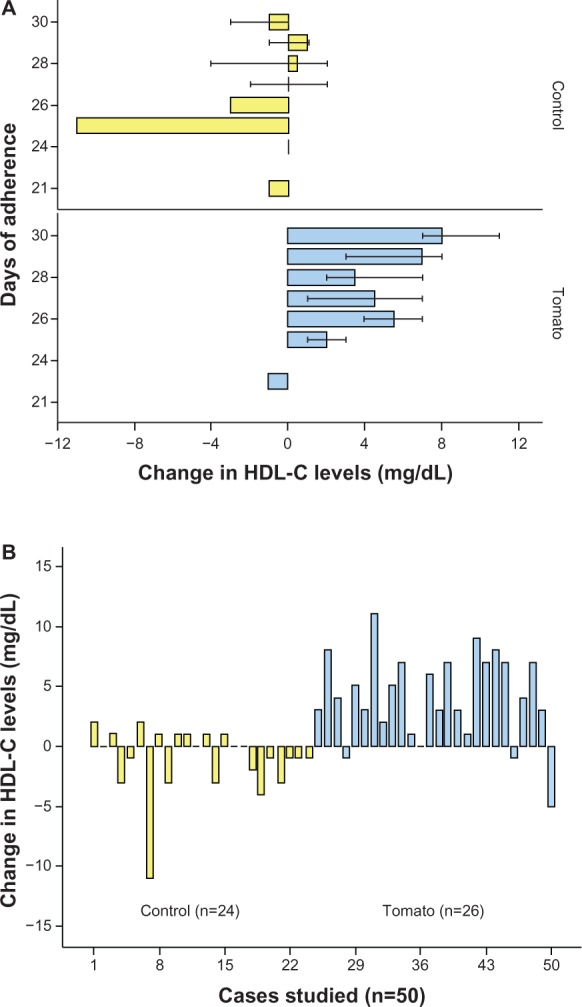
Change in HDL-C after tomato or cucumber consumption.
Notes: (A) Change in HDL-C levels according to days of adherence. The number of subjects is described in Table 1. (B) Change in HDL-C levels for every case studied (Student’s t-test, P < 0.0001).
Abbreviations: HDL-C, high-density lipoprotein cholesterol; n, number of subjects.
Independent predictors of HDL-C increment
To identify independent factors related to the change in HDL-C, we performed a linear regression model using the delta (final-basal) HDL-C level as the dependent variable, adjusted for those variables that could change HDL-C (Table 3). Results showed that tomato consumption (β = 5.79, 95% confidence interval [CI] 3.99–7.59; P < 0.0001) and days of adherence (β = 0.61, 95% CI 0.12-1.11; P = 0.01) were independently and significantly associated with the increment in HDL-C levels (F = 5.20; r = 0.83; r2 = 0.69; P < 0.0001).
Table 3.
Linear regression model to evaluate the independent parameters associated with the increment of HDL-C
| Parameter | β ± SE | 95% CI | P-value |
|---|---|---|---|
| Tomato | 5.79 ± 0.88 | 3.99–7.59 | <0.0001 |
| Adherence | 0.61 ± 0.24 | 0.12–1.11 | 0.01 |
| Smoking | −0.29 ± 0.33 | −0.97 to 0.38 | 0.38 |
| Age | 0.014 ± 0.04 | −0.08 to 0.11 | 0.77 |
| Gender | −1.07 ± 1.80 | −4.74 to 2.60 | 0.55 |
| WHR | 7.66 ± 9.02 | −10.73 to 26.05 | 0.40 |
| Triglycerides | −0.01 ± 0.01 | −0.03 to 0.01 | 0.46 |
| BMI | 0.05 ± 0.12 | −0.20 to 0.31 | 0.66 |
| Physical activity | −0.001 ± 0.002 | −0.004 to 0.002 | 0.45 |
| Omega-3 | 0.13 ± 0.19 | −0.26 to 0.52 | 0.49 |
| Alcohol | 0.01 ± 0.07 | −0.13 to 0.17 | 0.81 |
| Simple sugars | −0.06 ± 0.07 | −0.22 to 0.08 | 0.39 |
| Fish | 0.38 ± 2.00 | −3.69 to 4.46 | 0.84 |
Notes: Parameters of the model: F = 5.20; r = 0.83; r2 = 0.69; P < 0.0001.
Abbreviations: HDL-C, high-density lipoprotein cholesterol; SE, standard error; CI, confidence interval; WHR, waist-to-hip ratio; BMI, body mass index.
Discussion
The occidental diet is usually composed of high-glycemic-index and high-fat foods and has been associated with the development of chronic diseases, including CVDs, cancer, and diabetes.27 In contrast, the consumption of tomato-based food sources along with fresh fruit, vegetables, and olive oil is common in a Mediterranean dietary pattern and provides a variety of nutrients with potential cardiovascular benefits.28 However, investigation regarding the association between tomato-based food intake and CVD risk has demonstrated contradictory results. Previous studies have focused on carotenoids, including lycopene, and their association with either atherosclerosis, different CVD subtypes, or multiple cardiovascular risk factors.28–32 Ascherio et al33 reported no association between dietary lycopene and stroke in a large cohort of healthy male professionals. In contrast, Karppi et al34 recently reported a 59% lower risk of ischemic stroke associated with tomato consumption. These inconsistent results may be explained by the following: (1) the considerable variation in the estimation of lycopene intake depending on the assessment tools used;12 (2) differing absorption, probably because carotenoids are tightly bound to macromolecules in foods, and therefore, their absorption may vary;35 (3) differing availability of lycopene, because this depends on the processing and treatment of the food containing the carotenoid and on the fat content of the meal in which lycopene is consumed;12 or (4) because some studies analyze the effect of different sources of dietary tomato in combination, including both healthy and unhealthy foods (for example, pizza, tomato juice, and fresh tomatoes).19,32 Furthermore, the relationship between the estimated intake and serum lycopene levels is very poor, with Pearson’s correlation coefficients between 0.1 and 0.3.35,36 For example, one study reported a low correlation between dietary lycopene levels and plasma lycopene levels. Despite this fact, the authors confirmed a 30% reduction in the relative risk of CVD.15 With this information in mind, we aimed to evaluate the change in HDL-C after 1 month of adding two Roma tomatoes daily to the participants’ regular diet. This intervention was planned to reduce the variability of a tomato-based diet using only fresh uncooked tomatoes. We used uncooked tomato because in a pilot study, we did not identify any significant change in HDL-C using additional methods of preparation (cooked, juiced, or in sauce), a finding that has been reported previously.19 In contrast, an uncontrolled, nonrandomized prospective study reported that the daily consumption of 300 g of uncooked tomatoes for 1 month significantly increased HDL-C levels by 15.2%.20 After taking into consideration other variables that could increase HDL-C, the beta value in the linear regression model analysis indicated that we could expect a mean increment of 5.79 mg/dL in HDL-C after the consumption of two daily Roma tomatoes over a 1-month period. The increment in HDL-C levels was independent of these and other parameters that are known to modify the circulating HDL-C concentration (Table 3). Furthermore, the increment in HDL-C levels in the group allocated to tomato consumption showed a direct relationship with compliance. Although mean alcohol, fish, and omega-3 fatty acid consumption was higher in the tomato group at follow-up, these differences were not significant (Table 1). The randomized and blinded design of our clinical study suggests that this variation was by chance, and the regression analysis results strongly suggest that the increment in HDL-C was mainly attributable to fresh tomato consumption. Although the increase in HDL-C was not significant in men, a statistical trend was seen (P = 0.06). We therefore conclude that overweight women can benefit from daily fresh tomato consumption. To the best of our knowledge, this is the first clinical trial that specifically evaluates the impact of fresh tomato consumption on HDL-C levels.
According to our results, an intake of 14 servings of fresh tomato per week may have a similar positive impact (increment between 3.9 mg/dL and 7.5 mg/dL; Table 3) on HDL-C as physical activity (3.0–3.5 mg/dL), but a smaller effect than alcohol consumption (9.0–13.1 mg/dL) or smoking cessation (9.9 mg/dL).8 Nevertheless, consumption of uncooked tomato could be recommended as an additional strategy to increase HDL-C levels. The advantage of fresh tomato consumption is the fact that tomato is available worldwide, and in low-income countries, it may be an additional affordable strategy for populations with low HDL-C levels.
The underlying mechanism of the increase in HDL-C with raw tomato may or may not be related to lycopene. Fuhrman et al37 showed that 60 mg of lycopene per day for 3 months in six men (approximately equivalent to the amount of lycopene in 1 kg of tomatoes) caused a 14% reduction in plasma LDL-C with no significant change in HDL-C. However, only a small sample of patients was analyzed, not necessarily with enough statistical power to show a difference in HDL-C after the intervention. Recently, lycopene has been shown to yield improvement in HDL-C functionality, with increases in HDL-C subtypes 2 and 3 after a lycopene-rich diet and supplements. The activity of cholesteryl ester transfer protein decreased and the activity of lecithin cholesterol acyltransferase increased in the serum of overweight, middle-aged individuals.38 Although the bioavailability of lycopene is higher after tomatoes are processed, for example, as a paste, and less bioavailability is seen with raw tomato,39,40 the results of a study by McEneny et al38 suggest that the benefit of raw tomato consumption in serum HDL-C levels reported here could be explained by regulation of the activity of key enzymes in HDL-C metabolism and could also be associated with the improvement in HDL-C functionality after lycopene consumption. Nevertheless, we cannot confirm this hypothesis in the present study, and we cannot rule out the possible role of other unidentified nutrients or beta-carotenes.
Although we showed a significant elevation of HDL-C levels after 1 month of tomato consumption, only two women normalized their level to 50 mg/dL or more, and no men achieved normal levels (≥40 mg/dL). However, 20 patients (40%) finished the study with levels >40 mg/dL. Studies have shown that increasing the concentration of HDL-C can slow and even reverse the progression of coronary atherosclerosis and can reduce cardiovascular risk in the majority of people with dyslipidemia even if normalization has not been achieved.41 However, it is necessary to assess whether the consumption of tomatoes for longer periods of time or at higher daily amounts can normalize HDL-C levels in a greater proportion of patients. Future prospective studies should evaluate the impact of fresh tomato consumption on different cardiovascular risk factors and outcomes. These studies may also confirm the benefit in men.
The main limitation of the present study is that we cannot describe the mechanism of how fresh tomato consumption increases HDL-C. Second, we evaluated compliance subjectively; however, participants in both groups reported similar adherence to blinded researchers. Also, the number of male patients studied was small, which may explain the lack of significant associations. Another limitation is the fact that we cannot completely rule out the influence of other nutrients, foods, or cointerventions by participants, and this may provide alternative explanations for our findings. However, the randomized and longitudinal design of our study, the absence of loss to follow-up, and the fact that we adjusted the analyses for the main confounding factors that influence HDL-C levels suggest that the increment in HDL-C was caused by the increase in tomato consumption. An additional strength of the study design is that we evaluated patients without hypertriglyceridemia, and patients without treatments that may influence HDL levels.
Conclusion
In conclusion, raw tomato consumption (14 servings a week for 1 month) showed a favorable effect on HDL-C levels in overweight women.
Supplementary table
Clinical and nutritional characteristics of the population studied throughout the study
| Weekly visits | Groups
|
P-value* | |||||||||||
|---|---|---|---|---|---|---|---|---|---|---|---|---|---|
| Control (N = 24)
|
Tomato (N = 26)
|
||||||||||||
| 1 | 2 | 3 | 4 | 5 | 6 | 1 | 2 | 3 | 4 | 5 | 6 | ||
| Clinical evaluation | |||||||||||||
| Weight (kg) | 69.7 ± 11.8 | 69.9 ± 11.9 | 69.7 ± 11.7 | 69.9 ± 12.0 | 69.7 ± 11.9 | 69.1 ± 12.5 | 67.8 ± 12.6 | 69.0 ± 12.4 | 69.0 ± 12.3 | 69.0 ± 12.4 | 67.7 ± 12.4 | 67.6 ± 12.6 | 0.76 |
| BMI (kg/m2) | 26.9 ± 4.1 | 27.1 ± 4.1 | 27.0 ± 4.0 | 27.0 ± 4.2 | 26.9 ± 4.1 | 26.9 ± 4.2 | 27.6 ± 5.0 | 27.6 ± 4.9 | 27.7 ± 4.8 | 27.7 ± 4.9 | 27.6 ± 4.9 | 27.6 ± 4.9 | 0.78 |
| WC (cm) | 89.4 ± 10.0 | 89.6 ± 9.9 | 90.2 ± 10.5 | 90.1 ± 10.7 | 89.9 ± 9.9 | 89.9 ± 9.9 | 89.8 ± 9.7 | 89.8 ± 9.8 | 89.9 ± 10.5 | 89.9 ± 10.0 | 88.9 ± 10.4 | 88.5 ± 10.6 | 0.30 |
| HC (cm) | 102.4 ± 8.1 | 102.3 ± 8.0 | 102.1 ± 8.1 | 102.3 ± 8.1 | 102.3 ± 7.9 | 102.4 ± 7.9 | 102.5 ± 9.0 | 102.8 ± 8.4 | 102.7 ± 9.2 | 102.9 ± 9.6 | 102.2 ± 9.2 | 102.3 ± 9.5 | 0.19 |
| SBP (mmhg) | 95.7 ± 5.3 | 98.5 ± 10.6 | 100.0 ± 10.0 | 98.5 ± 12.1 | 97.1 ± 9.5 | 97.1 ± 13.8 | 105.3 ± 12.8 | 103.0 ± 13.0 | 101.0 ± 11.1 | 100.0 ± 11.2 | 100.7 ± 16.0 | 101.6 ± 12.1 | 0.32 |
| DBP (mmhg) | 67.1 ± 7.5 | 72.8 ± 7.5 | 70.0 ± 8.1 | 71.4 ± 10.6 | 68.5 ± 8.9 | 70.0 ± 10.0 | 67.2 ± 8.3 | 68.2 ± 7.6 | 68.4 ± 8.0 | 70.0 ± 10 | 70.0 ± 10 | 71.1 ± 10.7 | 0.76 |
| Nutritional evaluation | |||||||||||||
| Carbohydrates (%) | – | 51.1 ± 8.5 | 50.1 ± 8.7 | 50.1 ± 6.4 | 48.6 ± 7.3 | 49.5 ± 9.3 | – | 52.3 ± 7.6 | 49.8 ± 7.6 | 50.8 ± 7.9 | 50.9 ± 8.3 | 50.9 ± 7.5 | 0.81 |
| Sugars (%) | – | 15.7 ± 8.0 | 13.5 ± 7.4 | 13.2 ± 7.0 | 12.4 ± 6.1 | 13.4 ± 6.5 | – | 15.7 ± 8.0 | 14.3 ± 7.5 | 15.3 ± 7.8 | 15.5 ± 7.0 | 14.6 ± 7.2 | 0.43 |
| Fiber (g) | – | 23.3 ± 10.1 | 26.6 ± 8.6 | 25.6 ± 7.2 | 25.2 ± 7.4 | 25.8 ± 7.7 | – | 22.7 ± 8.0 | 25.2 ± 7.6 | 25.4 ± 6.7 | 24.4 ± 7.4 | 24.6 ± 7.0 | 0.70 |
| Fat (%) | – | 32.9 ± 7.6 | 33.3 ± 6.9 | 33.2 ± 6.0 | 34.1 ± 7.3 | 34.7 ± 7.8 | – | 32.5 ± 6.1 | 33.8 ± 6.1 | 33.0 ± 5.7 | 33.3 ± 7.5 | 32.8 ± 6.5 | 0.78 |
| Proteins (%) | – | 15.8 ± 2.6 | 16.3 ± 3.1 | 16.5 ± 3.4 | 17.1 ± 2.8 | 15.7 ± 3.1 | – | 15.1 ± 2.8 | 16.2 ± 2.9 | 16.0 ± 3.3 | 15.7 ± 2.9 | 16.1 ± 3.1 | 0.24 |
| Alcohol (g/week) | – | 4.7 ± 1.3 | 3.0 ± 0.9 | 3.6 ± 2.8 | 2.3 ± 1.3 | 3.8 ± 1.1 | – | 6.4 ± 1.4 | 2.0 ± 1.6 | 7.6 ± 1.9 | 6.4 ± 1.2 | 2.3 ± 1.6 | 0.57 |
| Fish (g/week) | – | 0.30 ± 0.07 | 0.26 ± 0.04 | 0.34 ± 0.08 | 0.30 ± 0.07 | 0.30 ± 0.07 | – | 0.36 ± 0.04 | 0.40 ± 0.05 | 0.50 ± 0.05 | 0.45 ± 0.05 | 0.40 ± 0.05 | 0.98 |
| Omega-3 (g/week) | – | 0.38 ± 0.2 | 0.22 ± 0.04 | 0.25 ± 0.06 | 0.19 ± 0.04 | 0.81 ± 0.2 | – | 0.40 ± 0.05 | 0.30 ± 0.06 | 1.1 ± 0.5 | 0.56 ± 0.7 | 0.48 ± 0.07 | 0.25 |
Notes: Data represent the mean ± SD.
P-values using repeated-measures analysis of variance. Visit 1 was screening. Treatment started on visit 2 and ended on visit 6.
Abbreviations: N, number of subjects; BMI, body mass index; WC, waist circumference; HC, hip circumference; SBP, systolic blood pressure; DBP, diastolic blood pressure; SD, standard deviation.
Acknowledgment
This trial is registered with ClinicalTrials.gov, clinical trial registration number NCT01342666.
Footnotes
Disclosure
The authors report no conflicts of interest in this work.
References
- 1.Roger VL, Go AS, Lloyd-Jones DM, et al. American Heart Association Statistics Committee and Stroke Statistics Subcommittee Heart disease and stroke statistics – 2011 update: a report from the American Heart Association. Circulation. 2011;123(4):e18–e209. doi: 10.1161/CIR.0b013e3182009701. [DOI] [PMC free article] [PubMed] [Google Scholar]
- 2.Bruckert E. Epidemiology of low HDL-cholesterol: results of studies and surveys. Eur Heart J Suppl. 2006;8(Suppl F):F17–F22. [Google Scholar]
- 3.National Cholesterol Education Program (NCEP) Expert Panel on Detection, Evaluation, and Treatment of High Blood Cholesterol in Adults (Adult Treatment Panel III) Third report of the National Cholesterol Education Program (NCEP) Expert Panel on Detection, Evaluation, and Treatment of High Blood Cholesterol in Adults (Adult Treatment Panel III) final report. Circulation. 2002;106(25):3143–3421. [PubMed] [Google Scholar]
- 4.Garrison RJ, Kannel WB, Feinleib M, Castelli WP, McNamara PM, Padgett SJ. Cigarette smoking and HDL cholesterol: the Framingham offspring study. Atherosclerosis. 1978;30(1):17–25. doi: 10.1016/0021-9150(78)90149-1. [DOI] [PubMed] [Google Scholar]
- 5.Castelli WP. Epidemiology of triglycerides: a view from Framingham. Am J Cardiol. 1992;70(19):3H–9H. doi: 10.1016/0002-9149(92)91083-g. [DOI] [PubMed] [Google Scholar]
- 6.Pinto Pereira SM, Ki M, Power C. Sedentary behaviour and biomarkers for cardiovascular disease and diabetes in mid-life: the role of television-viewing and sitting at work. PLoS ONE. 2012;7(2):e31132. doi: 10.1371/journal.pone.0031132. [DOI] [PMC free article] [PubMed] [Google Scholar]
- 7.Aguilar-Salinas CA, Olaiz G, Valles V, et al. High prevalence of low HDL cholesterol concentrations and mixed hyperlipidemia in a Mexican nationwide survey. J Lipid Res. 2001;42(8):1298–1307. [PubMed] [Google Scholar]
- 8.Ellison RC, Zhang Y, Qureshi MM, et al. Investigators of the NHLBI Family Heart Study Lifestyle determinants of high-density lipoprotein cholesterol: the National Heart, Lung, and Blood Institute Family Heart Study. Am Heart J. 2004;147(3):529–535. doi: 10.1016/j.ahj.2003.10.033. [DOI] [PubMed] [Google Scholar]
- 9.Harris WS. Fish oils and plasma lipid and lipoprotein metabolism in humans: a critical review. J Lipid Res. 1989;30(6):785–807. [PubMed] [Google Scholar]
- 10.Stein RA, Michielli DW, Glantz MD, et al. Effects of different exercise training intensities on lipoprotein cholesterol fractions in healthy middle-aged men. Am Heart J. 1990;119(2 Pt 1):277–283. doi: 10.1016/s0002-8703(05)80017-1. [DOI] [PubMed] [Google Scholar]
- 11.Ness AR, Powles JW. Fruits and vegetables, and cardiovascular disease: a review. Int J Epidemiol. 1997;26(1):1–13. doi: 10.1093/ije/26.1.1. [DOI] [PubMed] [Google Scholar]
- 12.Clinton SK. Lycopene: chemistry, biology, and implications for human health and disease. Nutr Rev. 1998;56(2 Pt 1):35–51. doi: 10.1111/j.1753-4887.1998.tb01691.x. [DOI] [PubMed] [Google Scholar]
- 13.Kohlmeier L, Kark JD, Gomez-Gracia E, et al. Lycopene and myocardial infarction risk in the EURAMIC Study. Am J Epidemiol. 1997;146(8):618–626. doi: 10.1093/oxfordjournals.aje.a009327. [DOI] [PubMed] [Google Scholar]
- 14.Mordente A, Guantario B, Meucci E, et al. Lycopene and cardiovascular diseases: an update. Curr Med Chem. 2011;18(8):1146–1163. doi: 10.2174/092986711795029717. [DOI] [PubMed] [Google Scholar]
- 15.Sesso HD, Liu S, Gaziano JM, Buring JE. Dietary lycopene, tomato-based food products and cardiovascular disease in women. J Nutr. 2003;133(7):2336–2341. doi: 10.1093/jn/133.7.2336. [DOI] [PubMed] [Google Scholar]
- 16.Rissanen T, Voutilainen S, Nyyssönen K, Salonen R, Salonen JT. Low plasma lycopene concentration is associated with increased intima-media thickness of the carotid artery wall. Arterioscler Thromb Vasc Biol. 2000;20(12):2677–2681. doi: 10.1161/01.atv.20.12.2677. [DOI] [PubMed] [Google Scholar]
- 17.Silaste ML, Alfthan G, Aro A, Kesäniemi YA, Hörkkö S. Tomato juice decreases LDL cholesterol levels and increases LDL resistance to oxidation. Br J Nutr. 2007;98(6):1251–1258. doi: 10.1017/S0007114507787445. [DOI] [PubMed] [Google Scholar]
- 18.Hozawa A, Jacobs DR, Steffes MW, Gross MD, Steffen LM, Lee DH. Relationships of circulating carotenoid concentrations with several markers of inflammation, oxidative stress, and endothelial dysfunction: the Coronary Artery Risk Development in Young Adults (CARDIA)/Young Adult Longitudinal Trends in Antioxidants (YALTA) study. Clin Chem. 2007;53(3):447–455. doi: 10.1373/clinchem.2006.074930. [DOI] [PMC free article] [PubMed] [Google Scholar]
- 19.García-Alonso FJ, Jorge-Vidal V, Ros G, Periago MJ. Effect of consumption of tomato juice enriched with n-3 polyunsaturated fatty acids on the lipid profile, antioxidant biomarker status, and cardiovascular disease risk in healthy women. Eur J Nutr. 2012;51(4):415–424. doi: 10.1007/s00394-011-0225-0. [DOI] [PubMed] [Google Scholar]
- 20.Blum A, Merei M, Karem A, et al. Effects of tomatoes on the lipid profile. Clin Invest Med. 2006;29(5):298–300. [PubMed] [Google Scholar]
- 21.López-Alvarenga JC, Reyes-Díaz S, Castillo-Martínez L, Dávalos-Ibáñez A, González-Barranco J. Reproducibility and sensitivity of a questionnaire on physical activity in a Mexican population. Salud Publica Mex. 2001;43(4):306–312. Spanish. [PubMed] [Google Scholar]
- 22.Cuevas-Ramos D, Almeda-Valdes P, Gómez-Pérez FJ, et al. Daily physical activity, fasting glucose, uric acid, and body mass index are independent factors associated with serum fibroblast growth factor 21 levels. Eur J Endocrinol. 2010;163(3):469–477. doi: 10.1530/EJE-10-0454. [DOI] [PubMed] [Google Scholar]
- 23.Hepburn FN, Exler J, Weihrauch JL. Provisional tables on the content of omega-3 fatty acids and other fat components of selected foods. J Am Diet Assoc. 1986;86(6):788–793. [PubMed] [Google Scholar]
- 24.Franz MJ, Barr P, Holler H, Powers MA, Wheeler ML, Wylie-Rosett J. Exchange lists: revised 1986. J Am Diet Assoc. 1987;87(1):28–34. [PubMed] [Google Scholar]
- 25.Anderson JW. [Nutrition treatment of diabetes mellitus] Tratamiento nutricional de la diabetes mellitus. In: Shils ME, editor. Nutrición en Salud y Enfermedad. México: McGraw-Hill; 1999. pp. 1577–1613. Spanish. [Google Scholar]
- 26.Franz MJ. Medical nutrition therapy for diabetes mellitus and hypoglycemia of nondiabetic origin. In: Mahan LK, Escott-Stump S, Raymond JL, editors. Krause’s Food and the Nutrition Care Process. St Louis, MO: Elsevier Saunders; 2011. pp. 675–710. [Google Scholar]
- 27.Heidemann C, Schulze MB, Franco OH, van Dam RM, Mantzoros CS, Hu FB. Dietary patterns and risk of mortality from cardiovascular disease, cancer, and all causes in a prospective cohort of women. Circulation. 2008;118(3):230–237. doi: 10.1161/CIRCULATIONAHA.108.771881. [DOI] [PMC free article] [PubMed] [Google Scholar]
- 28.Estruch R, Ros E, Salas-Salvadó J, et al. PREDIMED Study Investigators Primary prevention of cardiovascular disease with a Mediterranean diet. N Engl J Med. 2013;368(14):1279–1290. doi: 10.1056/NEJMoa1200303. [DOI] [PubMed] [Google Scholar]
- 29.Iribarren C, Folsom AR, Jacobs DR, Jr, Gross MD, Belcher JD, Eckfeldt JH. Association of serum vitamin levels, LDL susceptibility to oxidation, and autoantibodies against MDA-LDL with carotid atherosclerosis. A case-control study. The ARIC Study Investigators: Atherosclerosis Risk in Communities. Arterioscler Thromb Vasc Biol. 1997;17(6):1171–1177. doi: 10.1161/01.atv.17.6.1171. [DOI] [PubMed] [Google Scholar]
- 30.Street DA, Comstock GW, Salkeld RM, Schuep W, Klag MJ. Serum antioxidants and myocardial infarction. Are low levels of carotenoids and alpha-tocopherol risk factors for myocardial infarction? Circulation. 1994;90(3):1154–1161. doi: 10.1161/01.cir.90.3.1154. [DOI] [PubMed] [Google Scholar]
- 31.Rissanen TH, Voutilainen S, Nyyssönen K, et al. Low serum lycopene concentration is associated with an excess incidence of acute coronary events and stroke: the Kuopio Ischaemic Heart Disease Risk Factor Study. Br J Nutr. 2001;85(6):749–754. doi: 10.1079/bjn2001357. [DOI] [PubMed] [Google Scholar]
- 32.Thies F, Masson LF, Rudd A, et al. Effect of a tomato-rich diet on markers of cardiovascular disease risk in moderately overweight, disease-free, middle-aged adults: a randomized controlled trial. Am J Clin Nutr. 2012;95(5):1013–1022. doi: 10.3945/ajcn.111.026286. [DOI] [PubMed] [Google Scholar]
- 33.Ascherio A, Rimm EB, Hernán MA, et al. Relation of consumption of vitamin E, vitamin C, and carotenoids to risk for stroke among men in the United States. Ann Intern Med. 1999;130(12):963–970. doi: 10.7326/0003-4819-130-12-199906150-00003. [DOI] [PubMed] [Google Scholar]
- 34.Karppi J, Laukkanen JA, Sivenius J, Ronkainen K, Kurl S. Serum lycopene decreases the risk of stroke in men: a population-based follow-up study. Neurology. 2012;79(15):1540–1547. doi: 10.1212/WNL.0b013e31826e26a6. [DOI] [PubMed] [Google Scholar]
- 35.Zhou JR, Gugger ET, Erdman JW. The crystalline form of carotenes and the food matrix in carrot root decrease the relative bioavailability of beta- and alpha-carotene in the ferret model. J Am Coll Nutr. 1996;15(1):84–91. doi: 10.1080/07315724.1996.10718569. [DOI] [PubMed] [Google Scholar]
- 36.Ascherio A, Stampfer MJ, Colditz GA, Rimm EB, Litin L, Willett WC. Correlations of vitamin A and E intakes with the plasma concentrations of carotenoids and tocopherols among American men and women. J Nutr. 1992;122(9):1792–1801. doi: 10.1093/jn/122.9.1792. [DOI] [PubMed] [Google Scholar]
- 37.Fuhrman B, Elis A, Aviram M. Hypocholesterolemic effect of lycopene and beta-carotene is related to suppression of cholesterol synthesis and augmentation of LDL receptor activity in macrophages. Biochem Biophys Res Commun. 1997;233(3):658–662. doi: 10.1006/bbrc.1997.6520. [DOI] [PubMed] [Google Scholar]
- 38.McEneny J, Wade L, Young IS, et al. Lycopene intervention reduces inflammation and improves HDL functionality in moderately overweight middle-aged individuals. J Nutr Biochem. 2013;24(1):163–168. doi: 10.1016/j.jnutbio.2012.03.015. [DOI] [PubMed] [Google Scholar]
- 39.Gärtner C, Stahl W, Sies H. Lycopene is more bioavailable from tomato paste than from fresh tomatoes. Am J Clin Nutr. 1997;66(1):116–122. doi: 10.1093/ajcn/66.1.116. [DOI] [PubMed] [Google Scholar]
- 40.Campbell DR, Gross MD, Martini MC, Grandits GA, Slavin JL, Potter JD. Plasma carotenoids as biomarkers of vegetable and fruit intake. Cancer Epidemiol Biomarkers Prev. 1994;3(6):493–500. [PubMed] [Google Scholar]
- 41.Barter P, Gotto AM, LaRosa JC, et al. Treating to New Targets Investigators HDL cholesterol, very low levels of LDL cholesterol, and cardiovascular events. N Engl J Med. 2007;357(13):1301–1310. doi: 10.1056/NEJMoa064278. [DOI] [PubMed] [Google Scholar]
Associated Data
This section collects any data citations, data availability statements, or supplementary materials included in this article.
Supplementary Materials
Clinical and nutritional characteristics of the population studied throughout the study
| Weekly visits | Groups
|
P-value* | |||||||||||
|---|---|---|---|---|---|---|---|---|---|---|---|---|---|
| Control (N = 24)
|
Tomato (N = 26)
|
||||||||||||
| 1 | 2 | 3 | 4 | 5 | 6 | 1 | 2 | 3 | 4 | 5 | 6 | ||
| Clinical evaluation | |||||||||||||
| Weight (kg) | 69.7 ± 11.8 | 69.9 ± 11.9 | 69.7 ± 11.7 | 69.9 ± 12.0 | 69.7 ± 11.9 | 69.1 ± 12.5 | 67.8 ± 12.6 | 69.0 ± 12.4 | 69.0 ± 12.3 | 69.0 ± 12.4 | 67.7 ± 12.4 | 67.6 ± 12.6 | 0.76 |
| BMI (kg/m2) | 26.9 ± 4.1 | 27.1 ± 4.1 | 27.0 ± 4.0 | 27.0 ± 4.2 | 26.9 ± 4.1 | 26.9 ± 4.2 | 27.6 ± 5.0 | 27.6 ± 4.9 | 27.7 ± 4.8 | 27.7 ± 4.9 | 27.6 ± 4.9 | 27.6 ± 4.9 | 0.78 |
| WC (cm) | 89.4 ± 10.0 | 89.6 ± 9.9 | 90.2 ± 10.5 | 90.1 ± 10.7 | 89.9 ± 9.9 | 89.9 ± 9.9 | 89.8 ± 9.7 | 89.8 ± 9.8 | 89.9 ± 10.5 | 89.9 ± 10.0 | 88.9 ± 10.4 | 88.5 ± 10.6 | 0.30 |
| HC (cm) | 102.4 ± 8.1 | 102.3 ± 8.0 | 102.1 ± 8.1 | 102.3 ± 8.1 | 102.3 ± 7.9 | 102.4 ± 7.9 | 102.5 ± 9.0 | 102.8 ± 8.4 | 102.7 ± 9.2 | 102.9 ± 9.6 | 102.2 ± 9.2 | 102.3 ± 9.5 | 0.19 |
| SBP (mmhg) | 95.7 ± 5.3 | 98.5 ± 10.6 | 100.0 ± 10.0 | 98.5 ± 12.1 | 97.1 ± 9.5 | 97.1 ± 13.8 | 105.3 ± 12.8 | 103.0 ± 13.0 | 101.0 ± 11.1 | 100.0 ± 11.2 | 100.7 ± 16.0 | 101.6 ± 12.1 | 0.32 |
| DBP (mmhg) | 67.1 ± 7.5 | 72.8 ± 7.5 | 70.0 ± 8.1 | 71.4 ± 10.6 | 68.5 ± 8.9 | 70.0 ± 10.0 | 67.2 ± 8.3 | 68.2 ± 7.6 | 68.4 ± 8.0 | 70.0 ± 10 | 70.0 ± 10 | 71.1 ± 10.7 | 0.76 |
| Nutritional evaluation | |||||||||||||
| Carbohydrates (%) | – | 51.1 ± 8.5 | 50.1 ± 8.7 | 50.1 ± 6.4 | 48.6 ± 7.3 | 49.5 ± 9.3 | – | 52.3 ± 7.6 | 49.8 ± 7.6 | 50.8 ± 7.9 | 50.9 ± 8.3 | 50.9 ± 7.5 | 0.81 |
| Sugars (%) | – | 15.7 ± 8.0 | 13.5 ± 7.4 | 13.2 ± 7.0 | 12.4 ± 6.1 | 13.4 ± 6.5 | – | 15.7 ± 8.0 | 14.3 ± 7.5 | 15.3 ± 7.8 | 15.5 ± 7.0 | 14.6 ± 7.2 | 0.43 |
| Fiber (g) | – | 23.3 ± 10.1 | 26.6 ± 8.6 | 25.6 ± 7.2 | 25.2 ± 7.4 | 25.8 ± 7.7 | – | 22.7 ± 8.0 | 25.2 ± 7.6 | 25.4 ± 6.7 | 24.4 ± 7.4 | 24.6 ± 7.0 | 0.70 |
| Fat (%) | – | 32.9 ± 7.6 | 33.3 ± 6.9 | 33.2 ± 6.0 | 34.1 ± 7.3 | 34.7 ± 7.8 | – | 32.5 ± 6.1 | 33.8 ± 6.1 | 33.0 ± 5.7 | 33.3 ± 7.5 | 32.8 ± 6.5 | 0.78 |
| Proteins (%) | – | 15.8 ± 2.6 | 16.3 ± 3.1 | 16.5 ± 3.4 | 17.1 ± 2.8 | 15.7 ± 3.1 | – | 15.1 ± 2.8 | 16.2 ± 2.9 | 16.0 ± 3.3 | 15.7 ± 2.9 | 16.1 ± 3.1 | 0.24 |
| Alcohol (g/week) | – | 4.7 ± 1.3 | 3.0 ± 0.9 | 3.6 ± 2.8 | 2.3 ± 1.3 | 3.8 ± 1.1 | – | 6.4 ± 1.4 | 2.0 ± 1.6 | 7.6 ± 1.9 | 6.4 ± 1.2 | 2.3 ± 1.6 | 0.57 |
| Fish (g/week) | – | 0.30 ± 0.07 | 0.26 ± 0.04 | 0.34 ± 0.08 | 0.30 ± 0.07 | 0.30 ± 0.07 | – | 0.36 ± 0.04 | 0.40 ± 0.05 | 0.50 ± 0.05 | 0.45 ± 0.05 | 0.40 ± 0.05 | 0.98 |
| Omega-3 (g/week) | – | 0.38 ± 0.2 | 0.22 ± 0.04 | 0.25 ± 0.06 | 0.19 ± 0.04 | 0.81 ± 0.2 | – | 0.40 ± 0.05 | 0.30 ± 0.06 | 1.1 ± 0.5 | 0.56 ± 0.7 | 0.48 ± 0.07 | 0.25 |
Notes: Data represent the mean ± SD.
P-values using repeated-measures analysis of variance. Visit 1 was screening. Treatment started on visit 2 and ended on visit 6.
Abbreviations: N, number of subjects; BMI, body mass index; WC, waist circumference; HC, hip circumference; SBP, systolic blood pressure; DBP, diastolic blood pressure; SD, standard deviation.